Thursday 9 January
Baillie Gifford European Growth Trust PLC ex-dividend date
BlackRock Frontiers Investment Trust PLC ex-dividend date
Martin Currie Global Portfolio Trust PLC ex-dividend date
Primary Health Properties PLC ex-dividend date
Scottish Oriental Smaller Co Trust PLC ex-dividend date
Month: January 2025 (Page 10 of 12)

You knew that MRCH was a dividend hero and watched as the price fell.
The previous year’s dividend was 27.10p. Price 350p a yield of 7.8%.
You also knew that MRCH had dividend reserves to pay the dividend in times of market stress.
You decide to buy and for this example, you decide just to re-invest the dividends back into MRCH.

You decide to take out your stake and re-invest in another high yielder.
You have achieved the holy grail of investing of having a Trust in your portfolio that pays you an income at zero, zilch, nothing cost.
The current yield with MRCH is 5% and if you re-invested in another Trust yielding 10% your yield on your initial buy would be 15% pa.
GRS
If a 45-year-old invested £350 a month in top dividend shares, here’s what they could have by retirement
Jon Smith outlines how an investor could make use of high-yielding dividend shares to accelerate the growth of a portfolio.
Posted by Jon Smith
Published 6 January

When investing, your capital is at risk. The value of your investments can go down as well as up and you may get back less than you put in.
You’re reading a free article with opinions that may differ from The Motley Fool’s Premium Investing Services.
Dividend shares are a great option for investors to consider when it comes to trying to build long-term gains to enjoy by retirement. Even if someone is starting out with no portfolio by the age of 45, there’s still plenty of time to make use of the stock market to build wealth. Here’s what a regular investment could build up to over time.
Little but often
I think some investors are surprised when they find out that there are large-cap stocks that currently have a dividend yield in excess of 10%. Even though some of these are quite risky, the point is that top dividend shares can offer lucrative yields.
The benefit of this is that each year, the dividends that get paid can be used to buy more of the same stock. This means that the following year, the amount made from dividends can increase, even without the investor putting more cash in. Over the course of the two decades before 65 comes around, the compounding impact can be significant.
Investing each month has the added benefit of meaning that hot stocks at that point in time can be purchased. If someone only bought shares at the beginning of each year, they could miss out on opportunities during the year. Yet by putting money to work more frequently, it provides more potential to jump on something in a timely manner.
A high-yield option
For example, a stock that some investors might want to consider as part of this strategy is Assura (LSE:AGR). The UK-based real estate investment trust (REIT) focuses on buying, developing and then managing primary healthcare properties. This includes things such as GP surgeries and medical centres.
Over the past year, the share price has dropped by 19%, which has been a factor in pushing up the dividend yield to a generous 8.58%. The dividend per share payments have also been increasing for the past few years.
Please note that tax treatment depends on the individual circumstances of each client and may be subject to change in future. The content in this article is provided for information purposes only. It is not intended to be, neither does it constitute, any form of tax advice.
The REIT generates money primarily through the rental income of the portfolio. This creates stable cash flow, which in turn can be used to pay out as dividends. The interim results showed a half-year payout of £44.7m, up from £42.5m from the same period last year.
One concern that has pushed down the share price is high interest rates. The company has a loan-to-value ratio of 49%. This means that almost half of a project is funded by cash, with the other half being debt. Naturally, the higher the interest rate, the higher the cost of taking on new debt.
Getting the numbers together
If a 45-year-old investor was in a position to invest £350 a month with a dividend portfolio yielding 8.5%, a portfolio could quickly build. Two decades later, this could be worth £221.3k. In theory, the following year this could generate £18.8k in income alone.

Income fund picks for your portfolio in 2025
23 December 2024
Fund selectors give their income fund picks for investors looking for high quality companies and growing dividends.
By Patrick Sanders
Reporter, Trustnet
Income funds remain a crucial component of many investors’ portfolios, particularly for those approaching retirement and looking for a steady source of income. However, income funds are not exclusive to older investors. Indeed, following a year of interest rate cuts, the outlook for income-focused strategies may be brightening.
Below, Trustnet asked fund selectors for their income fund suggestions for 2025.
Blackrock UK Income
In the home market, Jason Hollands, managing director at Evelyn Partners, saw potential in the £603m Blackrock UK Income fund as “the UK has long been a standout market for income seekers”.
Managed by Adam Avigdori and David Goldman, the portfolio targets companies with the potential to grow their dividends rather than businesses with high but stagnant yields. Hollands explained that this has led to attractive capital growth and performance compared to its competitors.
Indeed, the strategy has posted a top quartile return of 30.1% in the IA UK Equity Income sector over five years, along with a yield of 3.64%
Performance of the fund vs the sector and benchmark over 5yrs
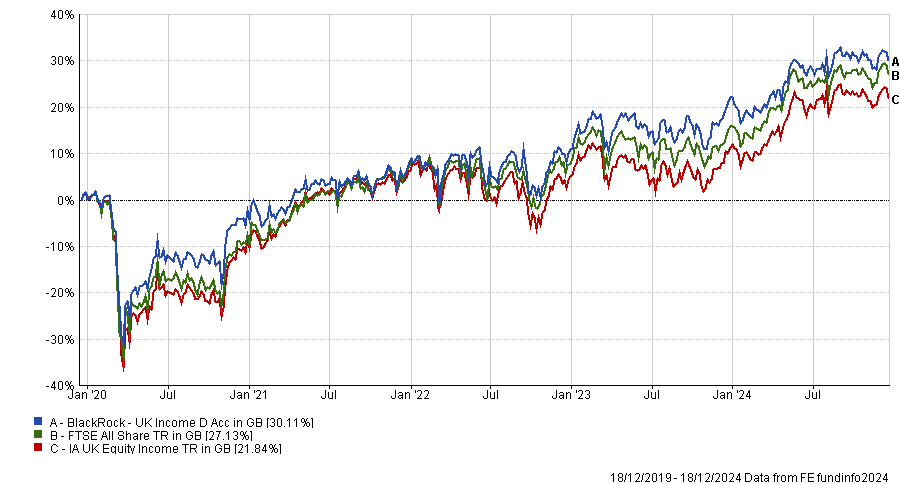
Source: FE Analytics
Hollands added that the portfolio benefits from Avigdori and Goldman’s extensive experience and willingness to shift holdings “depending on the market environment and valuations”.
As a result, Hollands concluded that while the fund may lag in stronger markets, it held up better on the downside. For example, over the past five years, the portfolio was in the top quartile for volatility, maximum drawdown and downside risk.
M&G Global Dividend
For investors interested in the global market, Charlie McCann, investment analyst at Square Mile, pointed to the £2.2bn M&G Global Dividend fund.
McCann said: “We believe the fund is well placed to meet the changing demands of markets in 2025.”
With a dividend yield of 2.35%, the fund has been one of the 10 best-performing portfolios in the IA Global Equity Income sector over one, three, five and 10 years.
Performance of the fund vs the sector and benchmark over 10yrs
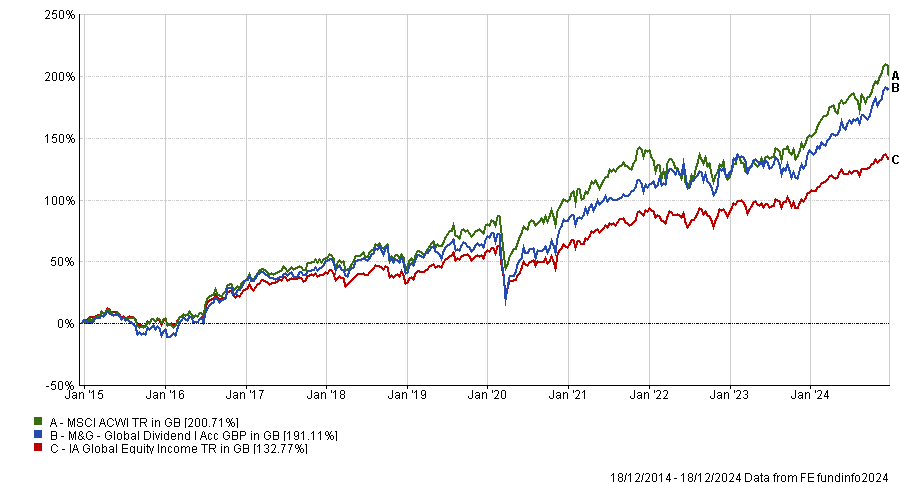
Source: FE Analytics
McCann explained that it had successfully grown the dividend over time, having achieved “more than 7% compound annual growth since its inception” and looks poised to continue growing in 2025.
Moreover, McCann said the fund benefits from a sensible investment process. The fund invests primarily in a core bucket of high-dividend stocks, supplemented by higher growth names and more cyclical parts of the market.
He explained that the allocation to each of these buckets shifted overtime in response to the current market backdrop, which allowed the fund to perform well during the market rally in the first half of 2024, while also beating the benchmark when the market broadened.
NextEnergy Solar
In the investment trust space, James Carthew, head of investment companies at QuotedData, was bullish on renewable energy and found the £373m NextEnergy Solar trust compelling.
Over three years the portfolio ranked in the second quartile of the IT Renewable Energy sector, although the tough backdrop for renewables – caused by higher interest rates – means the trust down by 18.7% in this period.
Performance of the trust vs the sector over 3yrs
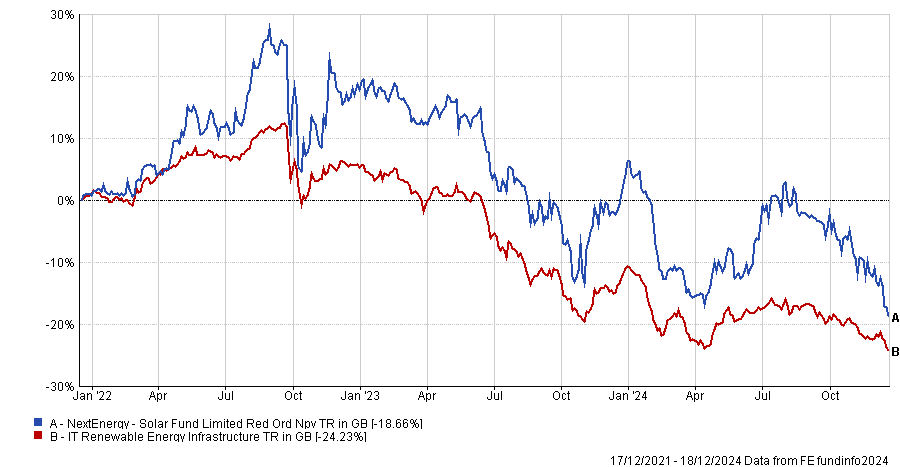
Source: FE Analytics
However, Carthew concluded the portfolio was due for a turnaround. The trust operates at a 32% price discount compared to its net asset value (NAV), with a “whopping dividend yield” of 13.06%, which would be covered by 1.1x to 1.3x cash earnings.
Furthermore, Carthew explained that the company started a capital recycling plan in 2023, which has helped fund share buybacks and narrow the discount, which will provide the opportunity for a broad variety of new investments moving forward.
Guinness Asian Equity Income
Finally, Alex Watts, fund analyst at interactive investor, suggested the £266m Guinness Asian Equity Income fund for investors who exposure to the Asian market.
This fund has generally outperformed its sector, with a top quartile performance of 125.7% over the past 10 years. While it did slide into the second quartile over five years, it rallied and returned to the first quartile over three.
Watts added that with a 3.8% yield, it was one of the highest-yielding portfolios in its sector.
Performance of the fund vs the sector and benchmark over 10yrs
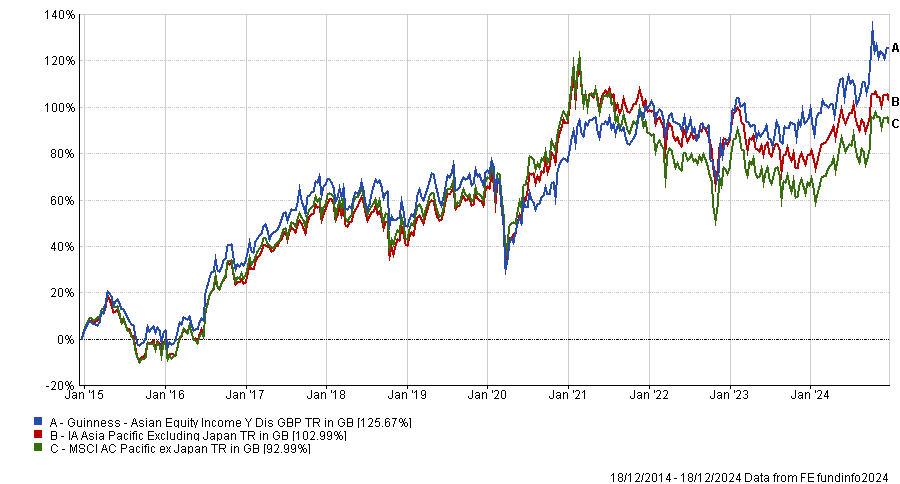
Source: FE Analytics
Watts said: “Towards the end of 2024, the region benefitted from early signs of a recovery of its largest market, China, as share prices reacted positively to a range of stimulus measures.”
Watts explained that the fund’s 38.4% weight to China has positioned it well to play on this recovery if it continues. However, it is otherwise well diversified with an equally weighted approach, preventing overexposure to any company.
Moreover, Watts argued that with most of the portfolio’s revenue based on the “economies and trade of the Asia Pacific region”, it was an attractive diversifier particularly for those wanted to move away from the concentrated US market.
Chapter 11: Dividend investing
Posted on By Phil Oakley
Updated: August 2024
If you are watching or listening to the news at the end of the day you will usually be told what happened to the stock market that day. More precisely, you will be told whether it went up or down in price.
Yet investing in shares is not just about changes in prices. When you own a share of a company you are often paid a dividend as well. Dividends can be very important. They can form a major part of any long-term savings plan and also a source of income to live on.

In this chapter, we are going to look at why dividends are important and how you can use them to build up your savings pot or as a source of income. Then we will look at some of the tools that ShareScope has to help you find some dividend paying shares that can help you meet your goals.
What are dividends?
Dividends are your share of a company’s after-tax profits paid to you during a year.
They make up part of the investment return from owning a share. However, unlike a share price that goes up but then goes down again, a dividend once it has been paid cannot be taken away from you.
What’s good about dividends is that they represent a real, tangible return on the shares that you own.
The same cannot be said for a rising share price. Share prices tend to move up and down a lot and there’s no guarantee that you will sell for a profit.
The return from earning a share
Return = Change in share price + dividends received
Investing in shares that pay chunky dividends and holding them for a long time can be a great way to build up your portfolio’s value.
That’s because the dividend from shares and the reinvestment of them is where the real money can be made from the stock market over the long haul.
Why is this?
Dividends and the magic of compound interest
I’ve never been able to find the source, but Albert Einstein was rumoured to have said that “the most powerful force in the world is compound interest”.
When it comes to investing – and dividend investing in particular – I’m inclined to agree with him.
Compound interest is essentially earning interest on the interest that you’ve already been paid. This is what tends to happen if you leave money in a savings account for a number of years.
Let’s say that you put £100 into a savings account that pays interest of 10% per year at the end of the year.
You have a choice of what to do with the interest that you receive. You can either spend all or some of it or you can reinvest it.
In the first year, you will receive £10 of interest on your £100 of savings. If you spend the interest every year, this is what happens to your interest income and savings over five years.
| Year | 1 | 2 | 3 | 4 | 5 |
|---|---|---|---|---|---|
| Starting Amount | £100 | £100 | £100 | £100 | £100 |
| Interest at 10% | £10 | £10 | £10 | £10 | £10 |
| Spent | -£10 | -£10 | -£10 | -£10 | -£10 |
| Ending Amount | £100 | £100 | £100 | £100 | £100 |
You receive £10 every year to spend and at the end of five years the value of your savings is still £100.
You’ve had £50 of interest income and preserved your savings pot. So your initial £100 has given you £150 of value.
But what would happen if you didn’t spend the interest and reinvested it back into the savings account at 10%? If you compound the interest you receive.
| Year | 1 | 2 | 3 | 4 | 5 |
|---|---|---|---|---|---|
| Starting Amount | £100 | £110 | £121 | £133.10 | £146.41 |
| Interest at 10% | £10 | £11 | £12.10 | £13.31 | £14.64 |
| Spent | £0 | £0 | £0 | £0 | £0 |
| Ending Amount | £110 | £121 | £133.10 | £146.41 | £161.05 |
Well, after five years, the value of your £100 would have grown to £161.05 and your annual interest income would have grown to £14.64.
The longer you reinvest your income the bigger the potential annual income and the value of your savings pot. This is the power of compound interest at work.
The one big caveat here is that the interest rate has stayed the same for five years.
This might be the case with a fixed term savings account or a bond, but is rarely the case for other investments. I’ll say a bit more on the effect of changing interest rates a little later on.
You can use this strategy of compounding to very good effect with dividend paying shares.
Instead of spending the dividend you receive, you use it to buy more shares in the company which paid you, which in turn gives you more dividends in the years ahead.
Repeat this process for long enough – the longer the better – and it is possible to turn a small initial sum of money into a large one. This can be the case even if dividends per share or the share price do not change.
Let me show you how this can work.
Let’s say that you buy 1000 shares in a company called Bob’s Book Stores plc at 100p per share (so an investment of £1,000) when it is paying an annual dividend per share of 4p.

Over the next thirty years the company doesn’t grow its profits but maintains them.
Dividends stay at 4p per share and the share price stays at 100p.
If you had kept your 1000 shares you would have received an annual dividend income of £40 (1000 x 4p) or £1200 over thirty years.
With your 1000 shares still worth £1000, your investment value would be £2200 (£1,000 + £1,200).
But if you had reinvested the dividends and bought extra shares (To keep things simple, I’ve ignored the impact of broking commissions and buying whole shares here) each year you’d have ended up with a much better result.
At the end of thirty years you would own 3243 shares worth £3243 and have an annual dividend income of £125. This equates to a yield on initial cost of 12.5% (£125/£1000).
An investment of £1,000 in Bob’s Book Stores over 30 years:
| Left alone | With dividends reinvested | |
|---|---|---|
| Value of shares | £1,000 | £3,243 |
| Income Received | £1,200 | £0 |
| Investment value | £2,200 | £3,243 |
| Annual income in year 30 | £40 | £125 |
| Yield on cost | 4.00% | 12.50% |
That said, if you pick the right investments you’ll find that dividends don’t stay the same for thirty years – they can often increase substantially.
This makes dividend reinvestment and the power of compound interest even more attractive – if you can find the right share at the right price. More on this in a short while.
It’s worth adding that companies which have an explicit policy of paying and growing dividends (known as a progressive dividend policy) usually aim to increase their payouts by at least the rate of inflation every year.
Dividend re-investment in the real world and total returns
Theory is all well and good, but what about what happens in the real world?
The chart below compares the value of the FTSE 100 (the lower or red line) with the value of the FTSE 100 Total Return index (the higher or blue line), which includes the effect of reinvested dividends since 1994.
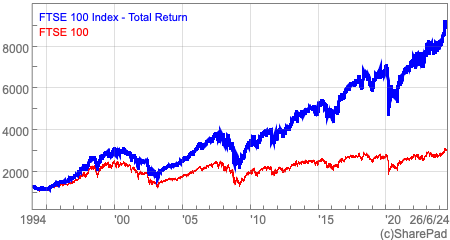
You can now see that the total return index is worth a lot more than the FTSE 100 index.
This is important as it should make you look at investment results in a different way. Investing in shares is not just about the changes in share prices, it’s about the total returns which includes the dividends you receive.
However, the point I want to get across is that dividends matter and can make up a large chunk of the returns that you get from owning shares over the long run.
Dividend reinvestment with individual companies
Buy the right share at the right time and the right price and you can see spectacular results. Take British American Tobacco (LSE:BATS) for example.
Let’s say you bought 1,000 shares of this company on the first trading day of 2000 for 332.5p (an investment of £3325 excluding stamp duty and dealing costs) when it was paying an annual dividend of 22.2p (or a dividend yield of 6.7%). The shares were very cheap as many investors ignored them and put their money into glamorous internet shares.
Just over fifteen years later though in January 2015, BAT shares are priced at 3522p and are paying an annual dividend of 144.9p. Most people would be quite happy. The shares have soared as has the annual dividend per share.
Even if they had spent their annual dividend income, their investment would have increased in value more than ten-fold to £35,220. The dividend income as a percentage of the original price paid (144.9p/332.5p) – or the yield on cost – would be an impressive 43.6%.
But say you’d reinvested your dividend income every year and bought more shares with it. Your investment would have soared in value to £69,335 with an annual dividend income of £2753.64 – or a yield on cost of 82.9%.
An investment of 1,000 shares in BAT since January 2000
| Left alone | With dividends reinvested | |
|---|---|---|
| Value of shares | £35,220 | £69,335 |
| Income Received | £1,112.60 | N/A |
| Investment value Jan 2015 | £36,332.60 | £69,335 |
| Annual income Jan 2015 | £1,449 | £2,753.64 |
| Yield on cost | 43.60% | 82.90% |
Of course, hindsight is a wonderful thing but this example does highlight three very important rules of a successful dividend re-investment strategy:
- It helps to buy shares at a cheap price. Back in 2000, companies like BAT were out of favour as investors piled into glamorous internet and technology shares. With a dividend yield of 6.7%, the shares looked – and turned out to be – very cheap given that the business was not in trouble and had been increasing its dividend.
- The importance of dividend growth. Your returns can be turbo-charged if the company is capable of delivering high rates of dividend growth. BAT’s annual dividend growth over the last 15 years averaged 13.3%.
- The power of time. The longer you invest for, the greater the power of compounding on your investment returns.
The emotional benefits of dividend re-investment

This is a very powerful investing strategy, especially for shares with high dividend yields that are capable of growing their dividends year after year.
What’s particularly good about it is that you focus your attention on the performance of the company and its ability to keep paying a growing dividend rather than what’s happening to the share price. The bigger the amount of your investment return that comes from dividends and their reinvestment, the less you tend to worry about share prices.
In fact, with this investment strategy you can actually welcome falling share prices. As long as the underlying business is sound, a falling share price allows your dividend to buy more new shares which means more dividends to potentially boost your long term returns.
With this mindset, you worry less and concentrate on what’s important rather than the short-term whims of the stock market. To me this is proper investing and more people would be better off – financially and emotionally – if they put their money to work this way.
That said, evidence suggests that very few investors follow this strategy as the average time that people hold shares is becoming increasingly shorter which means that there is insufficient time for it to pay off.
Buy and hold is not the same as buy and forget

This strategy is based on holding on to a share for a long period of time. This is known as a buy and hold strategy. However, this must not be confused with a buy and forget strategy.
Whilst you do hear stories of people who had left shares invested and forgotten about them for 30 years, and then to find out they had become millionaires, it is probably wiser to keep an eye on your investment from time to time.
I’m not talking about obsessing about share prices every day. Instead you should read the company’s half year and full year results statements to see that all is well and that your dividend is still safe and growing.
The other thing to keep an eye on from time to time is the dividend yield on your shares. This is important because it represents the rate of interest you are getting on your reinvested dividends.
Back in 2000, the dividend yield on BAT shares was 6.7%. This was the income return you would get by reinvesting the dividend. In January 2015, the dividend yield – and reinvestment rate – had fallen to 4.1%. The rate of dividend growth has also slowed down a lot. When this happens, the incremental value from reinvesting diminishes.
What you need to be constantly asking yourself is whether you can reinvest at a higher rate elsewhere? You can search for shares with high dividend yields and dividend growth potential with ShareScope. I’ll be showing you how to do this shortly.
How to set up your own dividend reinvestment plan

Reinvesting your dividends is fairly straightforward. With funds (not exchange traded funds or ETFs) you can buy what are known as accumulation units that do this for you. Alternatively you can set up an automatic dividend reinvestment plan for individual shares with your broker (often restricted to shares that are in the FTSE 350 index) who will reinvest dividends for you for a small fee.
If you don’t want to reinvest back into the same share (for example if the price has gone up a lot and the dividend yield is too low), you can always just let your dividends increase your cash account over a year and then reinvest the money later on when you find a good dividend paying share at a reasonable price.
Looking for reliable dividend payers with ShareScope
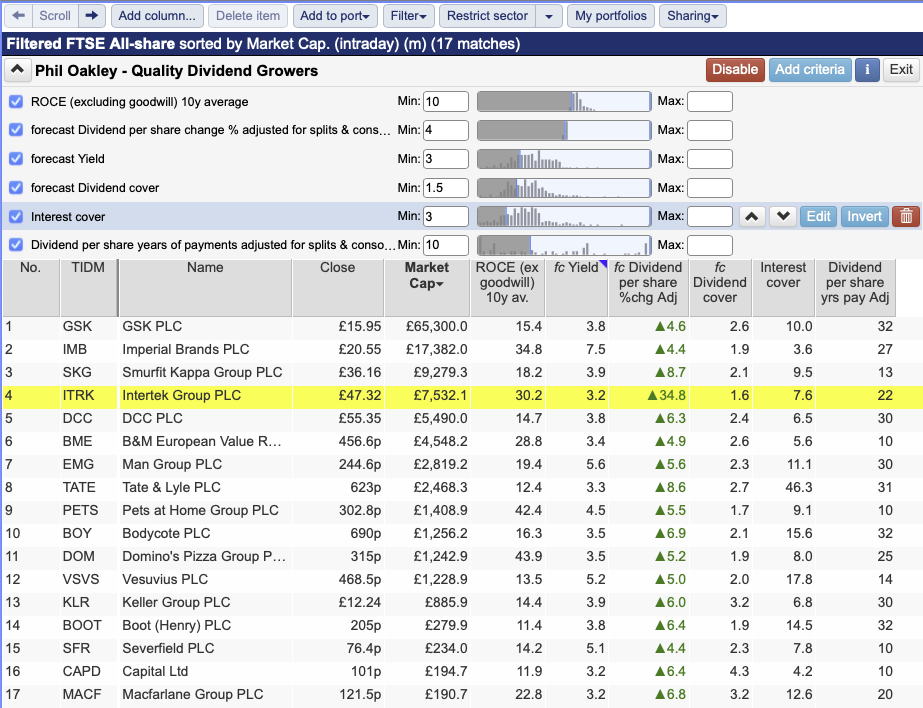
I’m now going to show you how to look for the shares of companies that could be good dividend shares in ShareScope. This is fairly easy to do with the filter function and by adding the criteria that you want the shares to match. You can see a filter that I’ve built below.
I’ve set up this filter to look for shares with the following criteria:
- A minimum dividend yield of 3% – I want a reasonable starting dividend return.
- Minimum dividend cover of 1.5 times – the higher the cover, the better. However, I don’t want to exclude mature industries such as tobacco, telecoms and utilities where dividend cover can be lower but still mean that the dividend can be quite safe.
- Dividend years of payments – At least 10 years. This means that companies that have missed a dividend payment – and often do when times get tough – can be excluded from the list of possible investments.
- A minimum return on capital employed (ROCE) of 10% – This would indicate that the company concerned is a reasonable business and can earn respectable returns on the money it invests, which in turn suggests that it can keep on paying a dividend.
- Forecast dividend growth greater than the rate of inflation – I’ve set a minimum growth rate of 4% so that the dividend increases in value after inflation.
The temptation when you find shares that look interesting based on their numbers is to rush in and buy them.
This can often be a mistake.
Take your time and do your homework.
- Study the company’s financial history
- Read the latest news
- Check that the directors own a decent chunk of shares
- Look at the recent share price performance.
This should be seen as the bare minimum amount of research that you should do.
Following a disciplined approach means that you can learn a great deal about a company.
I also like to read the front half of the company’s annual report which gives a flavour of the company and its short- and longer-term objectives.
You won’t know everything – no outside investor ever does – but you should have enough information to know what you are buying and why.
The real skill in investing often rests with having the patience to wait and pay the right price.
Dividends to live on
People regularly rely on the dividend income from shares as a source of income to live on – especially in retirement and they are not buying an annuity.
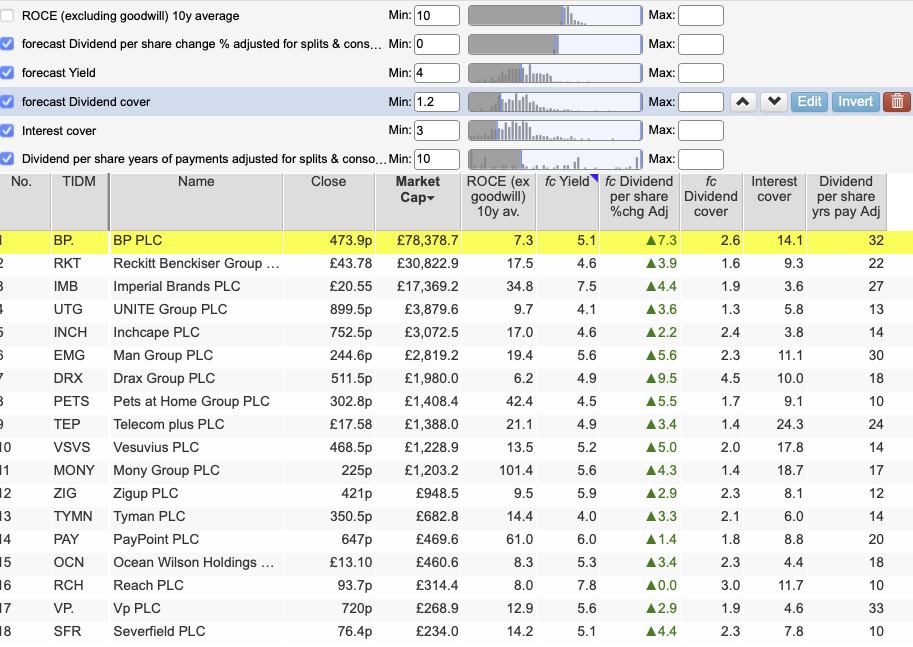
If you are looking for dividend income to supplement your pension, then you can look for shares that might help you to do that in ShareScope. Again, I’ve used the filter function in ShareScope to do this.
The criteria you choose for your filter are up to you. I’ve chosen slightly different criteria to my previous dividend growth filter.
- A minimum dividend yield of 4% – The yield needs to be sufficiently high to provide a reasonable amount of income.
- Dividend cover of at least 1.2 times – so reasonably covered by profit but allowing a large portion of profits to be paid out.
- Continuous dividend payments for at least ten years. I want some comfort that the company has been able to pay some dividend when times have been tough. This gives me some confidence that it might be able to weather economic storms in the future.
- Minimum forecast dividend growth of zero. I am looking for the dividend to be at least maintained at its current level.
Using dividends to find outstanding companies
Outstanding companies don’t necessarily have to pay a dividend or have paid one for a long period of time.
However, companies that have a long track record of increasing their dividend per share every year are often those with the characteristics of great companies.
An ability to keep increasing a dividend payout in recessions, pandemics and in the face of competition is one that generally serves investors well – again with the proviso that they buy the shares at a fair price.
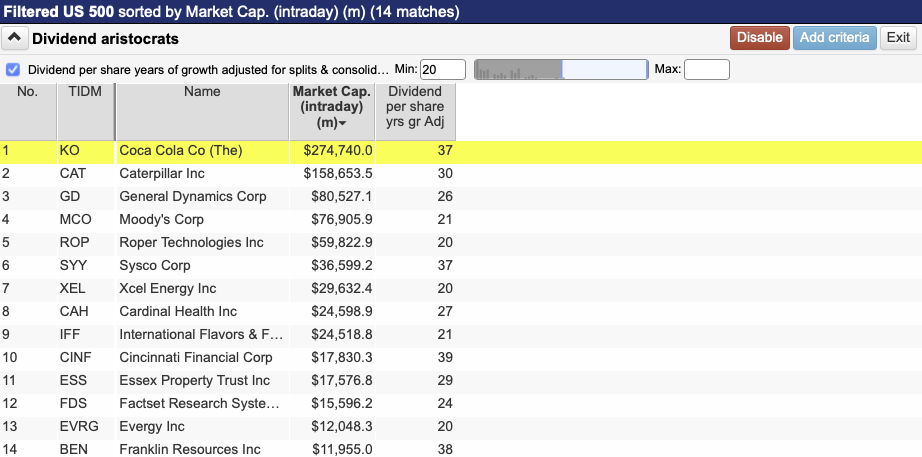
When it comes to the UK stock market, only 10 companies have been able to increase their dividend per share for 20 years or more.
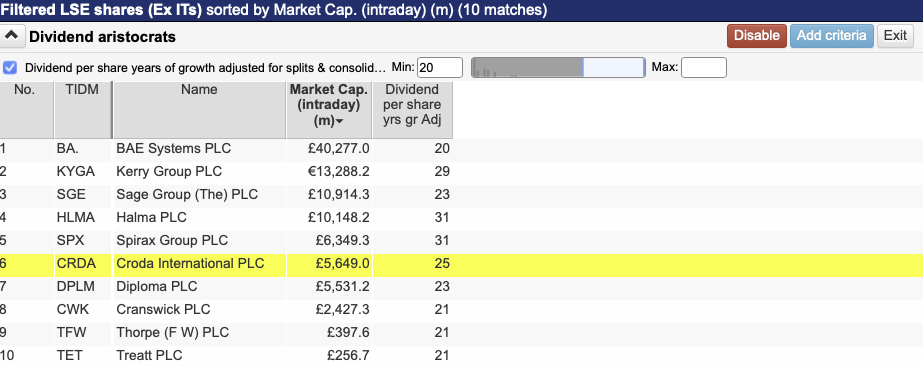
In the S&P 500 over in the US, that number increases to 14.
How much would I need in an ISA to earn a £500 monthly passive income?
Story by Ben McPoland

How much would I need in an ISA to earn a £500 monthly passive income?© Provided by The Motley Fool
Both the Cash ISA and Stocks and Shares ISA allow investors to keep 100% of the returns they earn, free from taxes. But in terms of the possible returns, there’s a massive difference.
Even if the next decade sees a better Cash ISA return (due to higher interest rates), it’s unlikely to surpass average stock market returns.
Of course, this isn’t an either/or situation, as many people hold both. One is essentially a tax-free savings account while the other involves investing in the stock market. The latter is riskier because individual shares don’t always rise — though the overall market does over time — and dividends aren’t guaranteed.
Please note that tax treatment depends on the individual circumstances of each client and may be subject to change in future. The content in this article is provided for information purposes only. It is not intended to be, neither does it constitute, any form of tax advice. Readers are responsible for carrying out their own due diligence and for obtaining professional advice before making any investment decisions.
I just want to make it completely clear that the One and True Passive Income is
The Cash ISA
Cash ISA rates are influenced by the Bank of England base rate, which is currently 4.75%. If an account is paying someone 4.5%, they would need about £133,500 in it to generate £500 a month in interest.
Starting from scratch and saving £10k of the £20k annual contribution limit, that would take roughly 11 years to reach. This assumes all cash is kept in the account along the way to fuel the compounding process.
However, rates are forecast to fall over the next couple of years as inflation stabilises. But how fast and when exactly is anyone’s guess. Therefore, predicting where rates will be in a decade’s time is impossible. They might be at 2%.
Investing in stocks
For an investor targeting higher returns then, a Stocks and Shares ISA is a superior vehicle. That’s because most providers offers a smorgasbord of investment options, including growth and dividend shares, various investment trusts, and exchange-traded funds (ETFs).
Assuming the average 9.6% return figure, it would only take around nine years investing £10k annually to reach the £133k target. At that point, an investor could switch to dividend shares yielding 4.5% to aim for £6,000 a year — or £500 a month — in passive income.
A share to consider
One FTSE 100 stock from my ISA portfolio that I think has excellent long-term growth prospects is Pershing Square Holdings (LSE: PSH). This is an investment trust that offers exposure to the hedge fund of star Wall Street investor Bill Ackman.
Hedge funds are typically reserved for wealthy individuals — those who might view the £20k ISA limit as pocket change ! So this is a unique investment.
Between 2019 to 2023, Ackman’s fund returned 28% annually, handily beating the S&P 500. Over the past five years, the Pershing Square share price has rocketed 171% higher.
However, it’s important to note that Ackman manages an incredibly concentrated portfolio. The trust currently holds just 11-13 stocks. The risk here is that he loses the Midas touch and backs a handful of duds.
Looking ahead though, I anticipate market volatility with Donald Trump back in the White House promising widespread tariffs. Ackman tends to thrive in such choppy waters, exploiting the volatility to snap up long-term bargains and make bold moves.
The post How much would I need in an ISA to earn a £500 monthly passive income? appeared first on The Motley Fool UK.
All I want is an investment trust on a juicy discount…
Investment trust discounts, under the right circumstances, could provide investors with significant return potential…
Josef Licsauer
Updated 18 Dec 2024
Disclaimer
This is not substantive investment research or a research recommendation, as it does not constitute substantive research or analysis. This material should be considered as general market commentary.
Picture a bustling British high street during a Boxing Day sale. Shoppers eagerly queue for bargains, drawn by the irresistible allure of a good deal. It’s quintessentially British to love a discount—whether it’s a half-price Greggs sausage roll or the Black Friday sale frenzy borrowed from the US. This passion for bargains extends beyond the aisles and into the world of investing. Here, discounts on investment trusts evoke a similar thrill: the opportunity to buy £100 of assets for £80. Who could resist?
But, as with any sale, not all bargains are created equal. Discounted trusts can offer significant upside if their share prices recover, but they also can signal significant risks. This raises a question: has investing in the most discounted trusts over the years been an effective strategy for delivering meaningful returns? In pursuit of this answer, we dove headfirst into the bottomless well of data, beginning with a broad analysis of how discounts in the investment trust universe behave during market cycles, before looking at those trading on the very widest discounts.
Extreme discounts
For some investors, discounts represent a compelling opportunity to capture additional upside, but they can also reflect market sentiment, management quality, and sector challenges, introducing another potential layer of risk for investors. At extreme levels, we believe that the widest discounts often carry a warning to investors, signalling a need for caution rather than opportunity.
A deep analysis of historical data reinforces this point. Our analysis shows that trusts trading at the steepest discounts, mostly those over 50% have invariably delivered negative share price returns in subsequent one- and three-year periods. These extreme discounts may stem from significant underlying issues, such as management struggles, sector-specific headwinds, or the obsolescence of an investment focus. The result tends to be persistent poor performance, making a strategy of chasing the deepest discounts a hazardous proposition. Blindly pursuing these perceived bargains can lead to bitter disappointment and we show the results of buying trusts on the widest discounts with a pure dartboard approach in the table below. It is not happy reading!
Widest discounts compared to one and three-year performance
| Year | Trust with the widest discount at the start of the year | Discount (%) | One-year cumulative return (%) | Three-year cumulative return (%) |
| 2005 | Tiger Royalties and Investments | -35.8 | 30.9 | 52.3 |
| 2006 | Athelney Trust | -23.4 | 23.9 | -38.6 |
| 2007 | Seed Innovations | -89.8 | 40.9 | -57.8 |
| 2008 | Seed Innovations | -91.8 | -31.0 | -88.1 |
| 2009 | Eurocastle Investment | -97.2 | -93.1 | -95.2 |
| 2010 | Tiger Royalties and Investments | -72.9 | -9.2 | -52.9 |
| 2011 | DCI Advisors Limited | -77.1 | -19.5 | -54.8 |
| 2012 | DCI Advisors Limited | -85.3 | -35.5 | -44.3 |
| 2013 | Livermore Investments | -62.6 | -3.0 | 3.9 |
| 2014 | DCI Advisors Limited | -52.9 | -0.9 | -71.8 |
| 2015 | DCI Advisors Limited | -67.2 | -42.5 | -75.4 |
| 2016 | GRIT Investment Trust | -82.4 | -11.3 | -86.5 |
| 2017 | Alternative Liquidity Fund | -76.9 | -40.0 | -51.2 |
| 2018 | DCI Advisors Limited | -62.1 | -15.8 | -21.1 |
| 2019 | Alternative Liquidity Fund | -54.4 | -3.3 | -44.5 |
| 2020 | DCI Advisors Limited | -75.0 | -6.3 | -25.0 |
| 2021 | DCI Advisors Limited | -77.7 | -26.7 | -13.3 |
| 2022 | Tetragon Financial | -69.6 | 1.0 | N/A |
| 2023 | Seed Innovations | -70.0 | -12.4 | N/A |
Source: Morningstar. N/A – unavailable given the rolling three-year return data range.
Past performance is not a reliable indicator of future results
One can only apologise for the volume of data below, but to help provide further context, we’ve also plotted the average one- and three-year rolling returns of the 20 widest discounted trusts each year against the FTSE All-Share. Whilst this isn’t the fairest of comparisons for performance in all cases, we think it is a useful benchmark for the investor looking for bargains in the UK market to consider. Whilst there were years where the trusts outperformed, such periods accounted for only 36.8% of one-year periods and 21.1% of three-year periods, between 2005 and 2023. This helps reinforce our analysis that buying trusts with extremely wide discounts is a high-risk strategy. Deep discounts often signal structural or irreparable issues, and should serve as a warning to investors to tread very carefully.
So, where does this leave investors wanting to take advantage of discounts? A sensible starting point, in our view, is avoiding the deepest discounted trusts and instead focussing on trusts trading at more moderate discounts, supported by positive tailwinds and a higher quality portfolio. These may still trade at wider discounts than their historical averages but could present a better balance of risk and reward.
To test this theory, we revisited the data, this time excluding trusts trading at discounts wider than 40%. The results were telling. In every year except 2005 and 2006—when no trusts traded wider than a 40% discount—average one- and three-year returns improved significantly. By plotting the data in the same way as before, we found that these trusts (the 20 widest, excluding those above 40%) outperformed the FTSE All-Share on 57.9% of occasions over one year and 36.8% over three years. This is a substantial improvement over the performance of the very widest discounts above, but still underlines the point that just picking wide discounts won’t necessarily lead you to a good result.
Discount comparison (excluding 40%+)
| Year | Widest discount (%) | Avg discount (over 20 widest trusts %) | Avg one-year TR (%) | Avg three-year TR (%) |
| 2005 | -35.8 | -21.1 | 27.6 | 67.9 |
| 2006 | -23.4 | -15.5 | 20.7 | -14.5 |
| 2007 | -34.1 | -16.0 | 1.2 | -15.8 |
| 2008 | -37.7 | -28.7 | -24.2 | -19.2 |
| 2009 | -37.1 | -28.9 | 46.6 | 75.4 |
| 2010 | -39.4 | -31.6 | 17.0 | 30.7 |
| 2011 | -39.7 | -29.1 | 3.0 | 12.6 |
| 2012 | -39.7 | -33.3 | 1.4 | 29.1 |
| 2013 | -39.9 | -29.0 | 9.0 | 20.0 |
| 2014 | -36.2 | -30.3 | 6.7 | 33.3 |
| 2015 | -39.9 | -30.0 | -0.4 | 30.3 |
| 2016 | -37.8 | -30.2 | 23.5 | 39.6 |
| 2017 | -39.0 | -31.4 | 11.2 | 14.0 |
| 2018 | -39.9 | -28.3 | -6.3 | 1.2 |
| 2019 | -37.9 | -27.7 | 11.1 | 51.4 |
| 2020 | -38.3 | -30.6 | 7.5 | 1.3 |
| 2021 | -39.5 | -34.4 | 18.7 | 21.2 |
| 2022 | -39.7 | -32.4 | -4.7 | N/A |
| 2023 | -39.5 | -35.3 | 3.3 | N/A |
Source: Morningstar. N/A – unavailable given the rolling three-year return data range.
Past performance is not a reliable indicator of future results
Investing in discounted trusts always comes with a risk, even those at relatively moderate discounts, that they may persist for years. Discounts can also widen further, driven by factors such as weak relative performance, illiquid shareholder registers, or even sector-specific pessimism. However, we think the key is avoiding trusts hampered by structural challenges, as these will likely erode future returns or those with poor corporate governance.
This is why we believe it’s important for investors to focus on trusts that are supported by an array of strong fundamentals, like experienced management and a well-resourced investment team that can add an edge when it comes to stock selection, or trusts benefitting from favourable sector trends. My colleague recently advocated a similar case for trusts in the alternative income sector.He argues that there is a risk of falling into ‘value traps’. He concludes that the focus should be on quality trusts, that have been unfairly derated alongside their lower-quality peers, and focussing on those that exhibit resilience rather than being swayed purely by the allure of a wide discount.
Many factors can play a role in narrowing the discount meaningfully over time, or even shifting a trust to a premium rating. In the right environment, we think that patient, long-term investors that incorporate the analysis of discounts into their investment decisions, rather than being solely guided by them, could unlock compelling return potential.
Opportunities in today’s market
History may not repeat, but it often rhymes, much like stock market cycles. After enduring a series of seismic events over the past few years, including Brexit, the pandemic, a reversal in globalisation, conflicts in Europe and the Middle East, surging inflation, and political instability, we believe certain sectors, and indeed the trusts aligned with them, now offer compelling opportunities for investors.
One particularly interesting area is technology. Semiconductor stocks, and semiconductor-related stocks, fuelled by soaring demand from artificial intelligence (AI), have performed exceptionally well over the last couple of years, which has, in turn, rendered the sector seemingly expensive. Investment trusts like Allianz Technology Trust (ATT) have benefitted significantly from the AI surge, driving performance across its portfolio, and delivering a NAV total return of 40.0% over the past 12 months. Yet, or perhaps because of this, ATT currently trades at a discount of around 10.0%, wider than its average over five years of 7.1% and the sector’s average of 8.0%. As such, it offers investors exposure to market-leading tech giants, such as NVIDIA and Microsoft, at a 10% discount to their market value. Beyond the titans, ATT also provides exposure to differentiated large- and mid-cap stocks with significant growth potential, further diversifying its return profile.
We believe this valuation gap represents a clear opportunity to tap into one of the most dynamic sectors in global markets. We see potential in ATT’s double-digit discount narrowing, potentially delivering an extra uplift to investor returns as it does.
Looking through a slightly different lens, Fidelity Emerging Markets Limited (FEML) presents a potentially compelling opportunity for investors seeking both emerging market and tech exposure. The trust’s managers have built up strategic positions in Taiwanese and South Korean stocks over time, particularly those heavily integrated into the global technology supply chain and enablers of AI. Familiar names like TSMC and Samsung stand out as obvious beneficiaries, given their dominant market positions and global reach. However, the managers have also identified opportunities in lesser-known companies, such as SK Hynix, a leader in semiconductor memory, and their new 2024 portfolio addition, Elite Material. The latter, a Taiwanese manufacturer of copper-clad laminate—an essential input for printed circuit boards—is well-positioned to benefit from surging AI-related demand.
Similarly to ATT, FEML has performed well over the past 12 months, delivering NAV total returns of 20.1%, ahead of its benchmark, yet trades at a discount of 13%, wider than both its five-year average and the sector. With exposure to multiple growth trends within emerging markets, we see the potential for FEML’s discount to narrow, rewarding patient investors over time, although we expect there to be plenty of uncertainty in the short term, depending on the outcome of US tariff decisions.
Beyond technology, private equity discounts look potentially interesting. Below, we’ve highlighted average discounts from a selection of key players in the space, comparing them to the wider sector average. Notably, three out of the five trusts trade at discounts wider than the sector, and their own ten-year average, presenting a potential opportunity in our eyes. Broadly speaking, the market derated in 2020, causing discounts to widen dramatically. This impacted investment trusts, especially those like private equity trusts, which tend to be less liquid and harder to sell during market selloffs. Since 2022, discounts have largely been narrowing, though, and looking ahead to 2025, we believe some of the headwinds that have weighed on private markets are beginning to ease, creating a potentially attractive entry point at current discount levels.
Private equity discounts
| Private equity trusts | Current discount (%) | Five-year average (%) | Ten-year average (%) |
| HVPE | -38.6 | -33.5 | -26.6 |
| PIN | -30.7 | -31.8 | -25.4 |
| CTPE | -29.3 | -27.3 | -19.1 |
| NBPE | -23.6 | -28.4 | -24.7 |
| HGT | -0.3 | -7.9 | -8.8 |
| Morningstar Investment Trust Private Equity ex 3i | -24.1 | -24.9 | -20.9 |
Source: Morningstar
Past performance is not a reliable indicator of future results
The most immediate catalyst for discounts narrowing is, in our view, an improvement in realisation activity. An improvement in dealmaking and exit conditions has been anticipated for much of 2024, driven by recovering macroeconomic conditions and a more favourable interest rate environment. So far, significant realisation activity has yet to materialise. HarbourVest recently commented that they are seeing a narrowing of the valuation gap between buyers and sellers in private equity, which they believe will lead to a “further pick-up in deal activity in 2025”.
In our view, these dynamics point to the potential for narrowing discounts on private equity trusts, alongside improved investor confidence. HG Capital Trust (HGT) which has a five-year average discount to NAV of 7.9% shows that a persistently wide discount to NAV is not necessarily guaranteed. HGT has benefitted from being in the technology space and delivering outstanding long-term NAV returns. Some trusts in the sector, particularly Pantheon International (PIN), have taken decisive action on buybacks and setting formulaic capital allocation policies. PIN’s discount has narrowed as a result, although there clearly needs to be a balance struck between buybacks and balance sheet strength in the face of the potential for realisation activity to remain muted. Trusts like CT Private Equity (CTPE), which offers exposure to a diversified portfolio of ‘lower mid-market’ private equity-backed companies, and HarbourVest Global Private Equity (HVPE), with a portfolio encompassing over 1,000 businesses ranging from hyper-growth startups to stable, cash-generative companies, both trade on discounts significantly wider than their ten-year averages. If sentiment returns to the sector, we think these trusts in particular could see their discounts tighten.
Outside of market trends and economic tailwinds, some investment trusts may see a narrowing of the discount thanks, in part, to decisive board actions. In recent years, investment trust boards have become increasingly proactive, not only by buying back shares to manage discount volatility but also by implementing strategic measures aimed at narrowing discounts more meaningfully. A prime example is Schroder Japan (SJG), which invests primarily in listed Japanese equities. Despite outperforming its benchmark over the past 12 months, the trust continues to trade at a discount wider than its five-year average, prompting the board to act.
To enhance its appeal with investors, differentiate it from peers in the Japan sector, and position the trust as a strong option for income-seekers looking beyond their traditional income-hunting grounds, the board unveiled an enhanced dividend policy aimed at paying out 4% of the average NAV each financial year. Additionally, it announced a performance-conditional tender offer: if the trust fails to at least match its benchmark performance over the five-year period starting 31/07/2024, the board will propose a 25% tender offer, allowing shareholders to exit a portion of their investment at NAV, less costs.
Since the announcement, SJG’s discount has narrowed. We think these measures not only show conviction in the abilities of manager Masaki Taketsume, but also provide a clear incentive to continue delivering alpha, and at the same time, have broadened the trust’s appeal as an alternative income option. This, together with providing investors access to the exciting developments ongoing in Japan, leads us to think there is potential for its discount to narrow further.
Conclusion
Discounts in investment trusts present both opportunities and challenges. Whilst the allure of trusts trading at the absolute widest discounts may tempt investors, the historical data underscores the dangers of chasing these seemingly deep bargains. Discounts often reflect more than undervaluation; they can signal genuine structural or sector-specific challenges that hinder recovery.
Additionally, our analysis of 20 years of market data, examining rolling three-month returns from three major indices—the FTSE All-Share, MSCI Europe ex UK, and the S&P 500—alongside the discount movements of investment trusts revealed a striking pattern. During periods of sharp volatility—such as the 2008/09 financial crisis, Brexit, or the coronavirus pandemic—investment trust discounts widened significantly. However, unlike equity markets, which often rebounded within 12 months, average discounts across the sector frequently took years to recover. We think this lag, particularly pronounced in sectors like property, private equity, and infrastructure, reflects the slower adjustment of private asset valuations and heightened investor risk aversion during turbulent times.
Rolling returns versus discount movements
Source: Morningstar
Past performance is not a reliable indicator of future results
Whilst investing in a discounted trust may lead to strong returns over time, investors will have to get comfortable with the fact it may take more time to bounce back, despite strong performance from equity markets. Moreover, some trusts may face structural barriers that actually prevent their discounts from narrowing, potentially eroding returns over time. As such, focussing on quality trusts with moderate discounts, supported by positive tailwinds, may yield stronger results, in our view. By understanding the reasons behind a discount and the factors that might support its narrowing—such as portfolio quality, strong management, or exposure to structural growth trends—investors who look beyond the headline figures and incorporate discount analysis into broader investment decisions, rather than being solely guided by them, could unlock significant returns, often unavailable in open-ended funds.
A long-term perspective is essential. By examining the drivers behind a trust’s discount, identifying catalysts for potential narrowing, and ensuring alignment with personal investment goals, investors can better navigate the sales racks of the investment trust world. The rewards lie not in impulsive decisions but in uncovering opportunities that can stand the test of ti

How much can a £100,000 pension pot give you in retirement?© GB News
Story by Temie Laleye
A £100,000 pension pot can now secure a significantly higher retirement income through annuities compared to recent years.
With the Bank of England expected to cut interest rates further in 2025, now may be the best time to secure a quote and see how much you could get.
Three years ago, the same pension saver would have received just £5,131.
Annuity rates change regularly, and quotes are only guaranteed for a limited time, so they could be higher or lower in the future.
The exact income one could receive will depend on the value of their pension, their personal details and the options they choose.

Pension folder© GB News
Matt Sheach, financial consultant at Lumin Wealth, said: “With annuity rates offering good value for money over the past couple of years, savers may opt to lock into an annuity, with the anticipation that rates will fall over the coming months and years, in light of expected interest rate drops
A total of 82,061 annuities were sold in 2023/24, up 39 per cent compared to a year earlier, according to the Financial Conduct Authority (FCA).
Annuities could get a further boost due to the Budget announcement that pension pots will be liable for inheritance tax from April 2027.
Helen Morrissey, head of retirement analysis at Hargreaves Lansdown said: “This will remove many people’s rationale for using income drawdown as they used it to pass the pension down generations tax-efficiently rather than draw an income from it.
“As they revisit their retirement income plans, many may opt to secure a guaranteed income through an annuity instead.”
Older people can often access higher annuity rates
The Bank of England held interest rates at 4.75 per cent in December – following two falls in 2024.
One of the main restrictions of annuities is that people are stuck with the rate they get once they purchase the product.
Timing is important and it’s good to get a sense of whether rates are due to rise or fall whenever you’re considering an annuity purchase.
Lily Megson, the policy director at My Pension Expert, cautioned: “Inflation is proving sticky, and while the base rate is predicted to drop throughout 2025, the Bank of England will not rush these decisions.
“Savers, particularly those nearing retirement, will need to consider the coming year and factor in fluctuating interest rates as they pursue their financial goals.
“Some people may be considering taking advantage of higher interest rates in the short-term, while others might be contemplating longer-term options for growing their pension pots. Importantly, however, these are not decisions they should have to make alone.”
£££££££££££££££
This year’s fcast for the Snowball is £9,120.00 and the target 10k.
Remember if you re-invest your dividends at 7% pa your income doubles every ten years. Did I mention you also keep all your capital ?

Income earned
2023 £9,422.59
2024 £10,996.00
A yield of 11%, remember if u can compound your dividends at 7% pa, your income will double every ten years.