
History doesn’t always repeat but it often rhymes. So this week we will look at some lower risk Investment Trusts all AIC Dividend Heroes.

We can delete CLDN,FCIT and SMT as they dividends are of no interest for the Snowball.
Investment Trust Dividends
History doesn’t always repeat but it often rhymes. So this week we will look at some lower risk Investment Trusts all AIC Dividend Heroes.
We can delete CLDN,FCIT and SMT as they dividends are of no interest for the Snowball.

Brett Owens, Chief Investment Strategist
Updated: April 25, 2025
Let’s talk about consumer staples dividends today. If we’re heading for a slowdown then we need to be picky about our payouts. When the economy slows, discretionary spending is often punted but staples continue to be bought.
Today we’ll discuss five dividends between 4.2% and 10.7%. These “must have” products can provide our portfolios with important recession-resistant qualities.
Year-to-date staples have been flat and, in this market, that is great. Their sideways action has lapped the over-owned S&P 500 this year:
Consumer Staples: Doing Exactly What We Expect Them to Do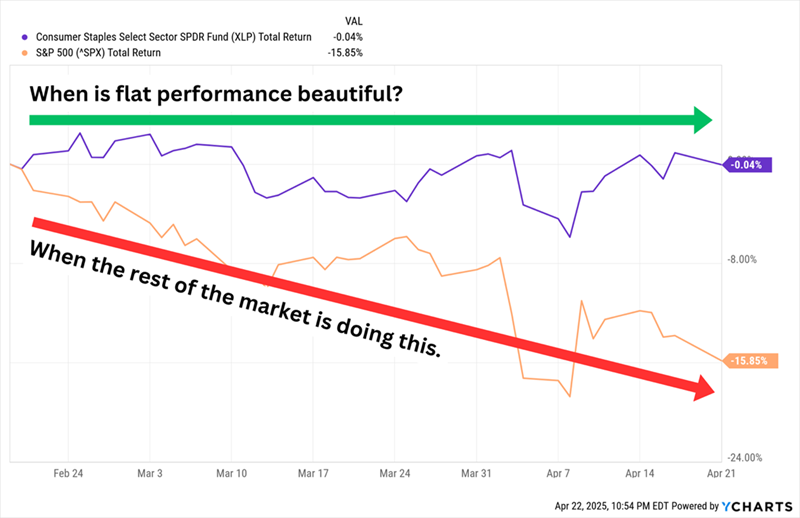
Consumer staples stocks tend to have more stable operations that result in more stable share performance in turbulent markets. And they also have predictable profits that allow them to pay out better-than-average dividends.
But there are exceptions. Perpetually too-popular staples like Costco (COST) and Walmart (WMT) deliver sub-1% yields. This also drags down the yields of staples-focused funds.
This is why we cherry pick our payouts, as always. Let’s get into these five which yield up to 10.7%.
Tobacco Stocks
Smokers are going to keep smoking, which is why these two tobacco companies have delivered double-digit gains (against the market’s 15% decline!) since Feb. 19:
Altria (MO, 6.9% yield) is best-known for its Philip Morris USA segment, which produces Marlboro cigarettes and is by far and away the company’s top revenue driver. But the company is putting increasing focus on its smokeless products, which include Copenhagen and Skoal smokeless tobacco, On! Oral nicotine pouches, NJOY e-vapor products and—through a joint venture with JT Group called Horizon Innovations—heated tobacco products.
Altria has been battling volume declines in cigarettes for years, and it has suffered a few self-inflicted wounds, such as its ill-fated stake in Juul Labs. However, higher prices on cigarettes, as well as growth in its smokeless products, have helped keep earnings and its high dividend on the rise, and both are expected to continue their (admittedly slow) growth in 2025.
As Long as Altria Can Charge More, Investors Will Buy More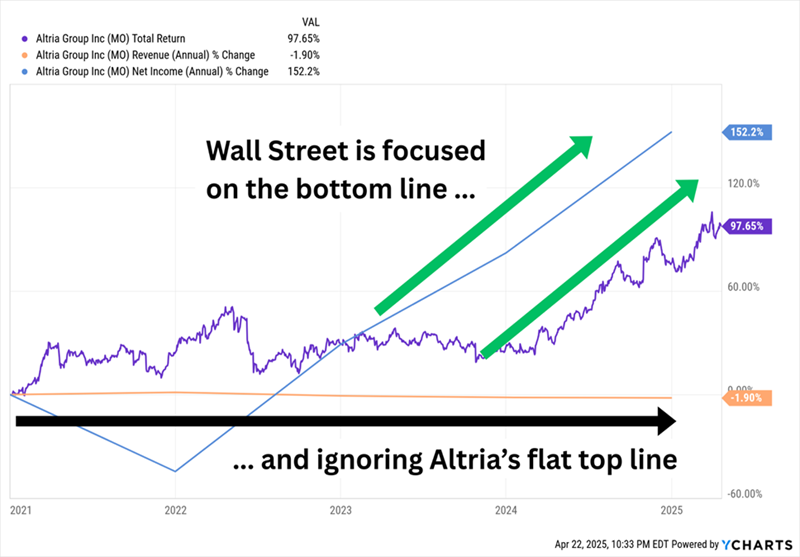
Ever since the market started sliding in February, investors have been snapping up MO shares to get some of that stability. But Altria is getting expensive—yes, a forward P/E of 11 doesn’t scream “overbought,” but it’s noticeably higher than the 8x-9x valuation it has typically carried over the past few years.
British American Tobacco (BTI, 7.5% yield) owns a number of well-known cigarette brands, including Camel, American Spirit and Newport. But it too deals in smokeless tobacco, including Grizzly dipping tobacco, Glo heated tobacco, VELO nicotine pouches, and Vuse vapes. In late 2023, BTI announced it would take a massive noncash writedown—which a few months later would become official, at $34.5 billion—on the value of its American cigarette brands. The stock bottomed in late 2024 and has been recovering ever since, including a roughly 10% gain since the February market top.
Despite the writedown, BTI’s top and bottom lines have been generally stable if not improving for years. But the company doesn’t expect sustainable growth until at least 2026, when management believes it will get more support from its smokeless portfolio. Fortunately, the company still keeps finding enough change under the couch to improve its dividend, which it has done in 26 of the past 27 years. A 7%-plus yield is stellar. A forward P/E of 9 not so much once we realize that’s at the high end of its multiyear range.
Groceries
Let’s move on to more traditional consumer staples businesses—but not traditional consumer staples names. The sector’s blue chips tend to be overcrowded, which is a recipe for limited yields. Instead, I prefer stocks that live outside of the spotlight but offer good to great levels of income.
SpartanNash (SPTN, 4.2% yield) is a company that we’ve previously discussed as a “grocer-plus.” It operates nearly 200 grocery stores in 10 states across numerous brands, including Family Fresh Market, Metcalfe’s Market and Supermercado Nuestra Familia. But its other, larger segment is a wholesale distribution business that services roughly 2,300 independent grocers across the U.S. The company is several years into a turnaround plan that has helped to rejuvenate the top and bottom lines, but the stock’s performance hasn’t matched.
As we said back in 2020, “a look at the past 10 years is probably a decent indication of what the next 10 will broadly look like.”
A Strong 2025 Aside, That Has Unfortunately Been the Case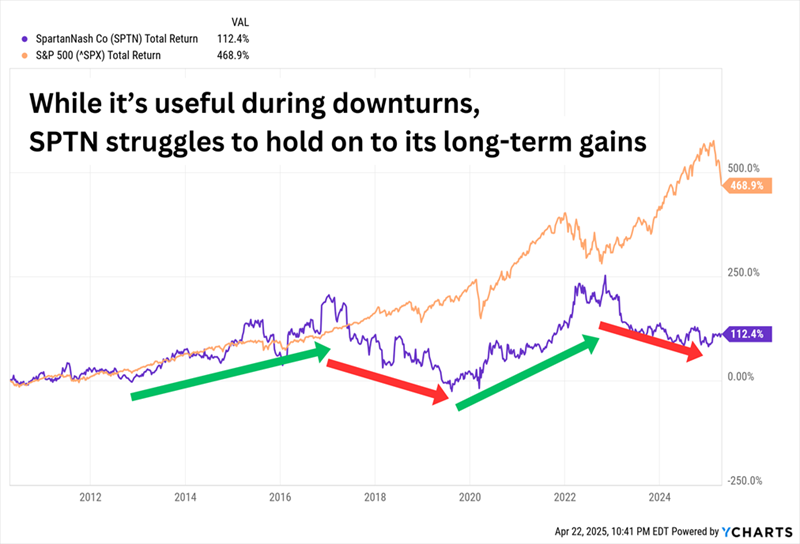
SPTN boasts a decent 4%-plus yield that dwarfs most other grocers, it has raised its distribution for 15 consecutive years, and it pays out just less than half its earnings, so the dividend should have more upside. It’s hard to say the same about the stock price. Management did recently express interest in expanding its Hispanic grocery and convenience store presence, but its plans are in their infancy.
BGS Foods (BGS, 10.7% yield) is the name behind brands such as Crisco, Cream of Wheat, Ortega and Bear Creek. Its double-digit yield is largely the product of a slumping stock, with shares off by more than 70% over the past few years amid slumping top and bottom lines.
Its 10% return since the market top is something of a small miracle considering its continued operational woes. In late February, B&G reported it was booking charges of $320 million related to “intangible trademark assets” on its Green Giant, Victoria, Static Guard and McCann’s brands. BGS also kept its dividend at 19 cents per share, but it’s an open question as to how long B&G can keep it up. The dividend annualizes to 78 cents per share. The pros expect adjusted profits of 68 cents this year and 73 cents in 2026. Something has to give.
FEMSA (FMX, 7.0% yield)—the merciful shorthand for Fomento Económico Mexicano, S.A.B. de C.V.—isn’t a familiar name, but it’s awfully interesting. FEMSA operates a huge chain of small-box retail stores, called Oxxo, in Mexico, Colombia, Peru, Chile and Brazil. It uses the same brand for auto service stations in Mexico. It also operates drugstores under several names in Mexico, Chile, Colombia and Ecuador. And it owns nearly half of Coca-Cola FEMSA (KOF), the world’s largest bottler of Coca-Cola (KO) by volume.
FEMSA isn’t automatically a great defensive play, then, if our worry is the U.S. economy. We have to keep our eyes on Mexico to determine FMX’s real utility. But there’s a lot to like here. It has a dominant position in Latin America. Top- and bottom-line growth hasn’t been pristine, but it’s better than many other staples names. Estimates are for 26% profit growth this year, then another 12% in 2026. The dividend itself is generous—FEMSA has become increasingly aggressive about returning capital, and it plans on paying four quarterly ordinary dividends as well as four “extraordinary” dividends, coming out to a yield of about 7%.
A Step Change in FEMSA’s Dividend Policy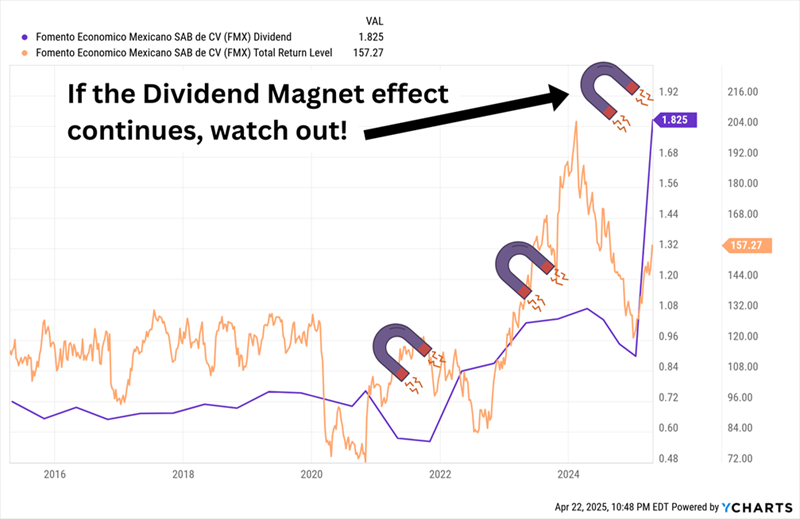
But while FMX has been plenty fruitful, it has also been more volatile than the average staples stock, and it’s also richly priced at 20 times earnings estimates.
One of FEMSA’s best qualities—its dividend growth—is the lynchpin of my dividend strategy this year.

If you want to add some diversification to your portfolio but the share you want to buy does not yield 7%, you could pair trade it with a higher yielder for example only NESF, splitting your investment between the two shares.


Hairbrained scheme
Trust Intelligence from Kepler Partners
Ryan Lightfoot-Aminoff
This is not substantive investment research or a research recommendation, as it does not constitute substantive research or analysis. This material should be considered as general market commentary.
Following a vote in 1994, the UK public chose the widget inside a can of Guinness as Invention of the Year. In second place, was the internet. Whilst both inventions have had an impact in their own way – Guinness has recently claimed the number one spot as the country’s most popular beer – it’s probably safe to say the internet has generated more change to society in the 20-plus years since the vote, despite being usurped by a widget at the time. This rather circuitously brings us onto the topic of this week’s article, income portfolios. Historically, income funds have been populated with a mixture of government and corporate bonds, equity income and occasionally some real assets such as property or infrastructure.
Allocations between these asset classes often vary, depending on underlying macro conditions, as can the allocations within each asset class to different subsectors and industries, although they have primarily stayed within a small traditional subset. However, over the past few years, one interesting theme in the investment trust space has been the growing prevalence of enhanced dividend models. Typically, this involves using a contribution from the capital returns of a portfolio to pay out a fixed amount of income. Furthermore, trusts have the ability to hold back revenue in the good times to support the dividend in more challenging periods, enabling a smoother, more predictable income and growth trajectory. As such, the choices available to investors in the equity element of an income portfolio are higher than ever before, offering a much wider pool of potential asset classes to choose from whilst still generating an attractive income. To explore some of the more intriguing choices, we have put our own inventor hats on to devise a prospective income portfolio of more esoteric trusts, covering a range of asset classes and geographies that a more traditional approach may overlook to arrive at what we call our Madcap Income portfolio.
We start off our search close to home. The UK is quite popular for equity income investors due to a relatively higher proportion of more traditional dividend-paying sectors, such as banks and oil majors. However, these are usually large-cap companies, meaning smaller companies are often overlooked in the quest for income. Small-cap companies are not usually a major feature of income-orientated portfolios altogether, as they traditionally use any additional capital to fund future growth, rather than pay out to shareholders as dividends. This also means income portfolios are usually more value biased.
Therefore, by adding in growthier areas, such as small-caps, it not only brings a whole new area of the market into play, but can help an income portfolio with style diversification. Fortunately, there are a number of UK smaller companies trusts with enhanced dividend policies that can offer both growth potential and a good income for investors. One of these is JPMorgan UK Small Cap Growth & Income (JUGI). Managed by Georgina Brittain and Katen Patel, the trust recently adopted a new dividend policy. In early 2024, the board announced a dividend equivalent to 4% of the end of financial year NAV, to be paid out in quarterly instalments across the following year. With a current discount of c. 12%, this means the portfolio of small- and mid-cap stocks offers a historic yield of c. 5.4%, as at 14/04/2025 , meaning both an attractive income and growth potential. An honourable mention goes to the newly named Artemis UK Future Leaders (AFL). Formerly known as Invesco Perpetual UK Smaller Companies, the trust is under new management, although the enhanced dividend policy remains in place which currently offers a dividend yield of 5.1%.
Moving across the Channel, European smaller companies could offer further diversification benefits. Europe is less renowned than the UK for its income offering. However, the smaller companies sector offers huge geographic diversity, ranging from the Nordics to the Iberian Peninsula. One trust capturing this is European Assets (EAT). M Mine Tezgul takes a broadly diversified approach, enabling her to capture the wider range of opportunities in the market, from energy transition, to digitisation and deglobalisation, also with a recent focus on European defence names. The trust pays an enhanced dividend of 6%, based on the closing NAV of the financial year, which is paid out quarterly in the following financial year. EAT is also trading at a discount at present, meaning the potential entry yield investors could get is higher. The dividend policy means Mine is free to invest in the best opportunities she can identify from across the continent, without being bound by any income demand, and therefore the trust is a worthy addition to our Madcap Income portfolio .
Our final smaller companies constituent is abrdn Asia Focus (AAS). Managed by a three-strong team of Flavia Cheong, Gabriel Sacks, and Xin-Yao Ng, AAS owns a relatively concentrated portfolio of smaller companies but diversified from across the many countries in the Asian region, including the likes of Thailand, Indonesia and Taiwan. Strictly speaking, the trust doesn’t belong in this portfolio as there is no enhanced dividend, but we do think it is a good example of how the investment trust sector can offer a decent dividend from a low-yielding growth sector. The board changed the dividend policy in 2021 to pay a moderate and growing dividend. Since the new policy, all dividends have been covered by revenues, though there is close to 1.5× the previous annual dividend in revenue reserves to be called on if required. The trust has also got an impressive track record of paying special dividends, having done so in nine of the past ten financial years. This natural income approach means the historic yield of c. 2.7%, including specials, is slightly lower than other trusts we have considered, although the progressive approach and attractiveness of the asset class means we believe it warrants a place in our portfolio.
Sticking with Asia, we have also included JPMorgan China Growth & Income (JCGI). We believe this adds further differentiation, as China is quite a low weight in the Asia smaller companies index (c. 13.3% as at 31/03/2025), but is still a powerful economy, both regionally and internationally. JCGI’s managers, Rebecca Jiang and Li Tan are growth-orientated, meaning the portfolio has a notable overweight to technology, whilst also being underweight financials, both differentiated allocations to a traditional income-seeking portfolio. Their dividend approach is similar to JUGI, paying 4% of the NAV on the last business day of the preceding financial year. The current discount, and the volatility present in markets at time of writing, means this offers a historic yield of c. 5%.
Our final Asian consideration is Japan. Higher dividends have been an area of focus as part of the country’s corporate governance reform push. A number of trusts have been looking to capitalise on this, including CC Japan Income & Growth (CCJI), which has increased its dividend every year since inception in 2015 and makes for a worthy candidate for inclusion in an alternative income portfolio . We would also highlight Schroder Japan (SJG) due to its recentadoption of an enhanced dividend, which will see it pay out 4% of NAV, from a combination of the underlying income, which is approximately half of this level, and capital. This slightly higher yield just gave it the edge in our Madcap Income portfolio.
One geography we haven’t yet explored is North America. The region is rarely a consideration when compiling income portfolios due to the low dividend culture, which instead prioritises share buybacks. The strong tech company bias, which often use spare cash to innovate is also a contributing factor. However, a new strategy at BlackRock American Income (BRAI) may offer investors something here. As part of a series of reforms announced in March 2025, thetrust has proposed a dividend of 1.5% of NAV per quarter, equivalent to 6% a year, far in excess of the index. Furthermore, the trust has also adopted a value-orientated approach, which could help mitigate some of the growth focus elsewhere in the portfolio.
Our final two choices are even more outlandish. We have identified two trusts that have truly capitalised on the investment trust structure to create an income stream from asset classes associated with them. Firstly, there is International Biotechnology (IBT). being invested in the growth-focussed biotech sector, and having a bias towards small- and mid-caps, the trust currently yields in excess of 5%, thanks to an enhanced dividend and current wide discount. Adding this asset class to the portfolio brings with it considerable capital upside potential.
Finally, is CT Private Equity (CTPE), one of number of private equity trusts we could have selected. CTPE has a fairly mainstream approach, blending third-party fund commitments with co-investments, though the focus on lower mid-market companies means considerable potential for upside. The trust also has a formulaic dividend policy, which ensures dividends will be the equivalent of 4% of NAV per annum, recalculated on a quarterly basis. However, if in any quarter this figure implies a reduction in the dividend, the quarterly dividend payable will be maintained. This has enabled dividends to compound at c. 10% per annum over the past ten years, offering a good yield and the potential for future growth.
Combining all of these together into an equally weighted portfolio, we can see how this group of trusts compares to a global index and what insights this could offer. Firstly, looking at the yield, we can see the overall portfolio offers a yield of c. 4.97%, vastly above that of the MSCI World Index of 1.93% and still considerably more than the MSCI World High Dividend Yield Index at 3.47%, though we should caution some of these figures may vary as a result of the tariff-induced volatility as at time of writing.
| trust | style | yield (%) | discount (%) |
| CT Private Equity | N/A | 6.29 | -34.92 |
| European Assets | Mid-cap growth | 7.23 | -11.53 |
| International Biotechnology | Small-cap growth | 5.63 | -17.41 |
| JPMorgan China Growth & Income | Large-cap core | 5.18 | -14.67 |
| JPMorgan UK Small Cap Growth & Income | Small-cap core | 3.76 | -12.13 |
| Schroder Japan | Large-cap core | 4.97 | -11.16 |
| abrdn Asia Focus | Small-cap growth | 2.42 | -13.82 |
| BlackRock American Income | Large-cap value | 4.26 | -10.74 |
| Average | 4.97 | -15.80 |
Source: Morningstar & AIC (dividend yields) both as at 10/04/2025. NB. Yield calculation methodologies may vary
One major factor behind our Madcap Income portfolio’s higher yield is likely to be the US allocation, which is, as discussed, not a traditional income market. This is where our portfolio has significant differences to both global indices, even the dividend-focussed one. Despite the recent turmoil, the US remains an economic powerhouse, and is host to the world’s leading companies. However, few of the companies here offer attractive income returns. As such, we have looked to offer equal exposure to a range of different geographies, meaning a broad geographic spread for a potential income portfolio. When compared to a global index, it has come up very US-light, although with the slight caveat that CTPE does have some underlying US exposure but has not been included in these allocations as it is not produced by Morningstar due to the private nature of the portfolio. Moreover, these allocations only account for company listing, and will therefore not account for revenue generation, which is arguably a better determinant of economic exposure. Regardless, the North American weight for the portfolio of c. 16% is significantly lower than the High Dividend Index at 58.1%, and even more so versus the wider global index at 76.5%, as we have shown in the chart below, and this will have a significant impact on the relative return profile.
Source: Morningstar
One of the key reasons behind the US’s low income output is the high proportion of tech companies. Traditionally, the tech industry has used excess capital to fund R&D and capture future growth. As a result, tech companies are usually a very low weight in income indices, as can been seen in the chart below, with a low allocation for technology in the dividend index. However, our portfolio is actually slightly overweight the industry versus this index, albeit still below the global index, which helps mitigate some of this risk, and is likely a reflection of the growth biases these trusts have due to the enhanced dividend approach. Of course, investors could easily overweight this sector in an income portfolio simply by not equal weighting each constituent, as we have.
Source: Morningstar
This leads us onto our final comparison, style balance. Equity income portfolios are typically more value biased, as a result of the industry allocations already mentioned, but also due to the fact that companies often offer higher yield as a function of their lower valuations. This can be seen in the strong bias to value stocks in the high dividend index, with over half allocated to the style, and only c. 6% in growth stocks. However, this is where our Madcap Income portfolio stands out, with allocations to growth above that of even the MSCI World Index at 36.4% versus 25.7%. This is arguably the key beneficiary of incorporating enhanced income strategies into an income portfolio. Many of the strategies we have highlighted have a strong growth focus whilst still offering high yields and therefore, by incorporating them into a portfolio, it offers critical diversification benefits compared to what income investors may otherwise achieve.
Source: Morningstar
Investment trusts offer an incredible variety of options to equity income investors. In recent years, the growth in enhanced dividend policies has greatly increased the opportunity set, although there are also plenty of trusts offering a natural income from sectors where income investors rarely rake exposure. To illustrate this, we have constructed a broad income portfolio offering a higher income than the wider market. Of course, we don’t think investors are likely to be best served by equal weighting these trusts, but the exercise does show the flexibility and potential at hand. And needless to say, there are a number of other options we didn’t select. One of the key lessons of the exercise is that investors can still capture growth exposure, with a substantial allocation to the structural tailwinds of technology, whilst generating an attractive portfolio income. Interestingly, our Madcap Income portfolio has also produced a considerable underweight to the US. Considering the current market backdrop in the wake of the tariff-induced market volatility, this could be an intriguing direction for those concerned over the changing outlook for the country and its dominance of global equity indices.


The current fcast for the Snowball is £9,120.00 with a target of 10k.
The plan is to double the 10k within ten years to an income on seed capital of 20% by re-investing at a yield of 7%, held within a tax free wrapper.
Better if you can add fuel to the plan by adding capital.
The control share VWRP is valued at £122,709.00 The current comparison using the 4% rule is income of £4,908. If we use a figure of 5k, the VWRP total would need to grow to £490,836.00. GL with that.

There are only three.
One. Buy Investment Trusts that pay a ‘secure’ dividend to buy more Investment Trusts that pay a ‘secure’ dividend.
Two. Any Investment Trust that drastically changes their dividend policy must be sold even at a loss.
Three. Remember the rules.

Very few pockets of the investment universe have escaped the tariff turmoil, but could the real estate sector prove a safe haven while volatility and uncertainty prevail?
With global markets sent into a tailspin following “Liberation Day” in early April – when the US president imposed penal, “reciprocal” tariffs on every nation in the world, before performing several U-turns – investors seeking a place to hide during the uncertainty may do well to look at listed property.
Since 2 April, the date of President Trump’s infamous unveiling of the tariffs at the White House Rose Garden, the average share price of UK listed real estate companies has risen 1.7% compared to a 2.5% drop in the MSCI UK Index, as shown in Figure 1.

Source: Morningstar, Bloomberg, Marten & Co
This is an indication that financial markets view real estate as a relative safe haven compared to most other sectors. Buy why has real estate been a bright spot during this time of market stress and can it last going forward?
We should remind ourselves that real estate has suffered a prolonged period of pain since interest rates spiked in 2022 and values plummeted. Values have already suffered a 20%-30% decline since 2022 with yields around 150-200 basis points higher. This may have helped cushion the blow in the current risk-off environment, with the sector coming from a low base and at the beginning of a period of recovery.
As central banks wrestle with their rate setting agendas in the face of inflationary pressure and heightened recession risk, markets are expecting several cuts from the Bank of England and the European Central Bank this year. Lower rates tend to be positive for the real estate sector, given the sensitivity of the sector to market rates.
Lower interest rates may not translate into lower property yields, however. Whilst companies tend to continue paying rent and lease costs during downturns, slower growth would have the effect of dampening occupier demand and put the brakes on rental income growth, which may cancel out the positive effects of lower market rates.
In terms of US tariffs, real estate has limited direct exposure. Most property companies operate domestically and have just a limited amount of rental income deriving from US companies. Although direct impacts from tariffs are limited, indirect effects such as lower exports, higher uncertainty, lower investment and weakening labour markets could slow or stall the real estate sector’s recovery.
Oxford Economics has revised down its outlook for European commercial property, trimming its all-property capital growth forecast from 2.0% to 1.5% per annum over 2025 and 2026, stating it expects slower demand to hit rental growth and persistent uncertainty to lead to a flatter yield profile.
The industrial sector is most directly impacted by tariffs, with European manufacturing and exports set to take a hit. It is anticipated that demand will slow in the near-term as businesses delay decision making.
Longer-term though, it could be the case that fragmented global trade would require more warehouse space. This was the case following Brexit, where supply chains had to be reconfigured separately for the UK and continental Europe, which led to higher inventory requirements.
Supply chain resilience was already a trend benefiting European logistics, with several shocks including Covid and the Suez-canal incidence in recent years, and this has yet to play out. The UK and EU defence spending commitments could also act as an offset to any demand-side weakness caused by tariffs. In the UK defence spending projections have been upped to £13.4bn and 2.5% of GDP by 2027.
UK commercial real estate’s defensive characteristics and income-generating traits make it an ideal safe haven for investors. Add to this that a recovery is in full swing – with MSCI data for 2024 showing that capital values rebounded to their highest levels since 2022 and income growth topping 5% since early 2023 – and now could be the real estate sector’s time to shine.


Ugly – but the current share price is even uglier. But I need some more mist to lift before attacking.
The forward looking statements were uniformly grim, but the comment on realising a “substantial” part of the current NAV (some 53p or so) in 2025 may suggest all is far from lost here.
Any of us who do OK out of this will require access to decent PTSD care. Dear oh dear.
© 2026 Passive Income Live
Theme by Anders Noren — Up ↑

