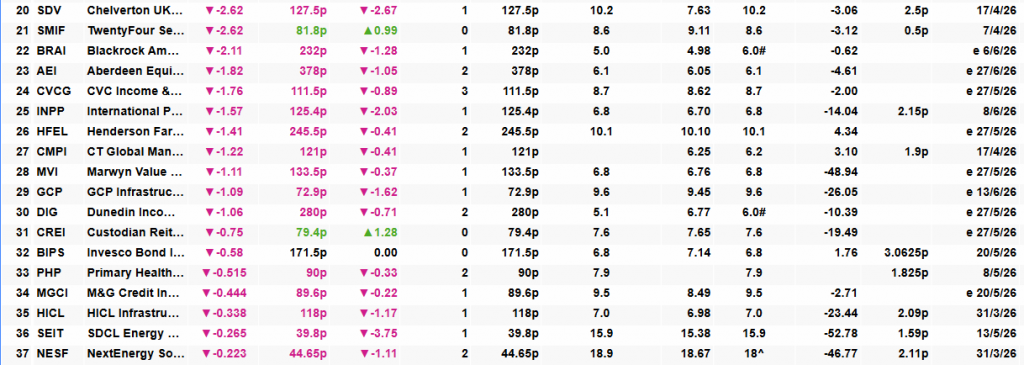
Henderson Far East to replace Just Group on FTSE 250 effective Apr 1
City of London Investment Trust (CTY)17 March 2026
Disclaimer
Disclosure – Non-Independent Marketing Communication
This is a non-independent marketing communication commissioned by City of London Investment Trust (CTY). The report has not been prepared in accordance with legal requirements designed to promote the independence of investment research and is not subject to any prohibition on the dealing ahead of the dissemination of investment research.
Overview Overview Analyst’s
CTY’s 60th year of dividend increases, a first for the trust sector.
Overview
City of London Investment Trust (CTY) is approaching a landmark this year: the potential delivery of its 60th consecutive year of Dividend growth, a record unmatched in the investment trust sector. This consistency has been a hallmark of the strategy under Job Curtis, who has managed the trust since 1991, alongside deputy manager David Smith, appointed in 2021.
The trust’s durability stems from a conservative, balanced approach to portfolio construction, combining higher-yielding stocks with companies capable of stronger long-term capital and dividend growth. Ensuring a diversified income pool has helped smooth earnings over time, whilst the investment trust structure provides an extra buffer through revenue reserves, tapped during lean periods such as the COVID-induced disruptions in 2020.
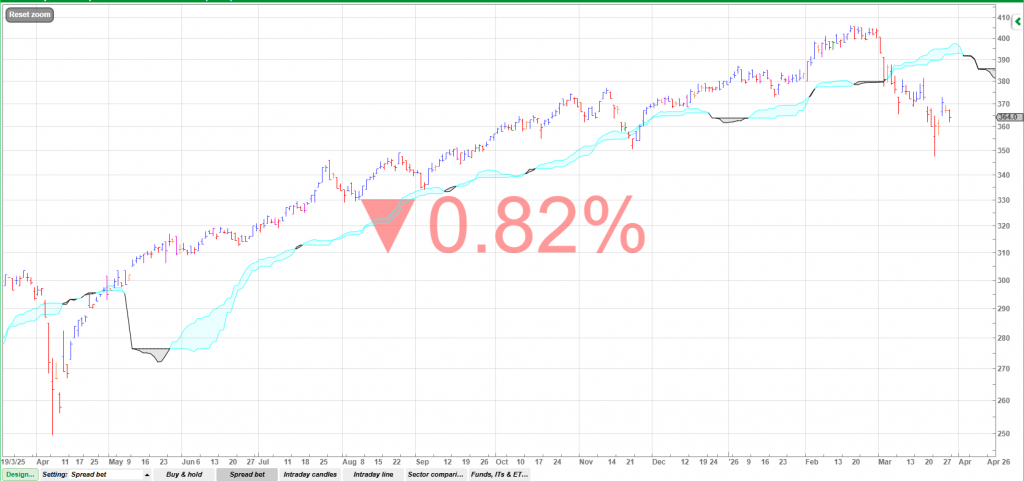
This disciplined approach has supported long-term returns and recent Performance, despite market volatility. Over the 12 months to 12/03/2026, CTY delivered NAV and share price total returns of 25.9% and 28.3%, respectively, outpacing the FTSE All-Share Index. Returns were bolstered by several high-conviction holdings, including NatWest Group and Phoenix Group Holdings, alongside strategic underweights elsewhere.
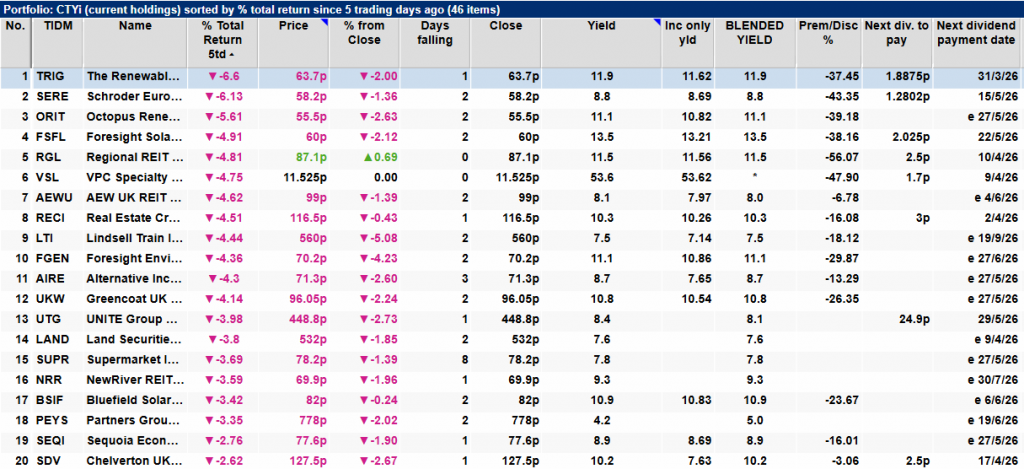
The managers have also increased the Portfolio’s exposure to selected UK REITs, where signs of stabilising demand and improving rental growth are emerging, including via a new position in Big Yellow Group. The property sector has faced headwinds from higher interest rates, but CTY has leveraged market weakness to acquire high-quality assets trading at substantial discounts to underlying values.
Having traded at a Discount in early April 2025, CTY sharply returned to more familiar premium territory and currently trades at a small premium of around 0.6%, in line with its five-year average.
Analyst’s View
Few UK equity income strategies can match the long-term consistency of CTY, in our view. Under Job’s stewardship, the trust has quietly compounded income and capital for more than three decades, comfortably ahead of the broader UK market. This year’s potential 60th consecutive dividend increase would further cement CTY’s status as the pre-eminent AIC Dividend Hero, a testament to the resilience of its underlying portfolio, prudent use of revenue reserves, and the managers’ long-term disciplined approach.
We also like the trust’s commitment to a traditional dividend model. Payments are expected to come from revenue, rather than realised capital gains, a discipline that matters in weaker markets, where investors may be seldom keen to receive income funded by their own capital. This focus on earnings-driven dividends should, therefore, provide a more dependable foundation for long-term income growth. The current yield, modestly above the FTSE All-Share Index, is attractive but remains sensitive to interest-rate shifts; a rise in rates could again temper demand for higher-yield investment trusts, as investors return to favouring lower-risk cash and gilt options, as we saw in 2022 and 2023.
Looking more broadly, however, we think the UK market remains compelling. Despite strong recent returns, it is still under-owned globally, and valuations are reasonable relative to many international peers. Persistent inbound M&A activity suggests overseas buyers recognise the value of UK assets, reinforcing the opportunity set. In this context, CTY offers a pragmatic route to access the UK market’s potential through a diversified portfolio of established, cash-generative businesses, at the lowest ongoing Charge in the AIC UK Equity Income sector.
Bull
- Lowest OCF in the AIC UK Equity Income sector
- Consistency and experience of manager who has delivered long-term outperformance of the FTSE All-Share Index in capital and income terms
- A near six-decade-long track record of growing the dividend
Bear
- Cautious approach means that NAV can underperform in some market conditions
- Income track record highly attractive, so manager might risk long-term capital growth in trying to maintain it
- Structural gearing can exacerbate the downside

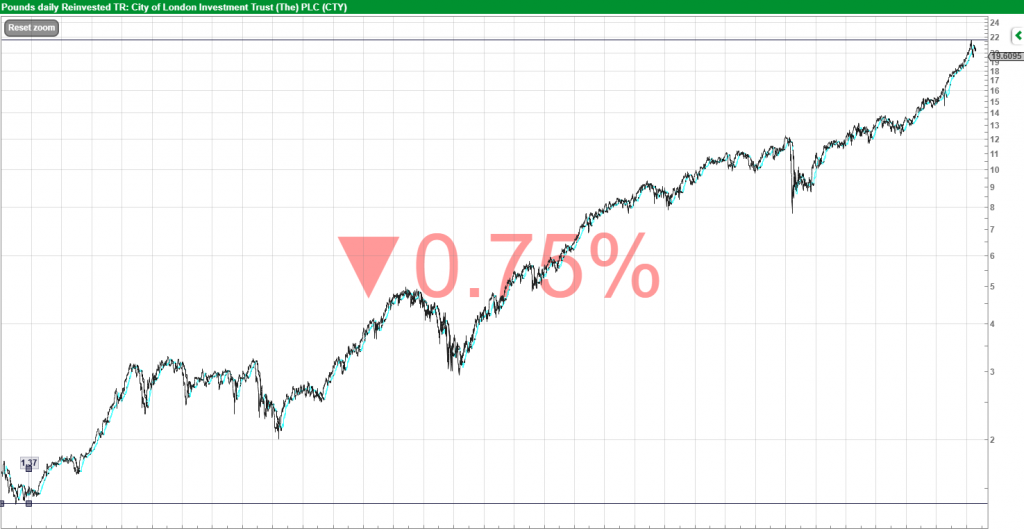
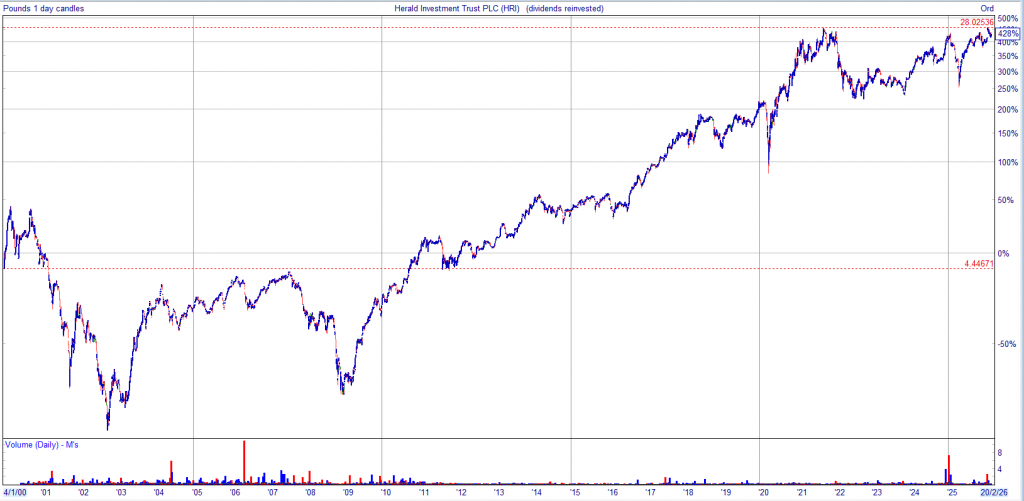
Dividends re-invested £1.52 > £19.77