Why I Put 75% Of My Retirement In Infrastructure Assets
Mar 26, 2026
Jussi Askola, CFA Investing Group Leader
Summary
- Most investors allocate most of their assets to equities and fixed income.
- I think that infrastructure investments offer better risk-to-reward.
- I discuss my unique retirement strategy and why it makes sense for me.
- High Yield Landlord members get exclusive access to our real-world portfolio. See all our investments here »

My active income is very risky.
I run a small investment research business, which I know will eventually get disrupted by AI, as it breaks barriers to entry and will ultimately lead to much greater competition.
Already now, the majority of content online is AI-generated, and it likely won’t be long before this content is as good as human-generated and all over the place.
If, before AI, there were 5 articles posted each day on REITs, in the future, there will be 50 or 500, making it very hard for independent analysts to really stand out.
Knowing this, I am very conservative with how I invest my retirement funds, preparing already now for an eventual downfall of my small business.
This means that I generally stay away from risky equities like tech stocks, SaaS businesses, biotech, startups, crypto-related equities, and anything else that I think could get disrupted by AI over time. Unfortunately, as I have explained in a separate article, I fear that most businesses and their stocks will eventually suffer from this.
At the same time, since my investment horizon is multi-decade-long and I worry about inflation, I don’t invest much in fixed income either.
Even with a 4-5% yield from long-term Treasuries (IEF), there is not much left, if anything, after inflation and taxes, especially if we face a few more black swan-like events like the pandemic, requiring more money-printing down the line. The AI revolution could be that event if it leads to a difficult transition period with significant labor market disruption, as I expect.
Gold (GLD) and silver (SLV), while performing well lately, are not the solution for me either, as I will need to generate passive income to replace my active income in retirement. Precious metals have gone through very long periods of negative returns in the past, making them too unpredictable for a large allocation in retirement for me.
So where do I invest the bulk of my retirement funds then?
The answer is in infrastructure investments. I invest about 75% of my portfolio in them.
Things that our society absolutely needs, whether the economy is booming or in a recession, and AI can replace or replicate them. Yet, they generate significant income that’s consistently growing at, or ideally above, the rate of inflation.
Think here about things like:
Cell towers:

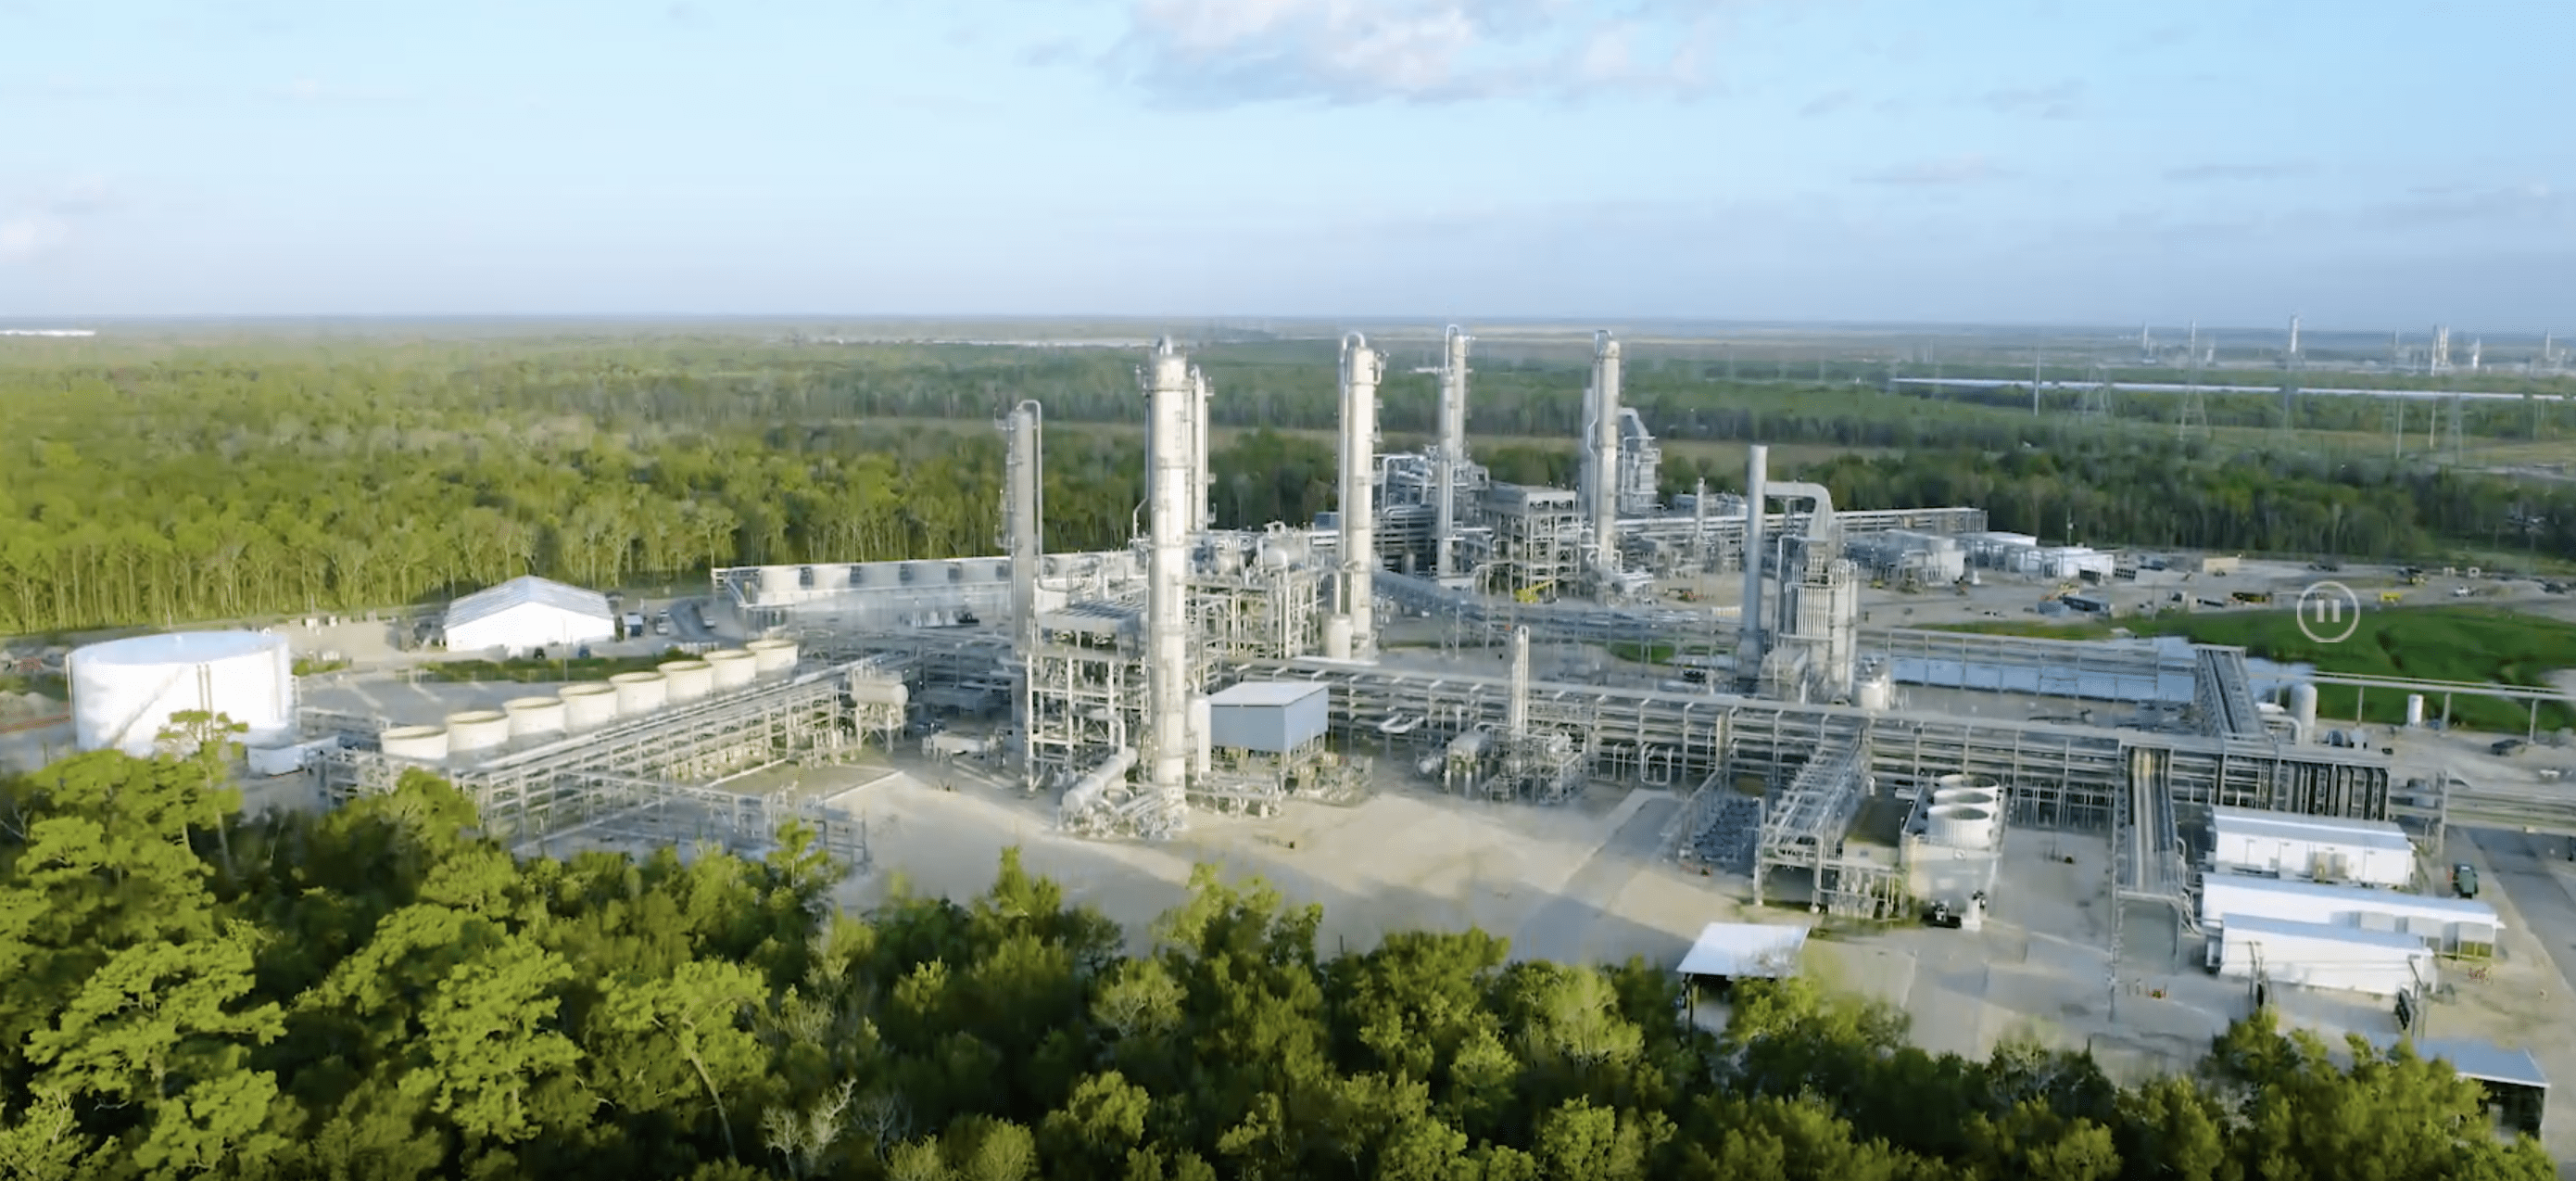
Energy pipelines:
Timberland:

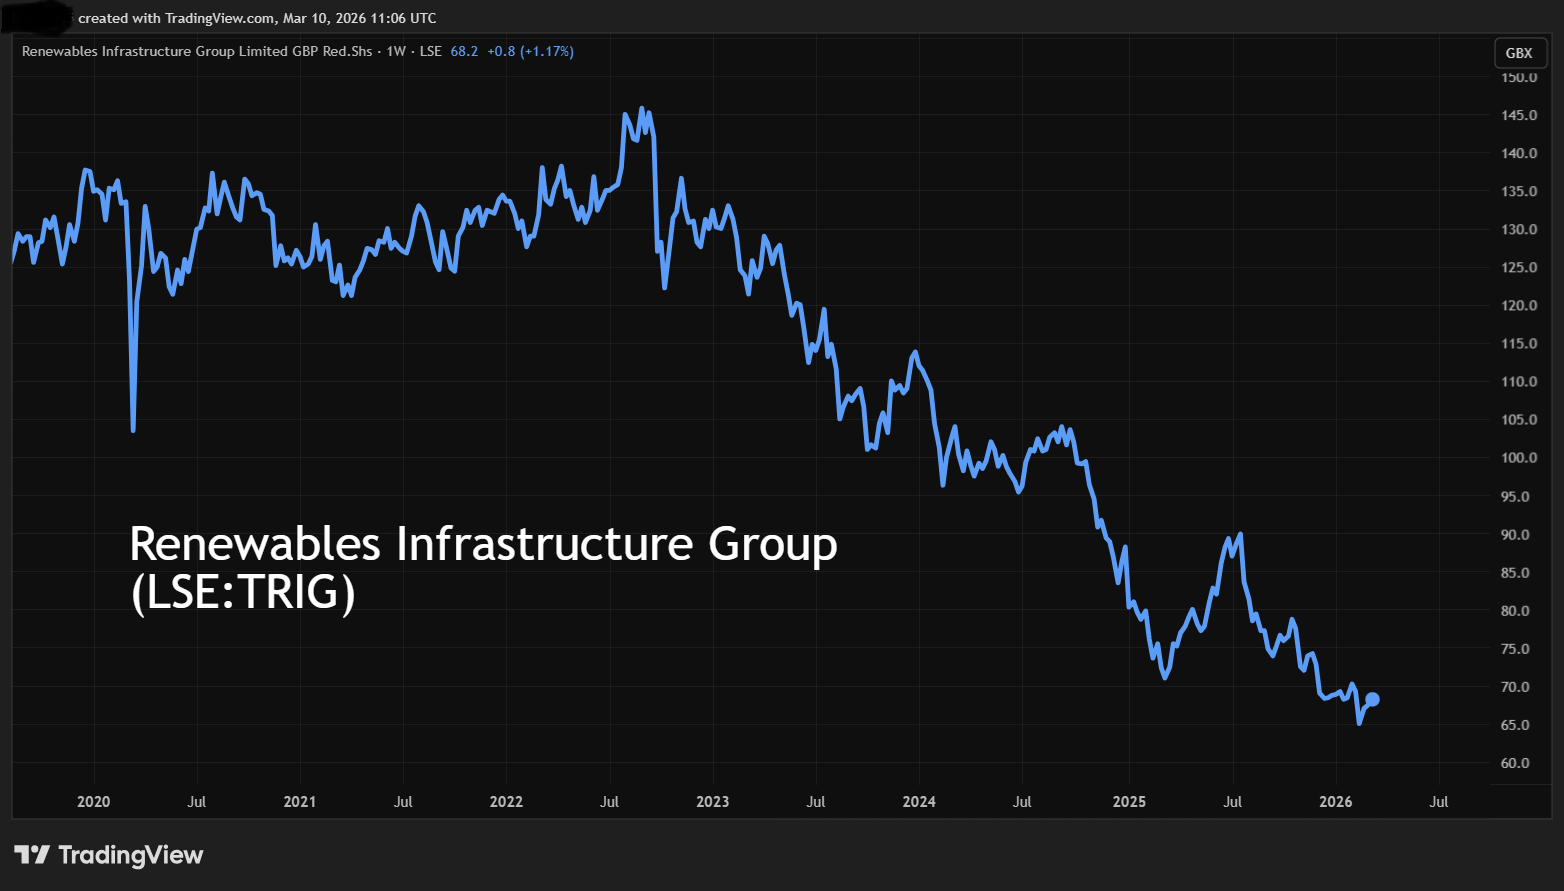
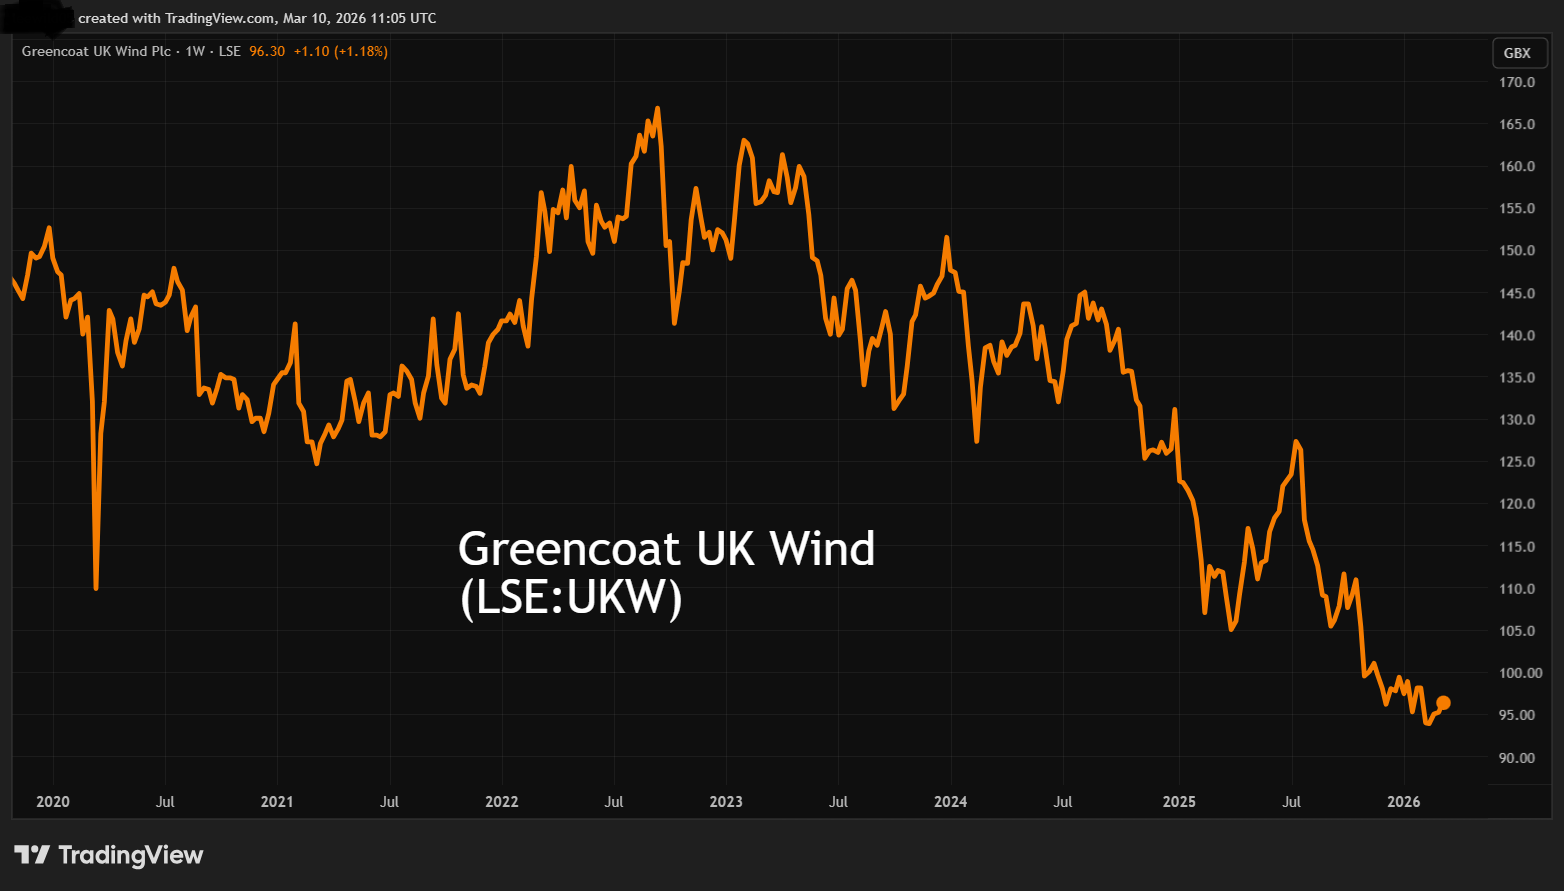
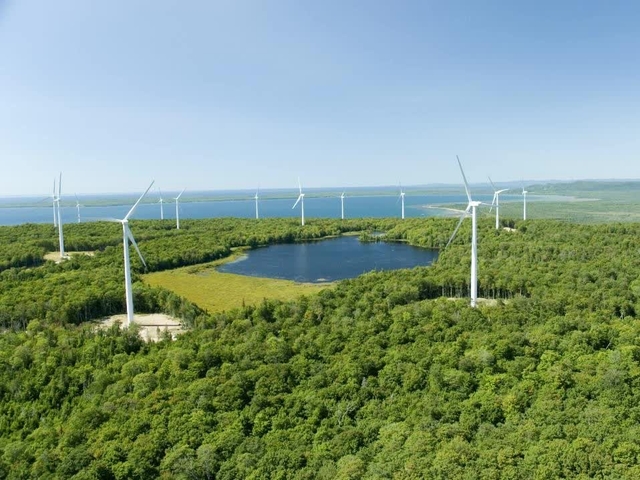
Windmills:
Industrial parks:

Farmland:

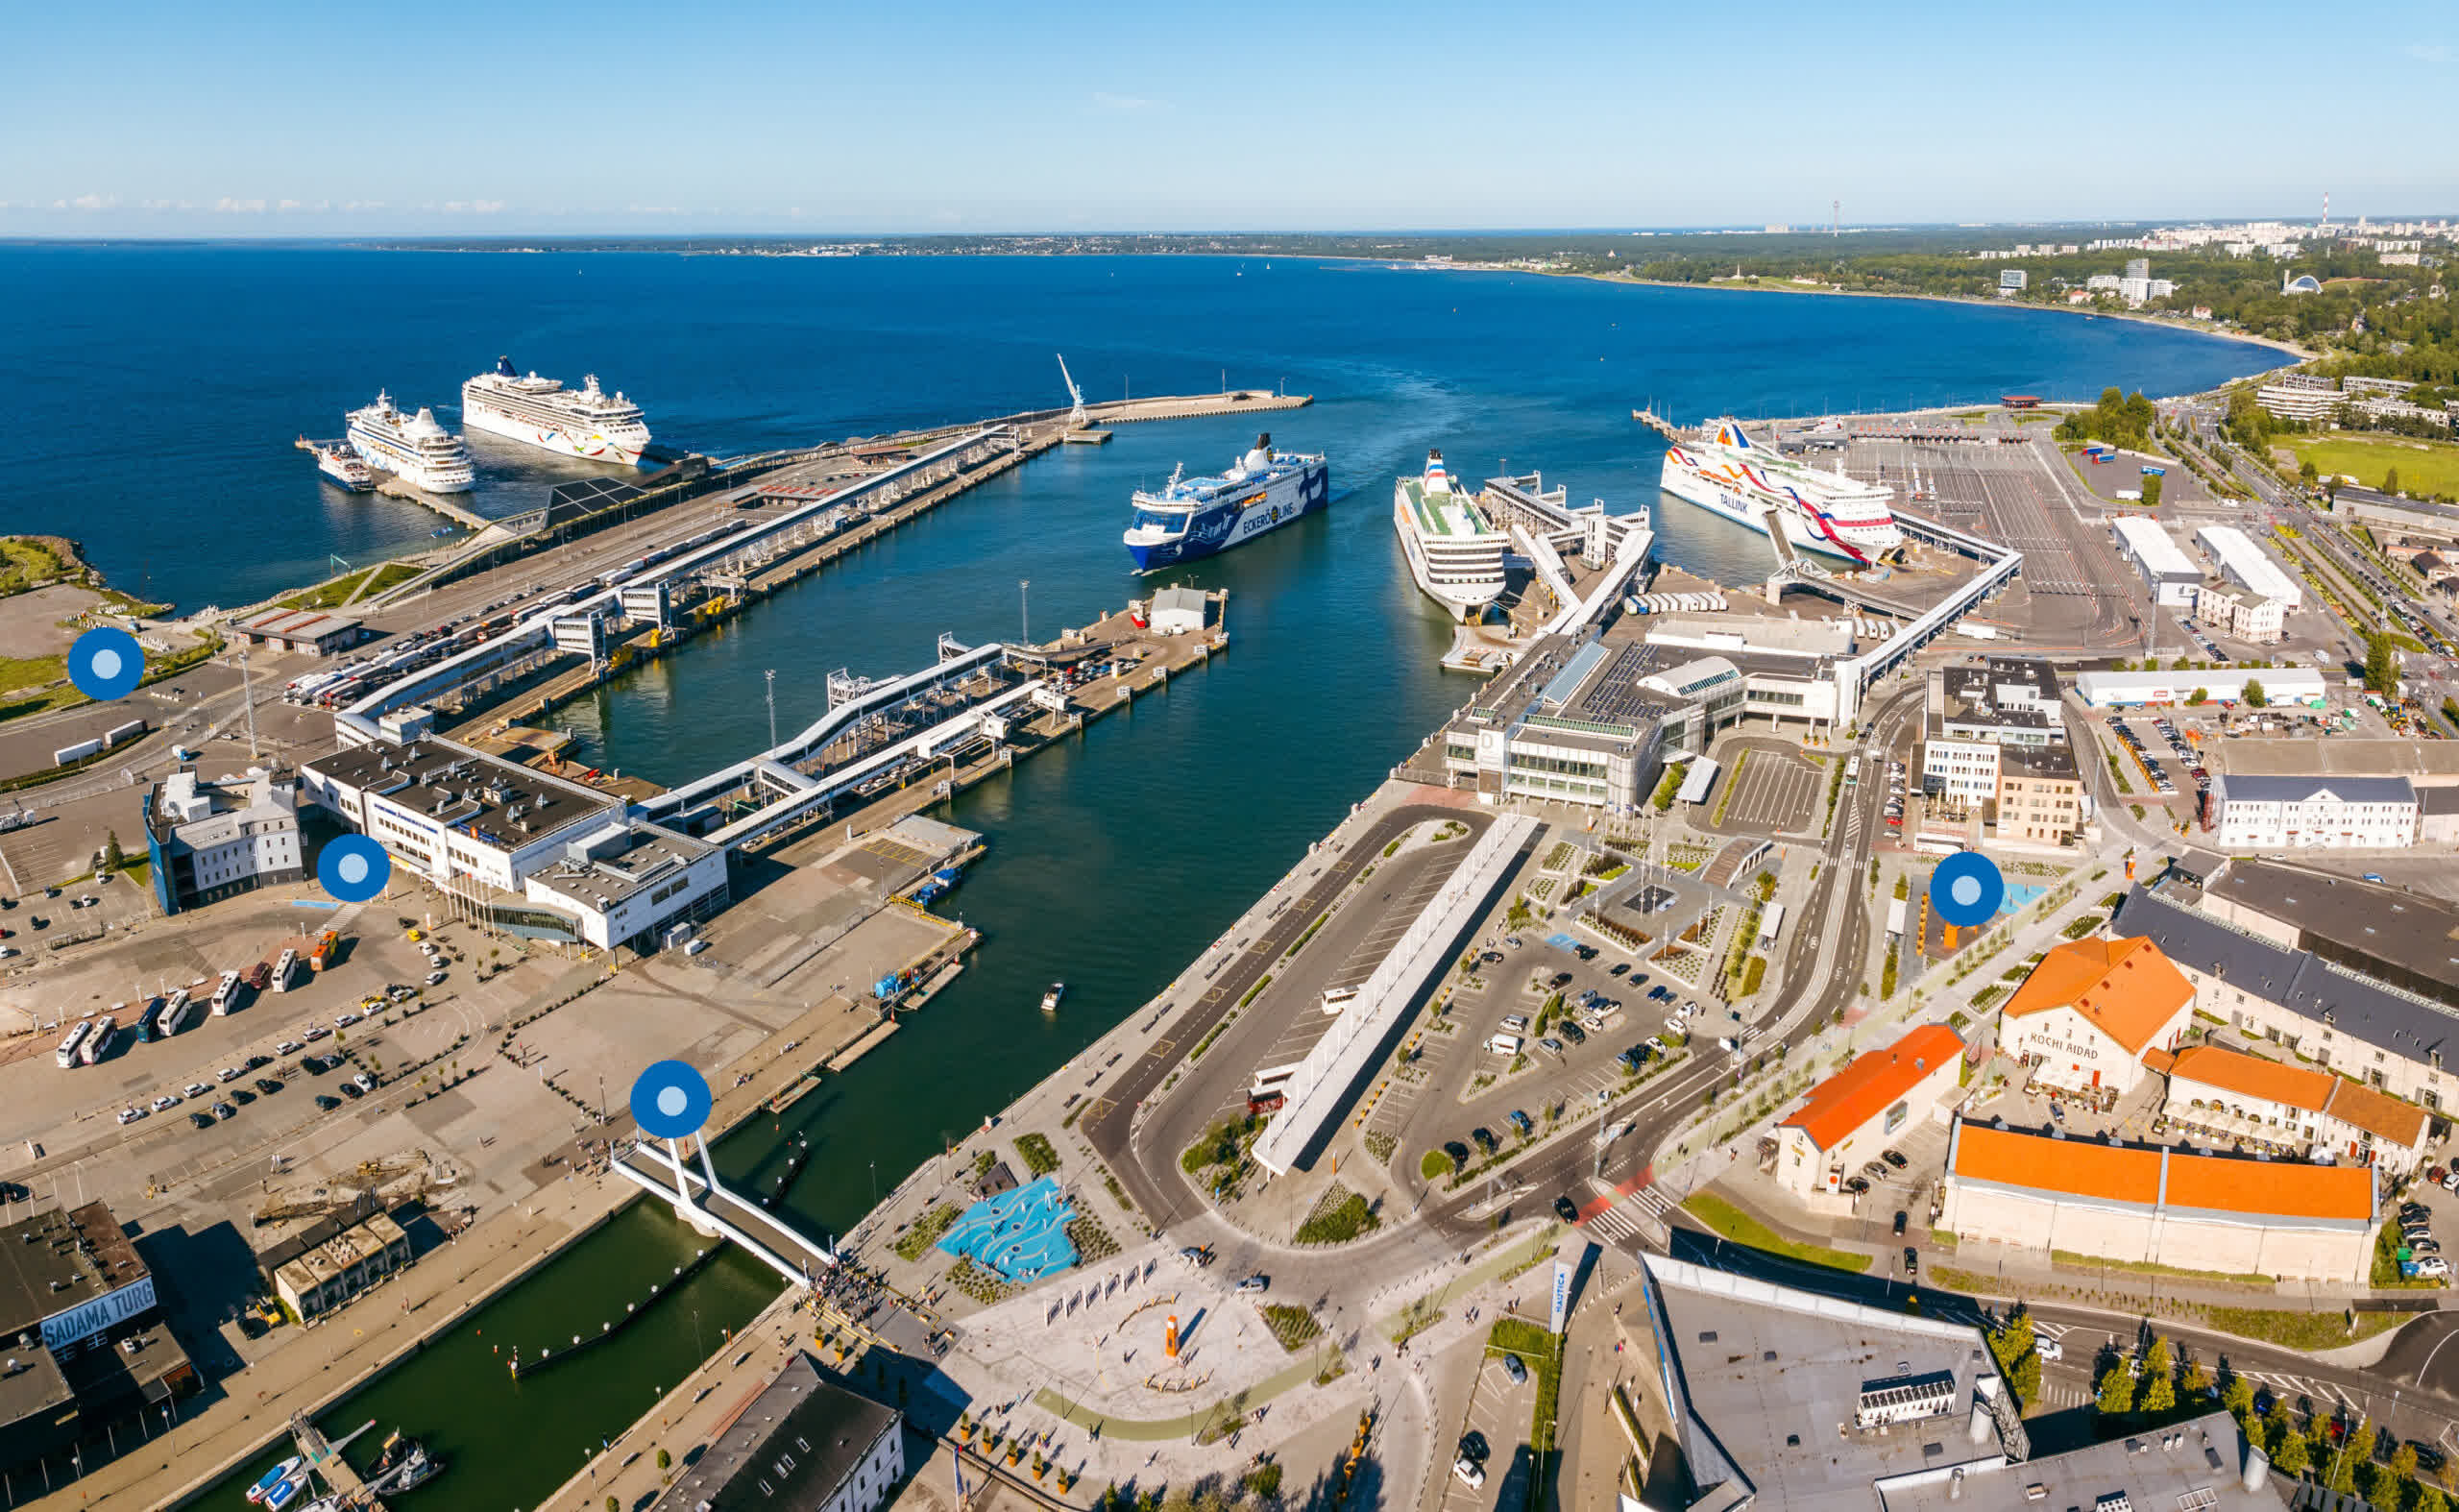
Ports:
Affordable housing:

Healthcare facilities:

Airports:

All these infrastructure investments are today available on the public stock market via listed REITs, MLPs, and other listed infrastructure companies.
Just to give a few examples: Crown Castle Inc. (CCI) owns cell towers, Energy Transfer LP (ET) owns pipelines, Brookfield Renewable Partners L.P. (BEP) owns solar farms, Welltower Inc. (WELL) owns senior housing, Prologis, Inc. (PLD) owns warehouses, etc.
They share 5 characteristics that make them the ideal investment for retirement, especially for someone like me who fears AI disruption, has a long investment horizon, and needs safe and inflation-protected income.
High-Yield Potential
If you buy an e-commerce warehouse at a 7% cap rate with a 15-year lease that includes annual rent escalations of the greater of either a fixed 2% or the rate of CPI, and then finance half of the purchase with a mortgage at a 4% interest rate, you get a roughly 8.5% yield on your equity that will gradually increase over time.
That’s exactly what a REIT like W. P. Carey Inc. (WPC) is doing.

Best of all, because the REIT enjoys significant economies of scale, owning billions of dollars worth of assets, its management costs are very low. The REIT also enjoys an investment-grade rating, which gives it access to cheap debt, especially in Europe.
The REIT does not, however, distribute its entire cash flow to investors. Instead, it retains about 30% of its earnings to keep reinvesting in growth, acquiring new properties, and growing its cash flow and dividend. It results in a 5.3% dividend yield today, but also strong, steady growth.
Last year, its cash flow per share again rose by 6%, and it guided for growth to continue in 2026.
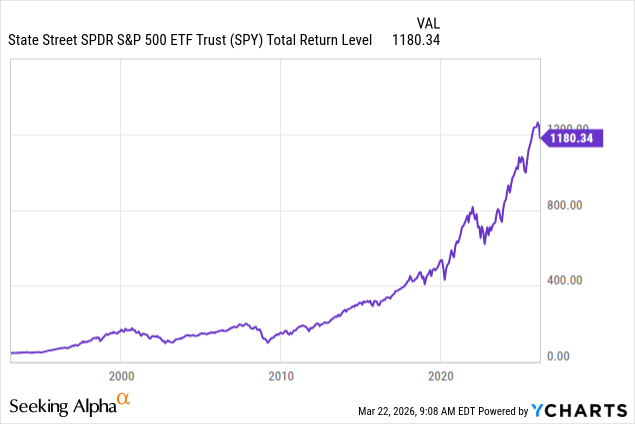
The long-term results speak for themselves. It has massively outperformed the S&P 500 (SPY) all while paying a high yield:
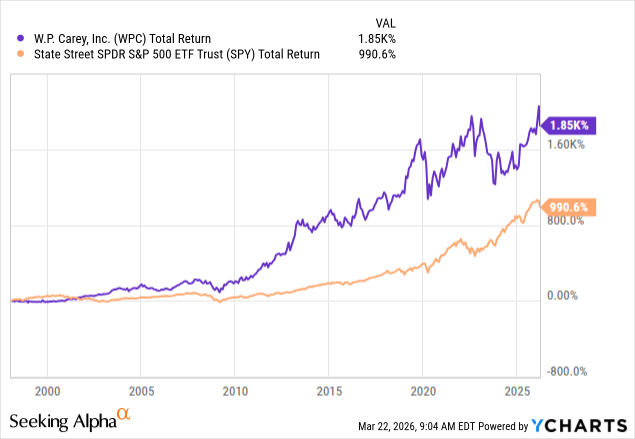
And that’s one of the main reasons why these listed infrastructure companies are such great investments for retirement.
They pay a solid yield that grows steadily. W.P. Carey did not even cut its dividend during the Great Financial Crisis or the pandemic. That’s how resilient its business model is.
Bond-Like Contractual Cash Flows
Investors often see bonds as the safest investments, and that’s in big part because there is a contract that clearly determines what return investors can expect to receive in exchange for lending their capital.
These infrastructure investments are similar in that sense.
You let someone borrow something from you (your property) in exchange for regular payments (rent) and then have a contract in place (a lease) to regulate those payments, often over a long duration.
Returning to the example of W.P. Carey, its initial lease terms are typically 15 years long, and the lease even includes annual rent escalations, which will happen even if we go into a recession.
The only way for the tenant to skip those payments is if it goes bankrupt and defaults on the lease. But even in that scenario, the recovery would likely be strong, as W.P. Carey would then recoup the property, which it could simply release to another tenant, and with industrial rents rising faster than lease escalations over the past decade, it may be able to release the property at an even higher rent.
The recovery is often a lot worse in the case of a loan default, as the collateral may have already been exhausted by the borrower by the time it goes bankrupt.
The point is that these listed infrastructure companies often earn highly consistent and predictable contractual cash flows that are bond-like in nature. There is a clear contract that protects investors, and even in case of troubles, there is typically a good recovery as the real property is still there and can be released to another tenant.
Inflation-Resistant
Infrastructure that’s essential to our society cannot be inflated away. The government can print as much money as it wants, but it cannot print more land, timber, energy pipelines, airports, etc.
These are some of the only assets in the world that have stood the test of time, resisting monetary collapses, currency changes, world wars, and other major crises over centuries.
European capital cities are full of old buildings, often hundreds of years old, standing there, more valuable than ever before.

This reassures me as we live through periods of extreme uncertainty, with governments more indebted than ever, spending like there is no tomorrow, even as major wars are being fought in Europe and the Middle East with no end in sight.
This makes me uncomfortable investing heavily in fixed-income investments, which could significantly erode my long-term purchasing power in case of a monetary black swan.
AI-Proof Fundamentals
Finally, as I noted earlier, I worry a lot about AI and how it could disrupt large fractions of the equity markets.
I think that SaaS companies were just the first domino to fall, and the market hasn’t yet recognized this. Professional service providers, education businesses, healthcare, traditional retail, logistics, car manufacturers, entertainment, etc., will all suffer greatly from AI disruption over the long run.
Very few businesses are truly immune.
Infrastructure businesses are the exception. They are the ultimate anti-AI asset class, as they own real assets that cannot be replicated or disrupted by AI.
It cannot magically create more land in popular, already built-out locations, secure highly bureaucratic construction permits, or even produce construction materials.

These will always remain barriers that will protect essential infrastructure investments from the threat of AI.
There are, of course, exceptions. Offices could suffer disruption of white-collar workers. Malls could suffer from an acceleration in e-commerce growth.
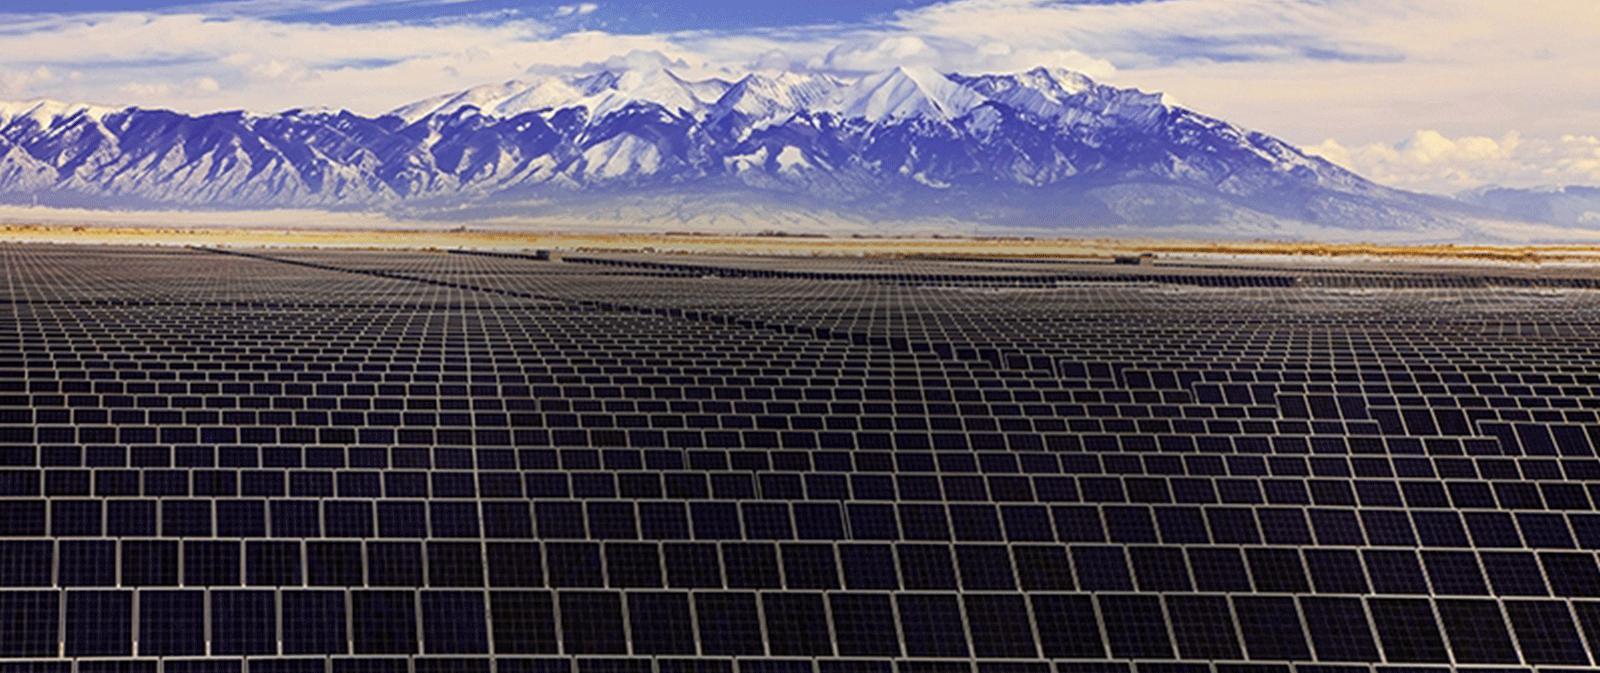
But for the most part, infrastructure-like real assets cannot be easily disrupted. A dam producing energy will only become more valuable as AI requires tons of electricity. So will a solar park, windmills, data centers, cell towers, timberland, e-commerce warehouses, and lots of other property sectors, directly benefiting from AI.
Undervalued and Upside Potential
Here comes the most interesting part.
I am lucky that the listed infrastructure companies are today out of favor.
All the attention has been on Tech stocks lately, pushing their valuations to historic highs:
At the same time, the surge in interest rates led to a historic capital rotation from high-yielding equities, like these listed infrastructure companies, into fixed-income investments.
As a result, there has been little interest in these companies for years, pushing their valuations to historic lows.
REITs (VNQ), as an example, have not traded at such low valuations in decades:
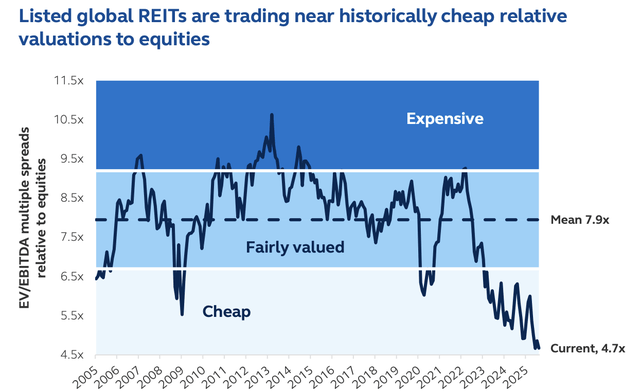
Many individual REITs now trade at steep discounts relative to the fair value of their assets. To give you an example, BSR Real Estate Investment Trust (HOM.U:CA) (BSRTF) owns affordable apartment communities in the growing Texas Triangle, and yet, it trades at a 40% discount to its net asset value, allowing investors like me to buy an equity stake in their assets at just 60 cents on the dollar—with the additional benefits of cost-efficient professional management, diversification, and liquidity.
That’s far more attractive than buying a private, concentrated, management-intensive, and illiquid asset in the private market at a higher valuation.

These low valuations provide a margin of safety, reducing potential downside risk in case of a black swan event, and they also could provide future upside potential as the narrative changes and these investments regain popularity.
I think that the AI revolution could trigger that, as it could destroy a lot of value in the tech sector and trigger a capital rotation back into these AI-resistant asset classes.
Investor Takeaway
I cannot think of anything better than listed infrastructure investments for retirement for people like me who have a multi-decade time horizon, need income, and worry about inflation and the potential impact of the AI revolution on various asset classes.
That is why I invest the majority of my portfolio in High Yield Landlord in these investments. They are essential to our society, cannot be disrupted by AI, enjoy strong inflation protection, generate high income, and are historically cheap, offering a margin of safety and future upside potential.
It is hard to beat that, in my opinion.
Editor’s Note: This article discusses one or more securities that do not trade on a major U.S. exchange. Please be aware of the risks associated with these stocks.