In my Dividend Hunter newsletter service, I recommend a portfolio of high-yield stocks and ETFs. I tell my subscribers to measure results by tracking quarter-to-quarter dividend income.
I frequently talk about several reasons why an income-focused strategy works best for many investors.
Dividend income is predictable. Stock prices go through both bull and bear markets, with the latter often showing up at the worst times. Managing high-yield investments, as I recommend, will produce an income stream that grows every quarter.
Managing a portfolio to grow your income makes it easy to live through market downturns. When stocks go down, income-paying investments go “on sale,” allowing dividends to be reinvested at higher yields, growing income even faster.
Investing to build an income stream makes it easy to determine how much you can pay yourself in retirement. When you stop working, you start drawing a portion of your dividends, knowing exactly how much you can pay yourself out of your retirement savings. I get many notes from subscribers saying their retirement income is much higher than they planned for.
I follow my own advice with my retirement savings. I have a self-funded solo 401 (k) account and a self-funded Simplified Employee Pension (SEP) account.
I stopped contributing to the Solo 401 (k) at the end of 2023. I started the SEP at the beginning of 2024. The 401(k) account is 100% invested in the Dividend Hunter-recommended portfolio. Since I have not made any contributions for over two years, I have accurate return results using my own retirement savings.
The 2024 first quarter marked the start of tracking returns without any additional capital. Dollar value gains have varied significantly from quarter to quarter. However, with nine quarters in the books, the account has not posted a negative quarter. At the end of the 2026 first quarter, the account was up 23.3% from the end of 2023.
Income growth has been much stronger. By the end of 2025, quarterly income grew by 29.0%. That’s almost 30% over two years.
My dividend income for the first quarter of 2026 can only be described as crazy— in a good way. Over the previous four quarters, the income grew by an average 13% year over year. The 2025 first quarter income was up 41% compared to the 2025 fourth quarter.
I think the income gains primarily came from large dividends on the variable-dividend investments in the portfolio. The UBS ETRACS Silver Shares Covered Call ETN (SLVO), which started the year at about $100 per share, paid more than $17 per share in dividends.
Now I am curious how the second-quarter income will do. After the big first-quarter gains, I would be fine with flat earnings for a quarter or two. Either way, I know my retirement plan income will grow year after year.
Unaudited Half-Year Results for the Six Months ended 30 November 2025
The Board of CT Global Managed Portfolio Trust PLC (the ‘Company’) announces the unaudited half-year results of the Company for the six months ended 30 November 2025.
Income Shares – Financial Highlights and Performance Summary for the Six Months
· Dividend yield(1) of 6.2% at 30 November 2025, compared to the yield on the FTSE All-Share Index of 3.2%. Dividends are paid quarterly.
· Net asset value total return(1) per Income share of +12.0% for the six months, outperforming the total return of the FTSE All-Share Index of +11.8% by +0.2 percentage points.
Growth Shares – Financial Highlights and Performance Summary for the Six Months
· Net asset value total return(1) per Growth share of +11.9% for the six months, outperforming the total return of the FTSE All-Share Index of +11.8% by +0.1 percentage points.
· Net asset value total return per Growth share of +208.8% in the 15 years to 30 November 2025, the equivalent of +7.8% compound(1) per year. This compares with the total return of the FTSE All-Share Index of +213.5%, the equivalent of +7.9% compound per year.
The Chairman, David Warnock, said:
“The Board and Manager continue to believe the Portfolios comprise high class investment companies, diversified across geography and investment style and are well set to deliver future shareholder returns”.
Chairman’s Statement
Highlights
• Net asset value (‘NAV‘) total return for the six months of +12.0% for the Income shares and +11.9% for the Growth shares as compared to the total return for the FTSE All-Share Index of +11.8%
• Income shares dividend yield of 6.2% at 30 November 2025
Investment performance
For the six months to 30 November 2025, the NAV total return was +12.0% for the Income shares and +11.9% for the Growth shares. The total return for the benchmark index for both share classes, the FTSE All-Share Index, was +11.8%. Of relevance and for interest, the FTSE All-Share Closed End Investments Index total return was +13.1% for the period.
These six months saw strong returns across equity and bond markets as worries over a global trade war dissipated. This is mostly thanks to the initial level of tariffs announced by President Trump back in April being watered down and a number of ‘trade deals’ being announced between the US and its trading partners. Economic data remained generally positive, with falling – yet still above central bank target – inflation, allowing central banks to further cut interest rates. In the UK, the long-awaited budget brought some relief in respect of keeping financial markets and Labour backbenches satisfied but failed to deliver policies to boost the UK economic growth outlook.
UK equities posted solid returns over the six-month period, with a +12.4% total return for the FTSE 100 and a +7.4% total return for the FTSE 250. Elsewhere, in sterling terms, US equities continued their recovery from the ‘Liberation Day’ selloff, with a +18.6% total return for the S&P 500, while in Europe the total return for the MSCI Europe ex UK Index was +9.4%. The strongest returns included South Korea, with a total return of +52.6% from the MSCI Korea Index. Global government bonds, as referenced by the FTSE World Government Bond Index (GBP Hedged) were up +2.5% and the gold price continued its ascent, up +28.1%.
From 1 June 2025, the beginning of the Company’s current financial year, the investment portfolios have been managed by Investment Managers Adam Norris and Paul Green, supported by the Manager’s broader EMEA Multi-Asset Solutions team (of which they are members). The previous longstanding Investment Manager, Peter Hewitt, has retired and the Board wishes him a long and happy retirement, while thanking him for his years of service.
The Investment Managers’ Review follows, and it is pleasing to see that, in their first six month period, the NAV total return of both Portfolios was strong and also marginally ahead of the benchmark index. The Investment Managers have been repositioning between sectors and regions and highlights of their recent investment activity are set out in their review.
Dividends
As I referenced in the 2025 Annual Report and Financial Statements, in the absence of unforeseen circumstances, it was (and remains) the Board’s intention to pay four quarterly interim dividends, each of at least 1.90p per Income share so that the aggregate dividends for the financial year to 31 May 2026 will be at least 7.60p per Income share (2025: 7.60p per Income share).
To date, first and second interim dividends in respect of the year to 31 May 2026 have been announced and paid, each at a rate of 1.90p per Income share (1.85p per Income share in the corresponding periods in the year to 31 May 2025).
The minimum intended total dividend for the financial year of 7.60p per Income share represents a yield on the Income share price at 30 November 2025 of 6.2% which was materially higher than the yield of 3.2% on the FTSE All-Share Index at the same date.
Borrowing
At 30 November 2025 the Income Portfolio had total borrowings drawn down of £7 million (9.2% of gross assets), unchanged over the period, the investment of which helps to boost net income after allowing for the interest cost. The Growth Portfolio had no borrowings, also unchanged.
Management of share price premium and discount to NAV
In normal circumstances the Board aims to limit the discount to NAV at which the Company’s shares might trade to not more than 5%. During the six months to 30 November 2025 the Income shares traded at an average discount to NAV of -0.4% and the Growth shares traded at an average discount of -3.5%. At 30 November 2025, the Income shares and Growth shares stood at a premium to NAV of +0.6% and +0.9% respectively.
The Company is active in issuing shares to meet demand and equally in buying back when this is appropriate. During the six months to 30 November 2025, 200,000 Income shares were bought back for treasury at an average discount of -3.6% to NAV and then subsequently resold from treasury at an average premium of +1.5% to NAV. In addition, 2,430,000 new Income shares were issued from the Company’s block listing facilities at an average premium to NAV of +1.6%. 1,578,000 Growth shares were also bought back to be held in treasury at an average discount to NAV of -3.8% and 450,000 Growth shares were resold from treasury at an average premium to NAV of +1.6%.
Since the end of the period, a further 3,095,000 new Income shares have been issued and a further 765,000 Growth shares have been resold from treasury. To facilitate this demand, at the start of December 2025, the Company obtained a further block listing of 8,000,000 Income shares, which can be allotted, when there is demand. The Income shares were issued and the Growth shares resold from treasury at average premiums to NAV of 1.6% and 1.5% respectively. Much of this recent demand has come from former shareholders in European Assets Trust which underwent a corporate transaction with The European Smaller Companies Trust (‘ESCT‘) in the autumn. Shares in ESCT are not eligible to be held through the Manager’s savings plans and we welcome those investors who have decided to invest instead in CT Global Managed Portfolio Trust.
Share conversion facility
Shareholders have the opportunity to convert their Income shares into Growth shares or their Growth shares into Income shares annually subject to minimum and maximum conversion thresholds which may be reduced or increased at the discretion of the Board. On 6 November 2025 the conversion proceeded for those Shareholders who had elected to do so. The net result of those conversions was a decrease of 38,324 Income shares and an increase of 15,549 Growth shares in issue. The ability to convert without incurring capital gains tax should be an attractive facility for Shareholders and the next conversion date (subject to minimum and maximum thresholds) will be in October 2026. Details will be provided when the Company’s 2026 Annual Report and Financial Statements is published in the summer.
Investment management fee
During the period, the Board and Manager agreed a reduction in the investment management fee (the ‘Fee‘) with effect from 1 September 2025. The Fee has been reduced to 0.60% per annum of the net asset value of each portfolio of the Company (rather than 0.65% per annum of their total assets of each portfolio) and there will no longer be any charge on any assets which are invested in other investment vehicles managed by the Manager.
Board changes
Simon Longfellow stepped down as a non-executive director with effect from 31 December 2025. Simon was also the Chair of the Marketing Committee. Simon has taken up a full-time senior marketing role and as a result was not able to continue his role with the Company. The Board was very sorry to lose Simon who has been an excellent colleague with great insights contributing particularly into our marketing efforts and we wish him all the best for the future. The Board is well advanced with a recruitment process to replace him. In the interim, I have taken on the role of Chair of the Marketing Committee.
Outlook
The global economy demonstrated notable resilience throughout 2025, and we expect the coming year to be characterised by an effort to ‘extend the cycle’, supported by both fiscal and monetary policy measures aimed at sustaining growth at or slightly above 2025 levels. The market anticipates further interest rate cuts in the US and UK easing borrowing costs for households and corporates alike, with the possibility of an accelerated pace in the US should a more dovish Federal Reserve Chair be appointed by President Trump. Geopolitical risk is currently more elevated than for many years. Whilst US President Trump has attempted to cool regional conflicts, his ‘America First’ policy continues to shake up the post-World War II order.
The Board and Manager continue to believe the Portfolios comprise high class investment companies, diversified across geography and investment style and are well set to deliver future shareholder returns.
David Warnock
Chairman
29 January 2026
Investment Managers’ Review
We are pleased to report our first half-year results for CT Global Managed Portfolio Trust as the new Investment Managers since we took over from Peter Hewitt on 1 June 2025. Peter has now retired from Columbia Threadneedle Investments, and we wish him well in his retirement.
Overall, equity markets delivered strong positive returns in the six months to the end of November 2025. Investors will recall the volatile markets of April, marked by concerns around tariffs and their impact on global economic activity.
Since then, equity markets have recovered strongly. To this end, the NAV total return of the Growth shares was +11.9% and the Income shares +12.0%. The share price total return for the Growth shares was +16.3% and the Income shares was +10.7%.
As comparators, the total return for the FTSE All-Share Index was +11.8% and for the FTSE All-Share Closed End Investments Index was +13.1%.
We are also pleased to report a busy half-year period. We, like Peter before us, are enthused for the Investment Company sector and the opportunity set in front of us. We continue to adjust the Portfolios to further represent the ‘global’ remit of the Company, whilst allocating to areas of the market which represent strong opportunities for future returns.
During our first period there has been an increase in turnover for both Portfolios and we have set out below our vision for the direction of the Company and how exposures were reflected across both Portfolios at 30 November 2025.
A hardware revolution
Shares in technology companies, mainly US listed, have powered market returns over the past decade. Their earnings growth has been unrivalled within global markets, with some commentators often – wrongly, so far – considering technology companies too large to continue growing at premium rates and potentially overvalued.
However, the ‘law of big numbers’ theory has yet to materialise, as these technology behemoths continue to grow at a premium rate to the market. Whilst the fruits of Artificial Intelligence may have yet to be adopted by the masses, the ‘AI Infrastructure’ spend is leading to vast amounts of cash being deployed to fund future technology growth. This build out is driven by hardware, not so much software, and those companies interwoven in the AI Infrastructure supply chain are being handsomely rewarded by investors.
Within the Growth Portfolio, we have added to Polar Capital Technology Trust (share price total return over the six-month period was +39.5%), which represented 5.6% of the Growth Portfolio’s assets at the Company’s half year point. Combined with Allianz Technology Trust (+34.1%), the Portfolio’s weighting in global technology trusts was 9.1% at 30 November 2025.
Within the Income Portfolio we have added new infrastructure holdings Pantheon Infrastructure (‘PINT‘) and Cordiant Digital Infrastructure (‘CORD‘). Whilst different in their approach, both are benefitting from the AI Infrastructure roll out from large corporations and government directives. PINT is expected to complete on its first company sale, Calpine Energy, in early 2026 at an expected multiple on invested capital of 2.8x. CORD, on the other hand, continues to grow and develop assets in Europe, announcing a partnership with the Czech Government, with an ambition to develop one of its Prague data centre sites to become one of the EU’s next-generation Artificial Intelligence gigafactories. If successful, we view this as an area of strong growth for the company.
Emerging Markets – a decade to forget
Emerging Markets have endured a lost decade. Whilst emerging market economies have grown – and continue to converge on developed markets – earnings growth has stalled. In fact, earnings per share (EPS), measured in US Dollar terms, are at the same level as they were in 2015.
Yet paradoxically, outside of US equities, Asia and Emerging Markets have some of the world’s most innovative companies. Chinese technology companies, much like their US counterparts, are spending ferocious amounts of cash to further develop their Artificial Intelligence capacity. At the same time, these highly profitable companies are showing signs of shareholder friendliness, such as embarking on large share buy-backs and introducing dividend policies.
Within the Growth Portfolio, we increased the combined Asia and Emerging Markets exposure from 3.4% to 13.6%. We have introduced Fidelity Emerging Markets. The company is not only exposed to a favourable environment for emerging markets, but also has the flexibility to go short of specific companies (i.e. benefit from potential share price declines). The manager has shown a strong capacity to generate extra performance from this investment technique and should continue to drive performance in volatile emerging equity markets.
Within the Income Portfolio, we increased the combined Asia and Emerging Markets exposure from 7.3% to 13.7%. We have added Invesco Asia Dragon Trust (‘IAD‘), which represented 2.9% of portfolio assets at the Company’s half year point. IAD’s managers, Fiona Yang and Ian Hargreaves, have demonstrated strong ability to generate performance in different market environments, utilising a highly stock-specific investment approach. The company pays shareholders an aggregate dividend equivalent to 4% of its prior financial year end NAV in four equal instalments. This is achieved by using the company’s reserves to top up the natural income generated, allowing the managers to invest in an unconstrained manner, rather than targeting high yielding stocks per se. We additionally acquired IAD shares for the Growth Portfolio, which represented 4.9% exposure at the Company’s half year point.
Pent up Private Equity value
We are excited by the pent-up value on offer within Private Equity, which has been hampered by a poor ‘exit’ environment – the ability for Private Equity managers to sell their companies – with potential IPO candidate companies frozen out from listing. Despite this fallow period for listed Private Equity investment companies, many portfolio companies continue to grow their earnings and are conservatively valued within net asset values. In addition, we observe the IPO market is beginning to thaw which may ignite the Private Equity flywheel once again, a strong catalyst for listed Private Equity investment companies’ performance.
Within the Growth Portfolio, our largest single exposure is in Oakley Capital Investments (+13.9%), a listed Private Equity company which focuses on partnering and supporting European entrepreneurs across technology, consumer, business services and education sectors. The company has a strong long-term track record and announced in July the partial exit of a portfolio company at a 300% premium to carrying value, highlighting that in-demand companies will attract competitive prices, regardless of the ‘exit’ environment.
We have additionally topped up our holding in The Schiehallion Fund (+5.8%), a late-stage Private Equity investment company managed by Baillie Gifford. The company has had a tricky few years as growth investing moved sharply out of favour. However, we now see clear ‘winners’ of its investment approach, with some of its largest holdings, namely SpaceX and Bending Spoons, achieving valuation levels rarely found within Private Equity. We sold our entire holding in Pantheon International into share price strength.
Despite our optimism regarding Private Equity, holdings Augmentum Fintech(-18.4%) and Literacy Capital(-13.4%) were the two largest underperformers in the Growth Portfolio. On the former, the company took a large impairment on one of its previously largest holdings and the latter swung to a meaningful discount for the first time in its history post-IPO. We remain comfortable owners of both investment companies – in our view, they own relatively mature portfolios of assets. In a revitalised ‘exit’ environment, we believe both managers have the ability to realise strong returns from their portfolio holdings.
Within the Income Portfolio, Apax Global Alpha (‘APAX’) was acquired by a third-party group at a 17% discount to its net asset value. APAX had lagged the wider Private Equity sector and had, in our view, an excessively high dividend policy which would be difficult to meet if the manager could not exit portfolio holdings. We had trimmed the holding prior to the bid and subsequently sold it entirely after the share price rally, post the bid announcement and prior to completion.
A plan for UK growth
The UK equity market delivered a strong absolute return, albeit lagging other equity markets. Local UK investors long proclaim UK equities are ‘cheap’. This may be true from an aggregate market price-to-earnings multiple, but in our view represents a lower growth collection of stocks versus other markets, rather than a ‘UK PLC discount’.
As a result, we have reduced the overall weighting to UK equities. Within the Growth Portfolio, the allocation to UK Equity investment companies fell from 29.4% to 15.7%. We divested fully from Finsbury Growth & Income Trust, The Law Debenture Corporation, Baillie Gifford UK Growth Trust, Lowland Investment Company, Diverse Income Trust and Henderson Smaller Companies Investment Trust.
It is not obvious to us that ‘cheap’ markets are enough of a catalyst for performance. As a result, within the Growth Portfolio, we have introduced two new holdings in Strategic Equity Capital, managed by Gresham House’s Ken Wotton, as well as Odyssean Investment Trust, managed by Stuart Widdowson and Ed Wielechowski. Both sets of managers, with different investment approaches, aim to take significant positions in their portfolio companies and engage with management teams to drive business improvement, if required. We see these highly engaged approaches as an important lever to unlock value within small and mid-sized UK companies.
Similarly, within the Income Portfolio we reduced the overall exposure to UK Equity investment companies from 40.2% to 27.1% over the six months. We fully divested from Diverse Income Trust and Henderson High Income Trust, noting the latter also contained fixed income exposure. Eagle eyed readers will notice we have retained exposure to The Law Debenture Corporation and Lowland Investment Company, where we think the investment team’s focus, led by James Henderson and Laura Foll, on income stock picking remains a suitable investment approach and worthy of inclusion for this portfolio.
It is our intention to continue to further reduce our exposure to UK Equity investment companies within both the Growth Portfolio and Income Portfolio in a thoughtful and measured way, in order for shareholders to benefit from broader opportunities, such as within infrastructure or global equities.
Biotechnology recovery
Biotechnology roared higher in the first half of the Company’s financial year generating significant returns. With tariff fears, drug pricing concerns and interest rates all subsiding, biotechnology stocks were some of the strongest performing in the six-month period. Merger & Acquisition announcements remain rife in the sector as pharmaceutical companies look to replenish their diminishing patent-related income streams. For context, Biotech Growth Trust(+79.0%), a holding within the Growth Portfolio, and International Biotechnology Trust (+73.7%), a holding within the Income Portfolio, were both standout performers, recovering some prior poor performance.
We have used this strength to reduce exposure, allocating to aforementioned Private Equity, technology and Emerging Markets investment companies.
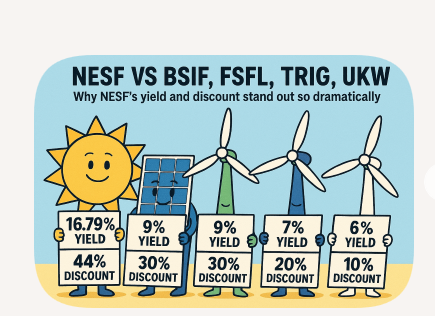
Renewable Energy ‘head-winds’
Renewable Energy Infrastructure investment companies Greencoat UK Wind (‘UKW‘) (-7.7%) and The Renewables Infrastructure Group (‘TRIG’)(-3.6%) remained a drag on performance for the Income Portfolio. Persistently low cash generation from portfolio assets versus projections are weighing on sentiment, whilst, conversely to Private Equity, transactions are grinding to a halt, providing scant evidence of ‘true’ market value. Although the UK government’s consultation of Renewables Obligation Certificates (ROCs), the subsidy regime which underpins many renewable energy project cash flows, has since been determined, revisions of existing contracts adds further uncertainty to the sector.
Despite the valuation uncertainties within operational assets, we introduced GCP Infrastructure (‘GCP’) to the Income Portfolio. GCP is a company which owns loans focused on UK infrastructure (including renewables). The company has had an extremely low default rate since its IPO 15 years ago and, in recent years, has sold assets to pay down its revolving credit facility. Despite this progress, the company’s share price performance has been weak and the dividend yield is now c.10%. We believe we are being paid to wait as investors in a bond-like investment company. We await further asset disposals for it to completely pay down its revolving credit facility and return additional capital to us as shareholders.
A constructive outlook
As we look ahead to the calendar year of 2026, our outlook remains sanguine in regard to corporate profitability.
Fiscal stimulus is set to play a key role in several major economies. Japan and Germany have already announced substantial packages, while, in the United States, the ‘One Big Beautiful Bill’ passed earlier in 2025 is expected to deliver a meaningful boost. China is also likely to implement incremental measures to keep growth on track toward its 5% target.
We expect further solid global economic growth in 2026. US growth is likely to remain broadly in line with 2025, with upside potential from additional stimulus. The UK outlook remains subdued, with below-trend but positive growth. Overall, conditions appear supportive for another year of steady expansion which in turn should drive positive corporate earnings growth.
Tariffs remain a structural feature of the global landscape, though their form may evolve. Supply chains have adapted to the new regime, and the economic impact has been relatively contained, helped by exemptions and reductions from headline rates compared to initial fears earlier in 2025.
We approach 2026 with optimism: global growth prospects remain positive, however we note that valuations appear relatively full in certain areas. Although markets can be sensitive to large policy shifts and geopolitical surprises, our central view is that corporates can continue to demonstrate earnings growth, particularly in transformative sectors such as technology and AI Infrastructure. We remain alive to how geopolitical events can further shape the investment landscape. This is not just through heightened risks, but also how the evolving priorities of both governments and corporates can create opportunities.
We look forward to further updating investors throughout the remainder of the year and in the Annual Report.
Warren Buffett still goes to office every day and influences trades at Berkshire Hathaway despite stepping down from the helm late last year.
Over the past six decades of managing Berkshire and navigating the most complex events of the 20th century while delivering strong long-term returns, Buffett has consistently shared his investing philosophy, learnings, and mistakes through Berkshire’s annual shareholders letters.
Despite markets and industries evolving rapidly in recent years with the introduction of AI, Buffett’s evergreen investment advice still remains relevant in today’s dynamic economy
Buffett on How to Think About Investing
In the 1996 Berkshire shareholders letter, Buffett had stated that intelligent investing is not ‘complex,’ but it is far from easy. He said one does not need to understand modern portfolio theory or option pricing, but needs to invest in an ‘easily understandable’ business whose earnings have a high probability of growing over the next decade or two.
‘If you aren’t willing to own a stock for ten years, don’t even think about owning it for ten minutes,’ Buffett said in one of his letters.
Looking at companies as private businesses to evaluate their economic prospects, leadership, competitive edge, and the cost of investment is more essential than focusing on recent stock performance
‘We are willing to hold a stock indefinitely so long as we expect the business to increase in intrinsic value at a satisfactory rate,’ Buffett noted in one of his shareholder letters. ‘We view ourselves as business analysts—not as market analysts…not even as security analysts.’
Stock Price Is Just Mr. Market’s Mood On A Given Day
In the 1987 shareholder letter, Buffett had described Mr. Market as a metaphor for the stock market’s daily mood swings, which can be driven by emotion rather than fundamentals.
‘Mr. Market is there to serve you, not to guide you,’ Buffett had noted. ‘It is his pocketbook, not his wisdom, that you will find useful.’
Buffett’s mentor, Benjamin Graham, widely regarded as the father of value investing, had pioneered the concept. Buffett learned from Graham at Columbia Business School and later worked under him at his investment firm.
According to Buffett, Mr. Market’s mood can swing from euphoric optimism to extreme pessimism. When overly enthusiastic, Mr. Market may offer to sell shares at inflated prices, driven by the fear that investors will seize profit opportunities and deprive him of gains. Conversely, during downturns, Mr. Market can be despondent, pricing assets at depressed levels out of fear for the future.
Buffett has observed that ‘the more manic depressive his behaviour, the better for you.’
When Mr. Market is euphoric, he overpays for stocks; when depressed, he sells quality assets at bargain prices. The wider the emotional swings, the more opportunities disciplined investors have to buy undervalued assets or sell overvalued ones
In all, Buffett thinks Mr. Market doesn’t mind being ignored because if you don’t like his quotation today, he will be back with a new one tomorrow.
‘Transactions are strictly at your option,’ he had stated.
Value Investing is ‘Redundant’
Buffett believes that value and growth are interconnected instead of two different approach paths. ‘Growth is always a component in the calculation of value,’ he had noted, adding that the term ‘value investing’ is ‘redundant’ while questioning what ‘investing’ is if is not the act of seeking value at least ‘sufficient to justify the amount paid?’
He thinks it is ‘financially fattening’ to pay more for a stock than its calculated value, hoping it can be offloaded soon for a higher price. Value investing involves handpicking stocks with low price-to-book-value and price-to-earnings ratios or a high dividend yield, but these attributes don’t determine if a stock price is justified.
His concept of ‘owner earnings’ could prove to be useful in determining the real value of a business, which focuses on what’s left for the company owner and shareholders after deducting all liabilities and expenses related to running the business.
The owner-earnings equation does not yield the ‘deceptively’ precise figures provided by GAAP, because the average annual expenses for plant and equipment used in operations ‘must be a guess’ and can be difficult to estimate. However, Buffett considers the ‘owner earnings’ figure instead of GAAP data for valuation purposes when buying stocks or entire businesses.
Finding Cheap Stocks Isn’t Enough
Buffett’s value investing principles of buying great businesses at cheap prices is a popular strategy leveraged by investors and hedge funds worldwide.
‘If you buy a stock at a sufficient low price, there will usually be some hiccup in the fortunes of the business that gives you a chance to unload at a decent profit, even though the long-term performance of the business may be terrible. I call this the “cigar butt” approach to investing,’ Buffett noted in Berkshire’s 1989 shareholder letter.
Buffett believes that a cigar butt has one puff left in it and won’t offer much of a smoke, but a ‘bargain purchase’ will make that puff all profit.
He said that this kind of approach to buying businesses is foolish since the initial bargain price will likely not turn out to be such a ‘steal after all.’
‘Never is there just one cockroach in the kitchen,’ Buffett highlighted, referring to his views that problems keep coming up in difficult businesses, and time erodes mediocre businesses that face stiff competition, high inflation, and generate low returns. In contrast, time serves as a compounding force for successful businesses with unique moats.
Buffett had stated his first mistake was buying control of Berkshire Hathaway. Though he knew textile manufacturing was ‘unpromising,’ he still bought into the company because the price looked cheap. Such stock investments proved rewarding in his early years, but he understood the strategy was not ideal by the time Berkshire came along in 1965.
In the 1992 shareholder letter, Buffett said that the less you trade, the more patient you can be, which is the most valuable attribute in investing.
‘Inactivity strikes us as intelligent behaviour,’ he had noted.
In the 1993 letter, Buffett explained that he and Charlie Munger had decided to settle for ‘one good idea a year.’
In the same letter, he said that portfolio diversification is for those who do not understand business economics. These investors should own ‘a large number of equities and space out his purchases,’ which can be done by periodically investing in an index fund.
However, if you understand business economics, ‘diversification makes no sense for you… It is apt simply to hurt your results and increase your risk.’
In all, Buffett detailed in the 2007 shareholder letter that Berkshire looks for businesses it understands that showcase favorable long-term economics, trustworthy management, and a sensible price tag.
‘A truly great business must have an enduring “moat” that protects excellent returns on invested capital,’ he wrote.
Look For Businesses Insulated From Changes
Buffett had noted in his 1996 letter that he and Munger favoured businesses and industries unlikely to experience major change with operational and growth clarity up to two decades into the future. Both also encouraged new ideas, products, and processes.
‘As investors, however, our reaction to a fermenting industry is much like our attitude toward space exploration: We applaud the endeavour but prefer to skip the ride.’ The top example is Coca-Cola.
In 1996, Buffett claimed he looked at the company’s shareholder report from 1896 to find it had already formulated and followed its 100-year growth plan, while the core product had not changed at all.
As he wrote in his 2011 letter: ‘”Buy commodities, sell brands” has long been a formula for business success.’
Disclaimer: Our digital media content is for informational purposes only and does not constitute investment advice. Please conduct your own analysis or seek professional advice before investing. Remember, investments are subject to market risks, and past performance does not guarantee future returns.
Next up, the Coca-Cola Company (KO), which faces similar problems as GIS. To be fair, Coke is in a better spot because it has plenty of low- (or no-) calorie drinks to push, such as Coke Zero, Dasani bottled water and various coffees and teas. But the shift toward healthier eating is still a headwind.
Meantime, Coke’s lame dividend growth—typically just a penny or two a year—isn’t enough to get our hearts racing, especially with the stock yielding just 2.7%. But despite all that, investors still cling to Coke as a “safety” stock. That’s why they’ve bid its shares well above its sluggish payout growth.
Contrarian Investor
How dividends and compounding have boosted returns
While stock price appreciation is impressive, the real power of Buffett’s Coca-Cola investment lies in dividends and compounding.
Coca-Cola has increased its dividend every year since Buffett’s initial investment. Today, Berkshire Hathaway receives over $700m in annual dividends from its Coca-Cola shares. Given that Buffett originally invested $1.3 billion, this means he is receiving over 50% of his initial investment back in dividends each year – without selling a single share.
The power of dividend reinvestment and compounding has exponentially increased Buffett’s returns. Over time, the combination of dividend growth and share price appreciation has made Coca-Cola one of the most successful long-term holdings in Berkshire Hathaway’s history.
This “Do Nothing” Portfolio Move Pays 8.3% (and Lets Us Sleep at Night)
Michael Foster, Investment Strategist Updated: April 13, 2026
The ever-evolving situation in the Middle East has left a lot of uncertainty in the air. But in unpredictable times like these, the best move is often simply this: stay the course.
Investors in high-yielding closed-end funds (CEFs) know this. Our favorite income plays throw off dividends averaging 9%. That means we can sit back, wait out volatility and get paid handsomely as we do.
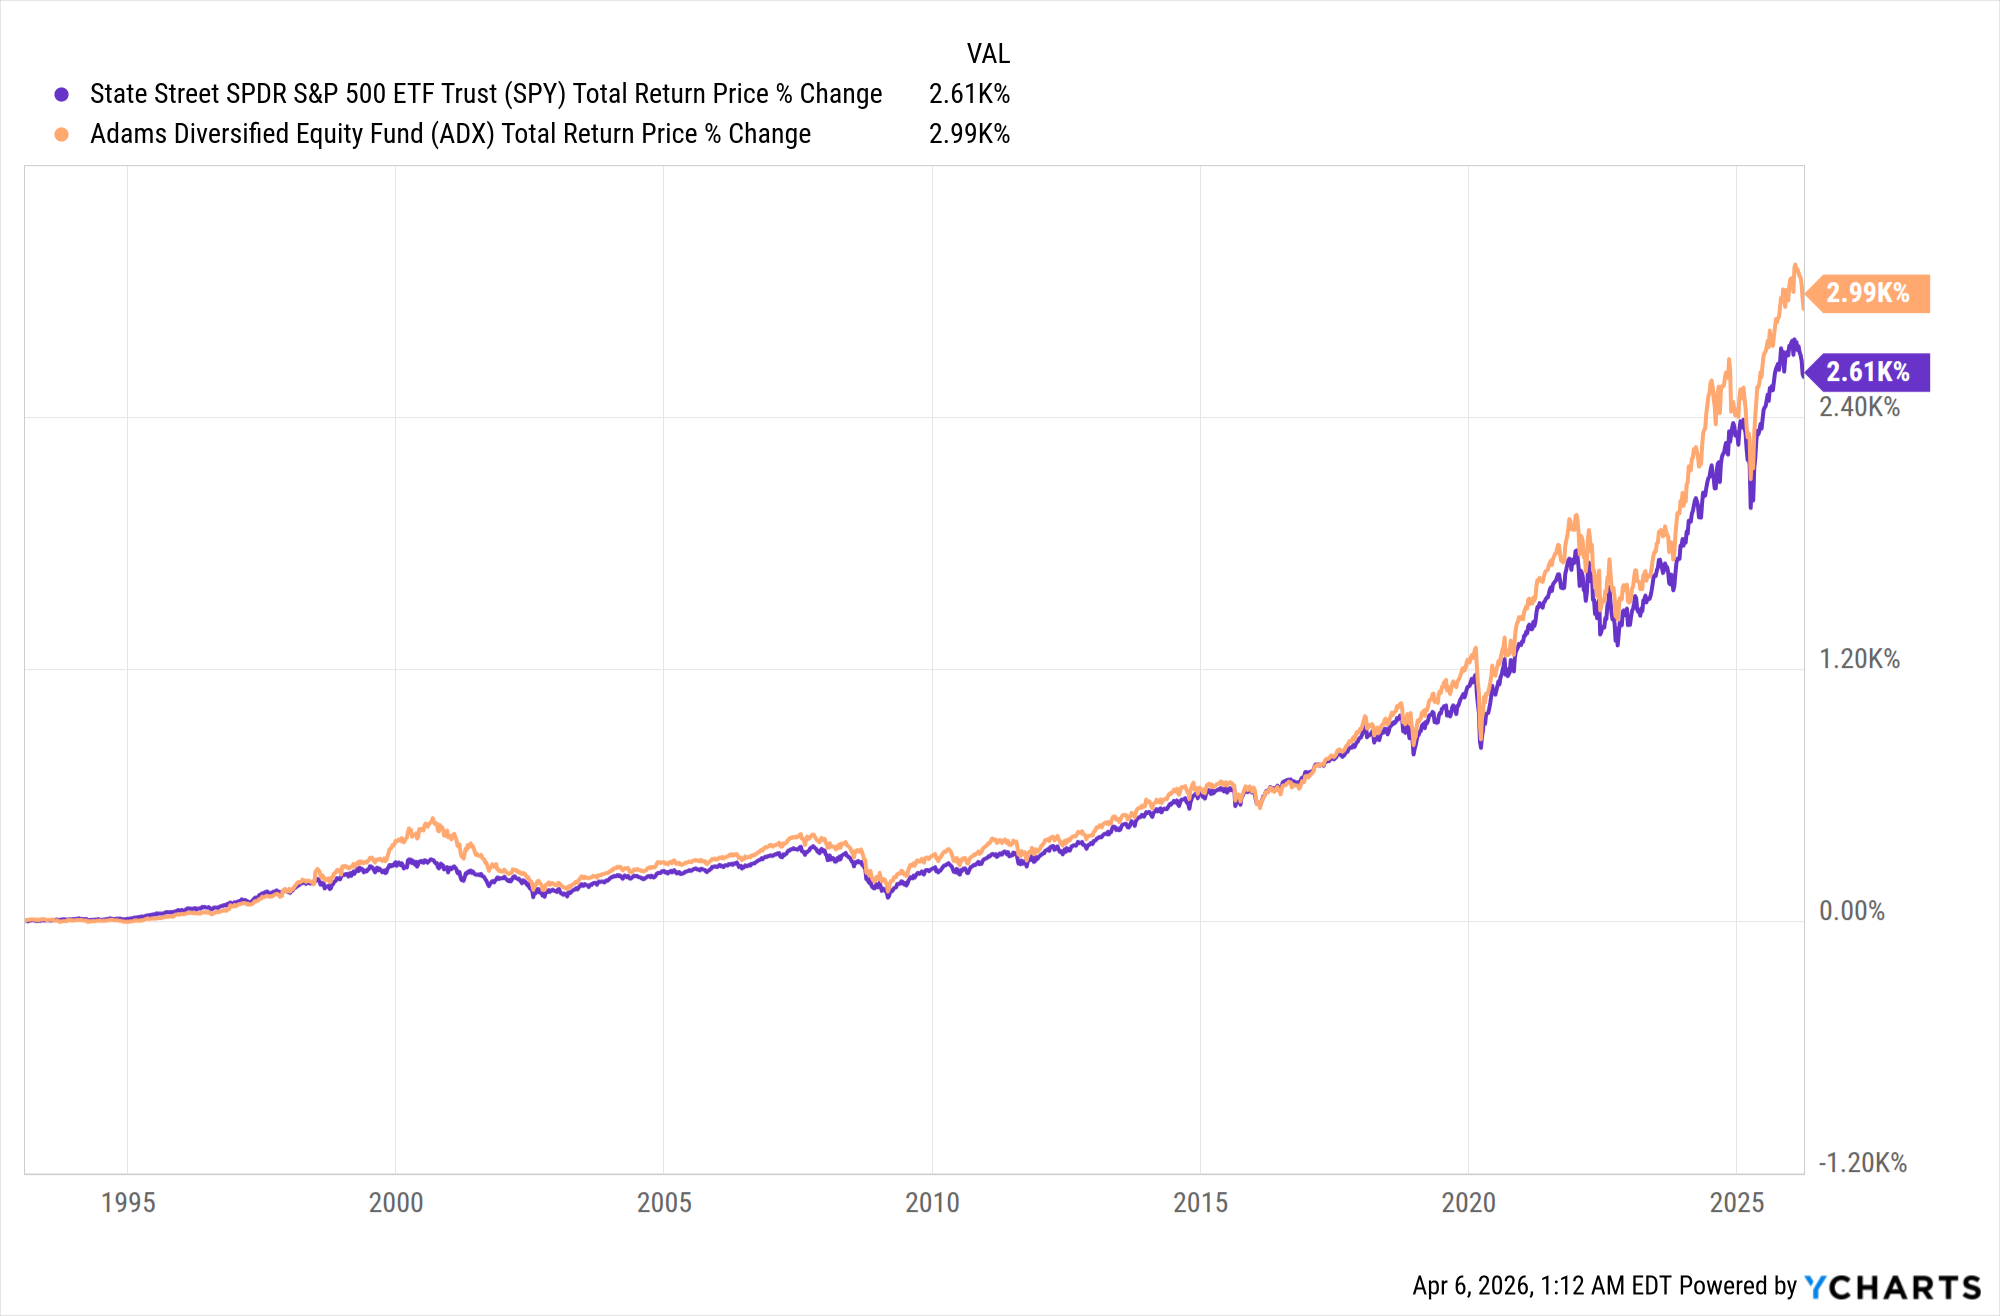
And some CEFs, like our long-time CEF Insider portfolio holding the Adams Diversified Equity Fund (ADX), go one further: ADX kicks out an 8.3% dividend as I write this. And it does this while outperforming the S&P 500 over the long haul.
8.3% Dividends and Index-Busting Performance. ADX Has Both
That makes ADX a rare bird indeed. As you can see above, the fund has beaten the S&P 500 in the last 33 years, with every $1 invested now worth $30.90 for ADX versus $27.14 for the benchmark State Street SPDR S&P 500 ETF Trust (SPY). (Thirty-three years is our timeline because that’s how long SPY has been around.)
It’s a testament to the power of the old Wall Street adage that “the trend is your friend”—especially when you consider that ADX holds many of the same stocks SPY does, NVIDIA (NVDA), JPMorgan Chase (JPM) and Meta Platforms (META) among them.
ADX is itself an example of the wisdom of taking the long view: It’s been around since 1929 and has tapped that long institutional memory to drive those outsized returns. Its shareholders have consistently received a high-single-digit dividend while they’ve owned the fund.
This is why ADX was one of the first funds we added to the CEF Insider portfolio in July 2017, just a few months after launching the service.
Even investors who simply held SPY have done well in the long haul (even though we much prefer ADX and its 8.3% dividend over SPY’s microscopic 1.1% payout)
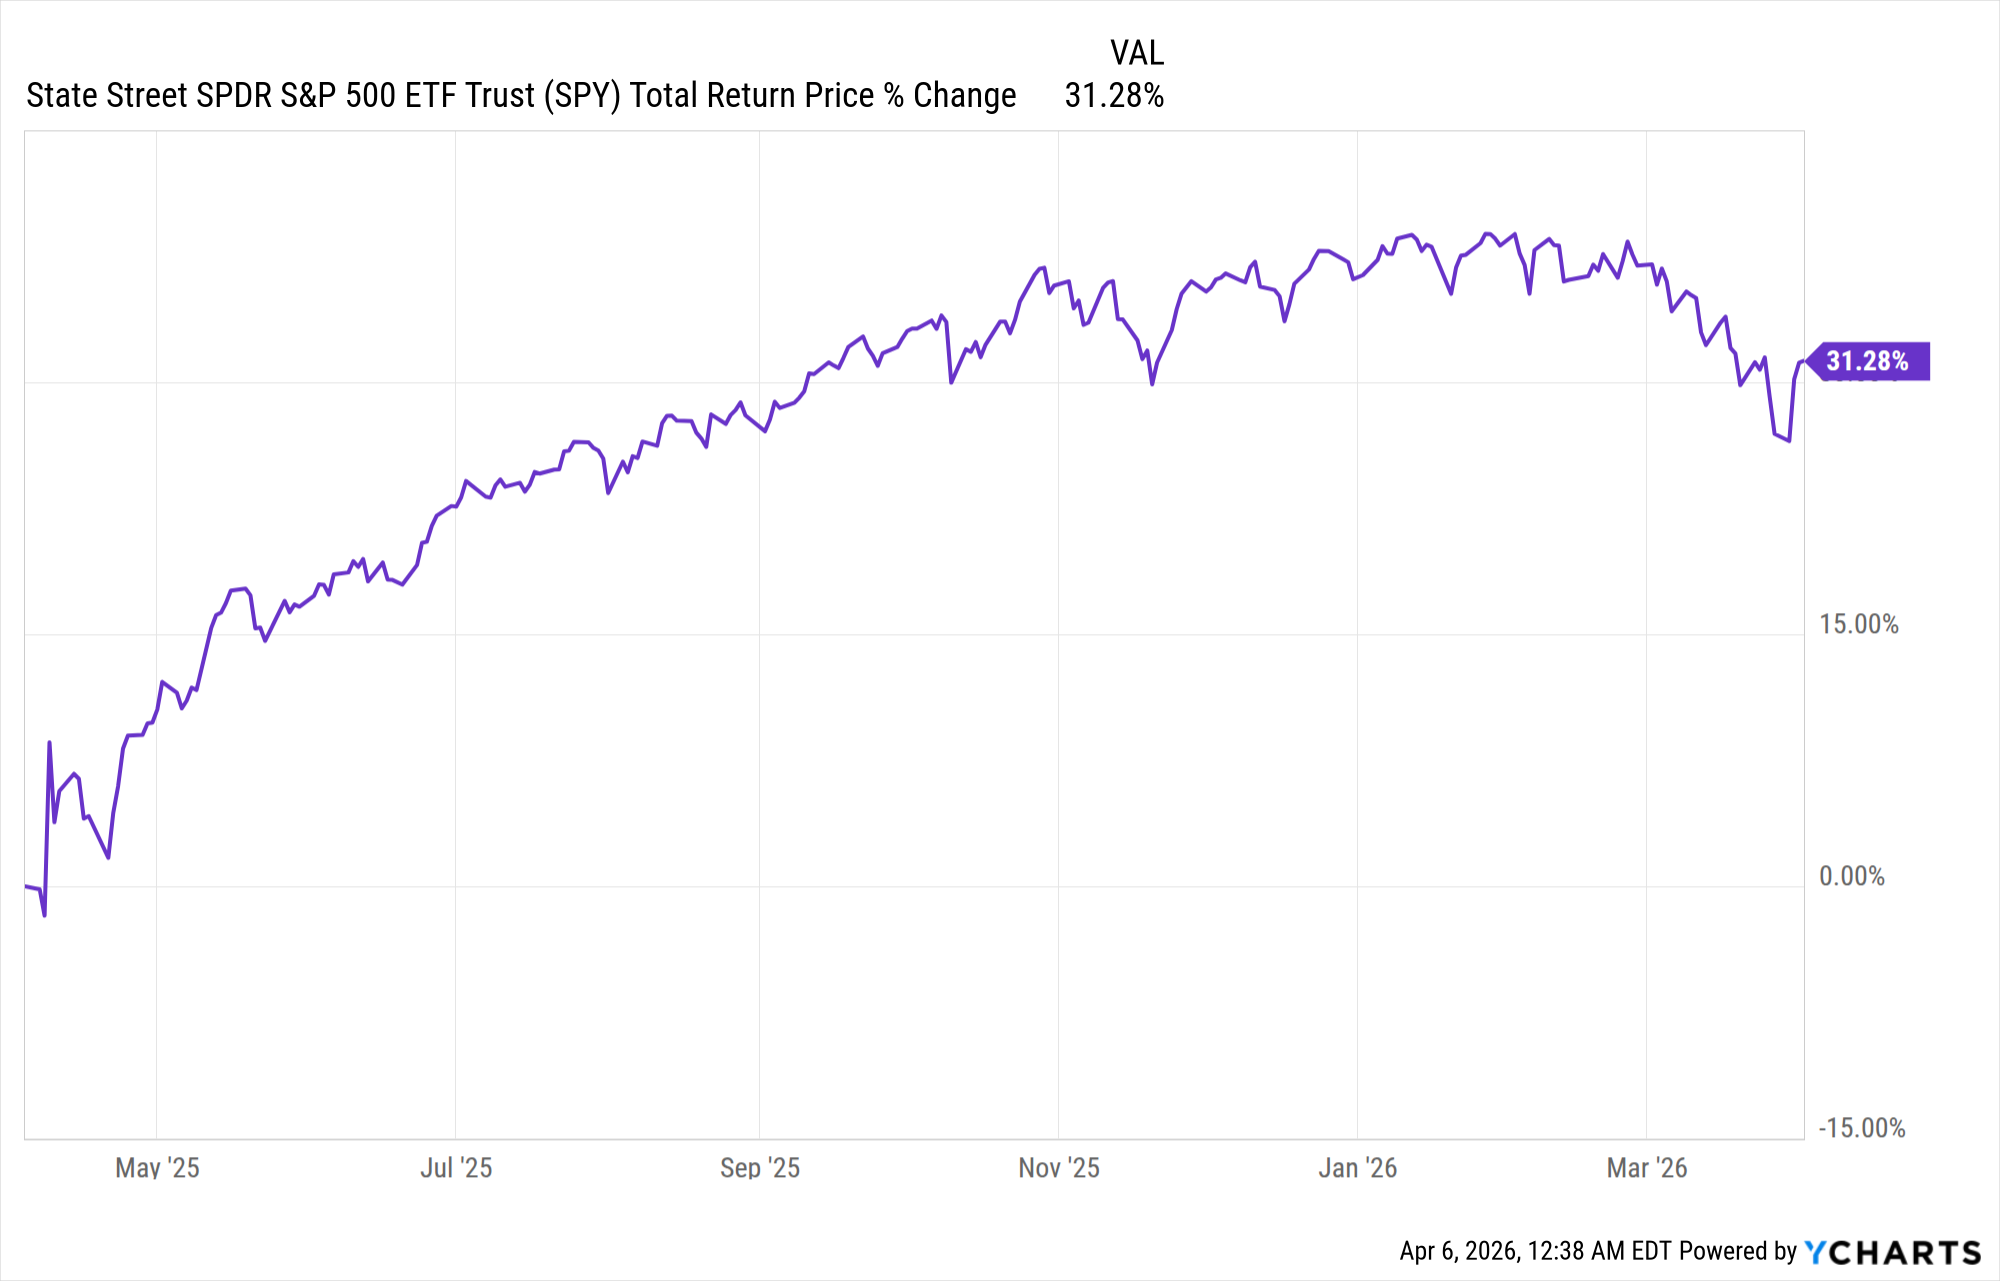
Over the 33 years since SPY’s launch, the ETF has returned 10.4% yearly, on average. The interesting thing is, even with the index’s meager yield, reinvesting payouts makes a big difference over a timeframe like that. An investor who withdrew their dividends would’ve brought in just 8.5% annualized.
When Trend-Following Fails
I bring all of this up now because anyone buying stocks or CEFs these days might not feel like the trend is all that friendly. The market has, after all, fallen in 2026, while being whipsawed by up-and-down headlines out of the Middle East.
But it’s important not to succumb to short-term worry, because the best move in times of crisis is often to buy. Or if you’re not comfortable doing that, then, as I said off the top, doing nothing is a strong play, too.
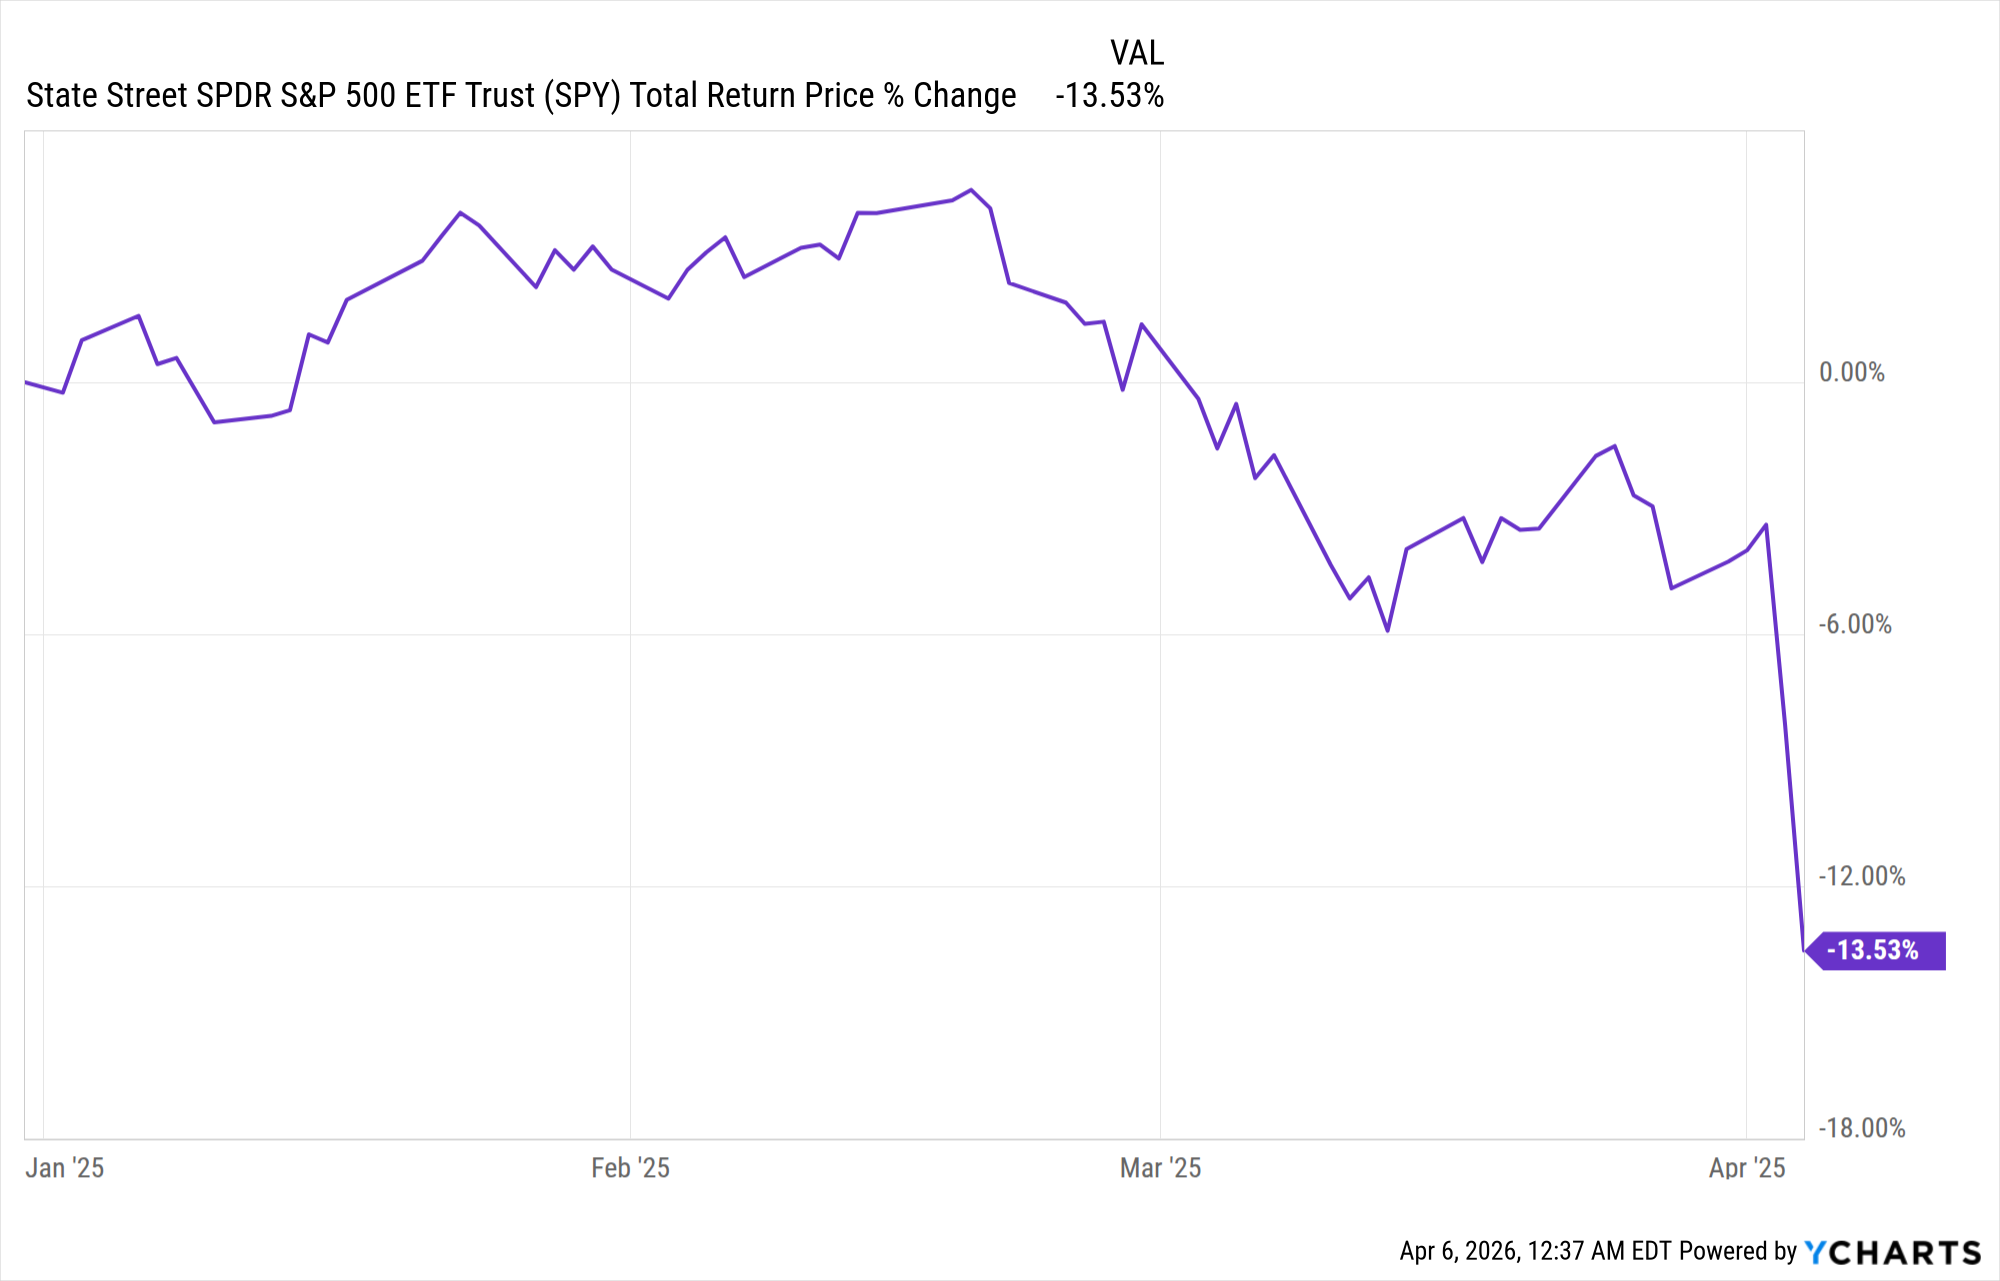
Last Year’s Paranoia Was Worse …
We need only to look back a year to see the wisdom here. At this time last year, stocks were deep into a correction and flirting with a bear market.
Back then, the panic was mostly driven by President Trump’s tariff announcement. That situation, of course, isn’t like today’s problems in the Middle East, but the uncertainty it’s caused feels similar.
… Then This Happened
But as you can see above, anyone who ignored the fear and focused on the long term did very well.
The bottom line? Wall Street’s adage should be adapted to read: “The long-term trend is your friend!” And note that diversification is the key to making the long-term trend your friend, since leaning too hard on one sector often leads to underperformance.
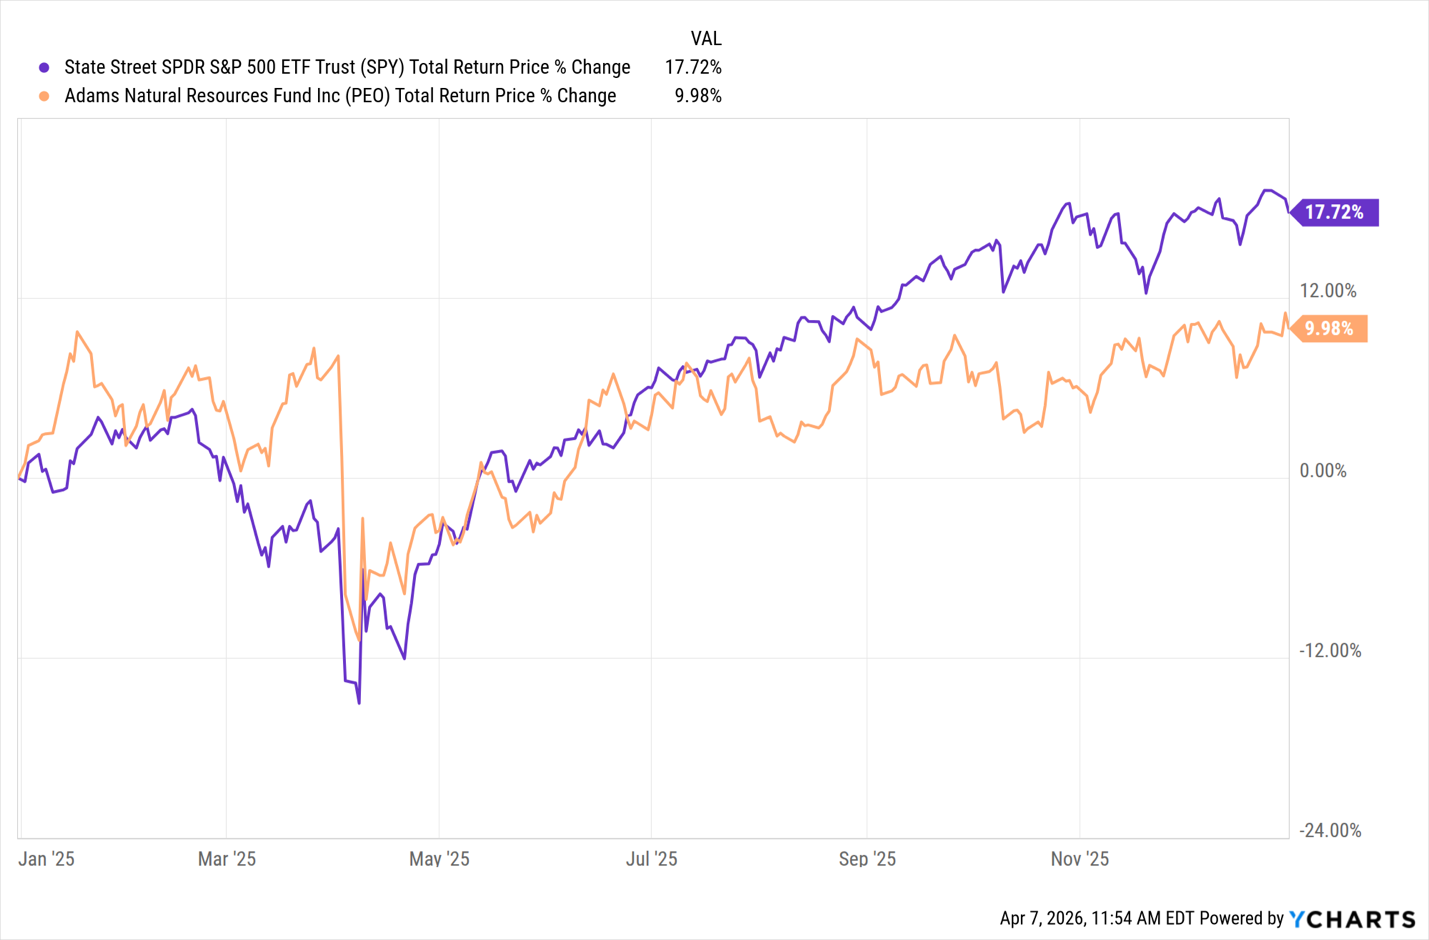
To see what I’m getting at, consider oil, where, yes, there is a CEF play: the Adams Natural Resources Fund (PEO), a well-managed fund that yields 7.3%.
As I write this, PEO is outrunning the S&P 500, as you’d expect in a year heavy with Middle East turmoil. But this is a good example of a place where we don’t want to chase a trend. In last year’s selloff, for example, PEO didn’t fall as far as the market, and it bounced back from that episode faster than stocks in general.
But by the end of the year, PEO had underperformed the market by nearly half!
Oil—and PEO—Are Not Places to Blindly Follow the Long-Term Trend
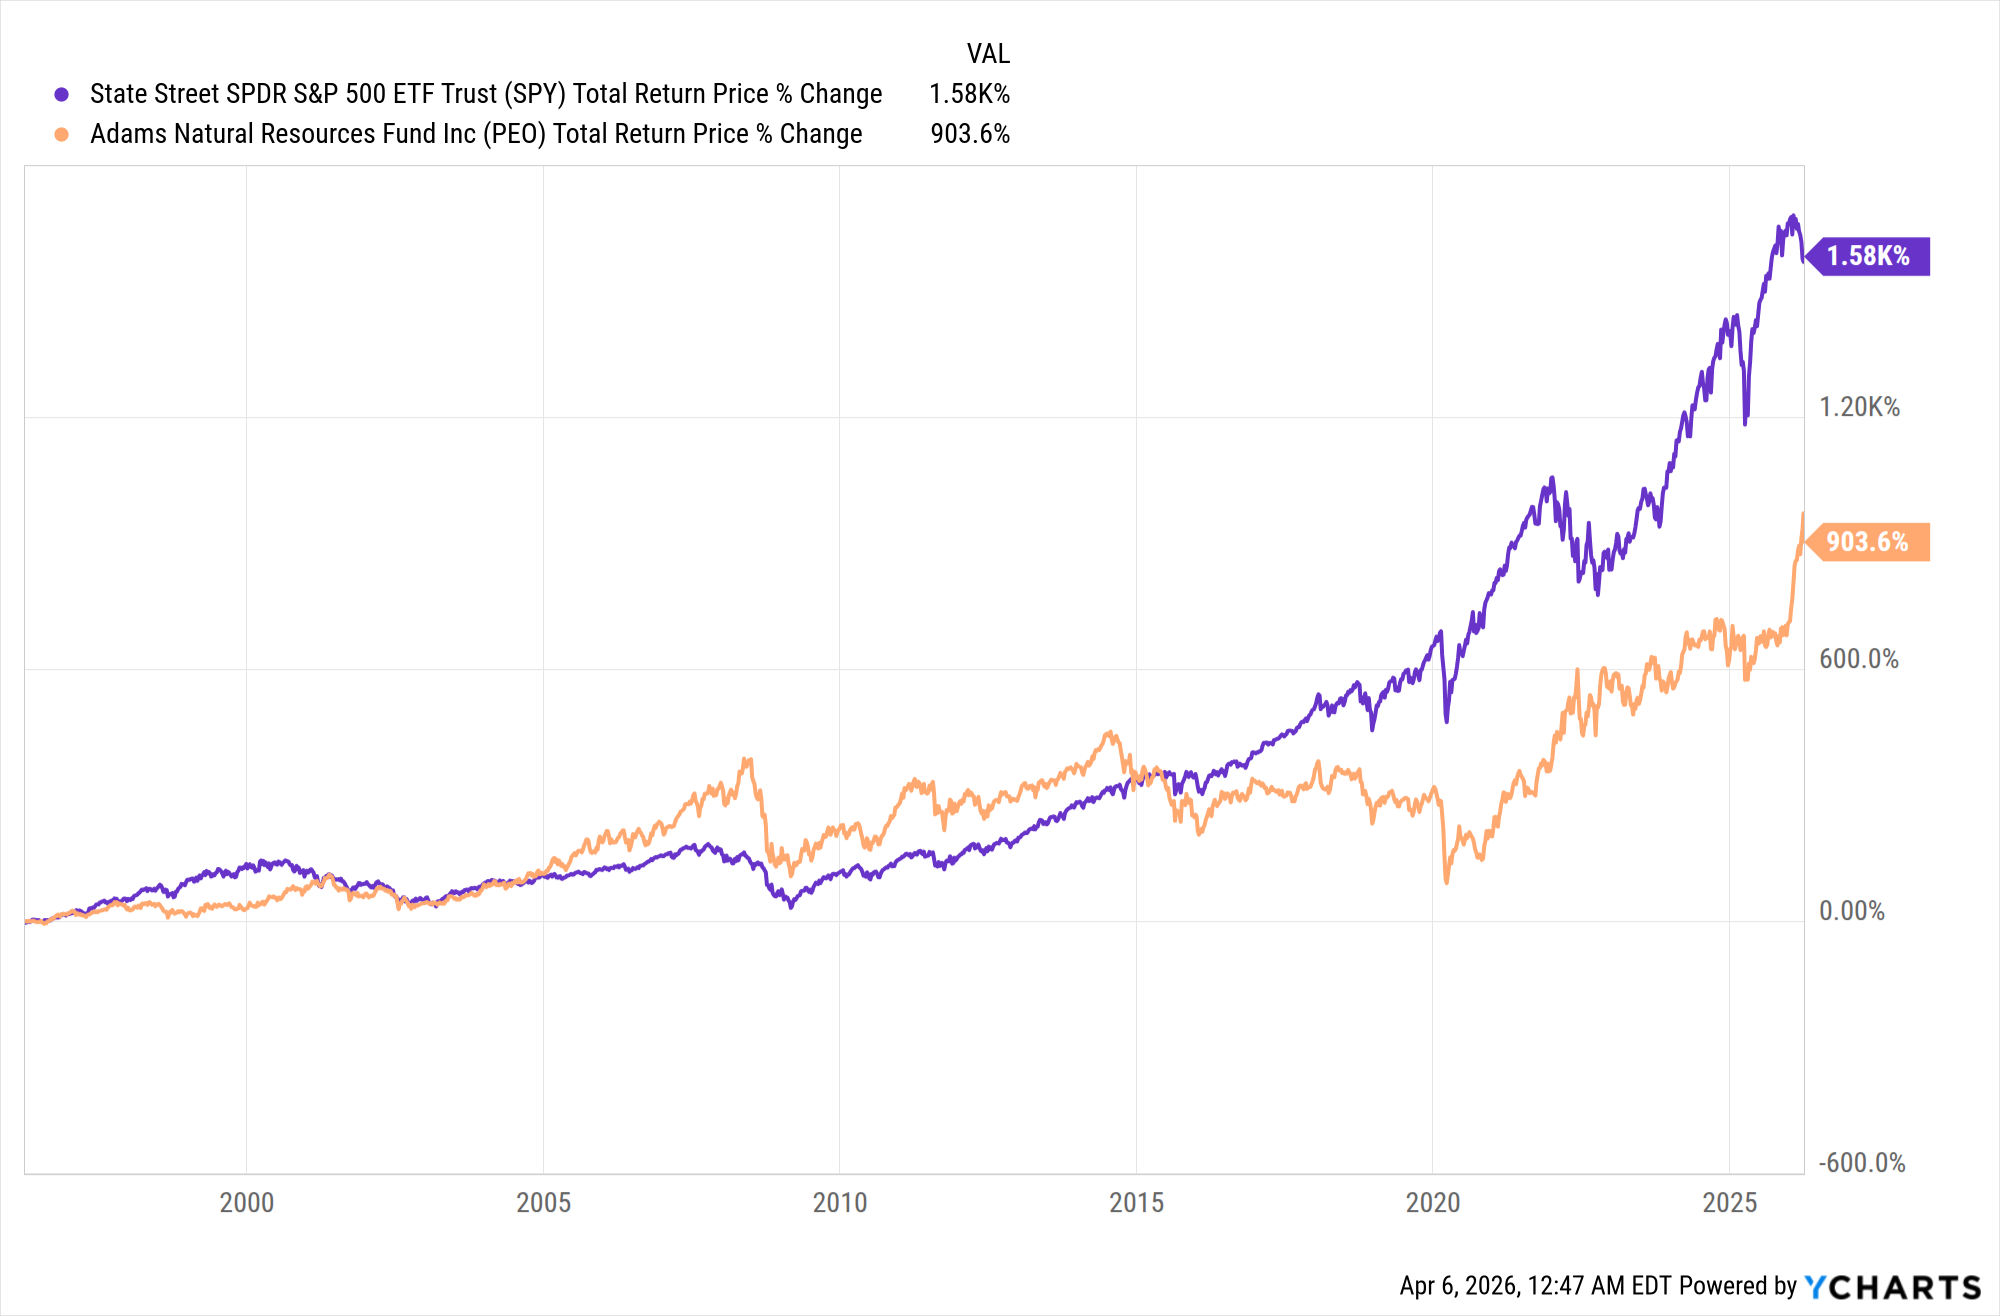
And indeed, while oil investments like PEO can outperform in the short term and do tend to rise over time, they lag the market in the long haul—with more volatility, too.
Long-Term Thinking Falls Short With Oil
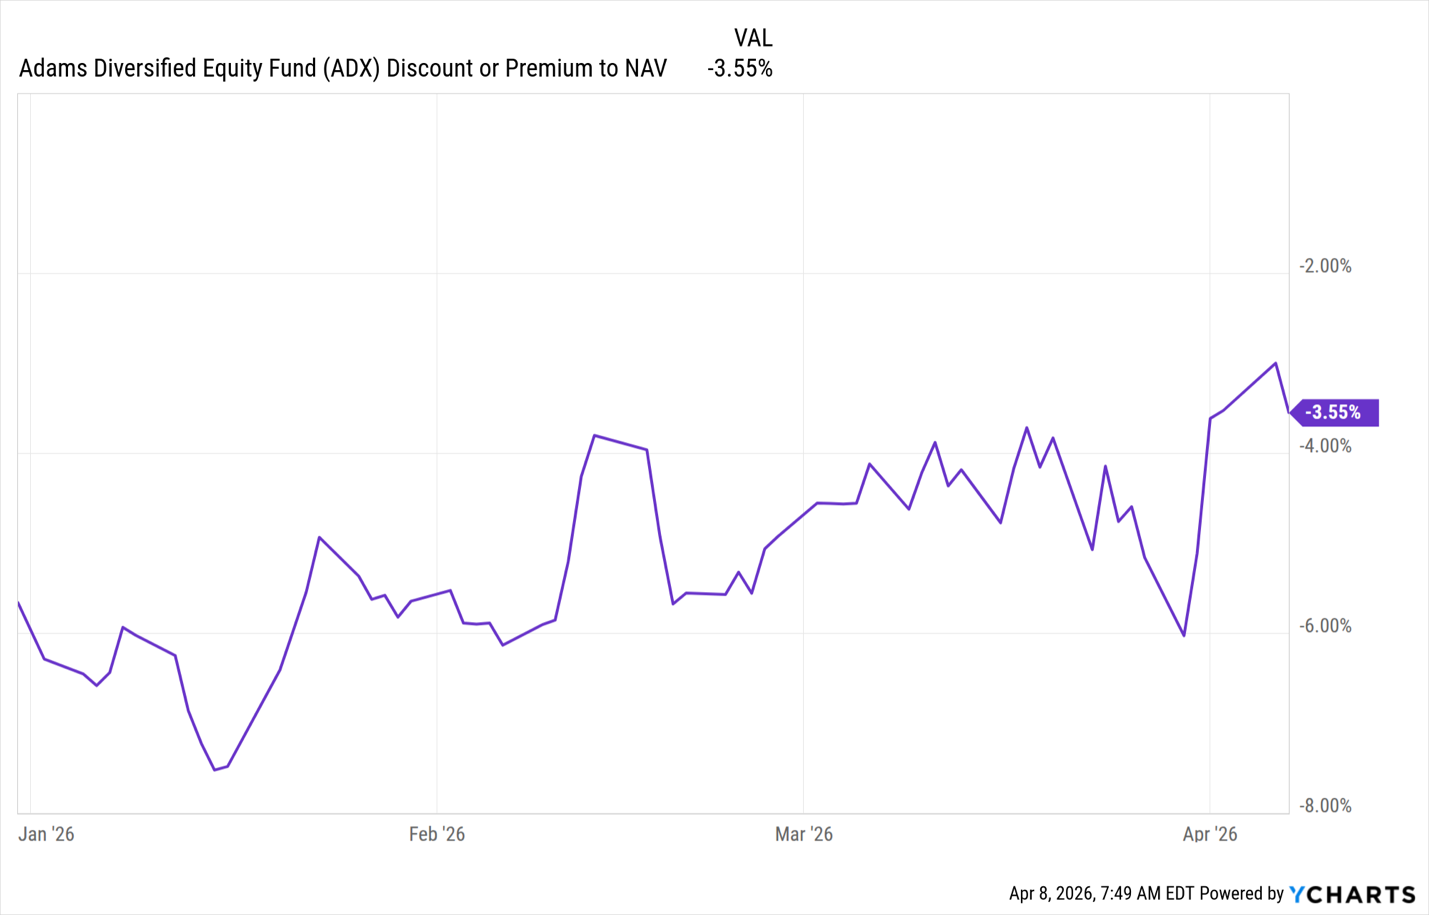
This brings us back to ADX, whose discount to NAV, currently 3.6%, is headed toward premium territory.
ADX’s Discount Moves Toward Par (and Likely Beyond)
This is often a good time to buy—when a CEF remains discounted, but that discount has settled into a narrowing trend. Right now, the fund trades right around my buy-up-to price of $23. My suggestion? Put it on your list to snap up on any major moves below that level.
Sell Into Strength? Absolutely. 2 Dividends to Sell Now (and 2 to Buy)
Brett Owens, Chief Investment Strategist Updated: April 14, 2026
This market bounce is giving us a rare window to sell our laggards—and snap up stocks that have been unfairly left behind.
When we dump losers, we want do it into strength. And on the flipside, bounces like this often leave strong bargains in their wake.
Let’s start our “rebound rotation” with two blue-chip laggards lots of people own. Then we’ll pivot to two holdings of my Hidden Yields service that are smart, contrarian places to put cash now.
GIS Is a Prime GLP-1 Target
General Mills (GIS) draws a lot of revenue from snacks people eat routinely (and often without thinking much about it), like Bugles, Dunkaroo cookies and high-sugar cereals like Cocoa Puffs, Cinnamon Toast Crunch and Cookie Crisp.
Unfortunately, those products put the company in the tracks of rising GLP-1 use; these drugs suppress appetites for just these kinds of products. Everyone knows more people are taking these drugs, but when you look more closely, the numbers are stunning.
On April 8, for example, Morgan Stanley Research released a new forecast stating that 55 million Americans will be on GLP-1s by 2035, up from its original forecast of 35 million. This is no fad—it’s a permanent shift in food consumption.
General Mills is pivoting in response, including adding premium snacks (which consumers, including GLP-1 users, will likely keep buying—see my take on Hershey below) and smaller packages aimed at dieters. But it’s far from clear that these moves will be enough.
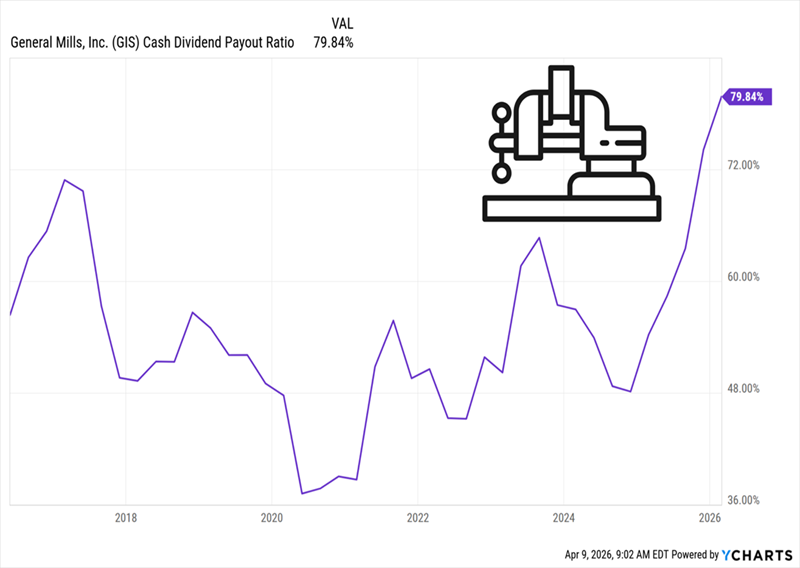
Meantime, GIS is the definition of a yield trap, with a 6.7% dividend. Too bad that payout has consumed a high 80%—and rising—of the company’s free cash flow in the last year.
Rising Payout Squeezes GIS’s Dividend
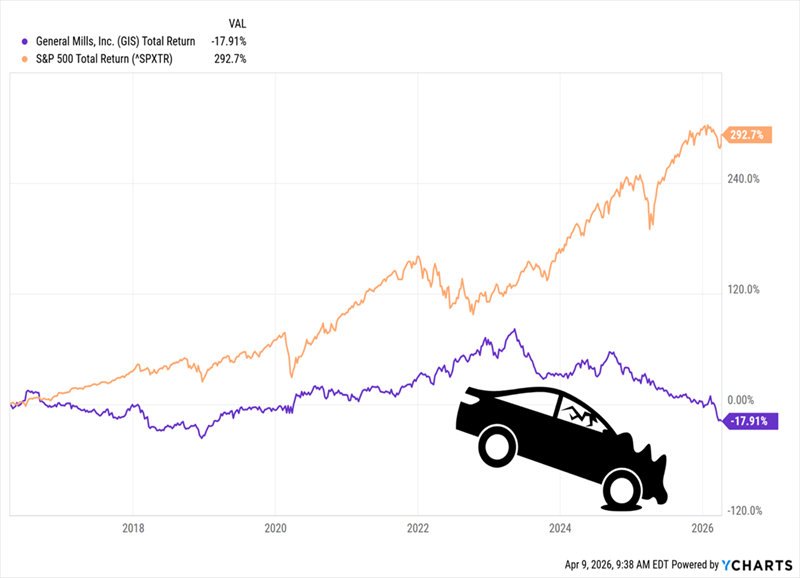
Plenty of investors see GIS as a “safe” stock because its products are considered essential, but that idea just doesn’t hold up: Over the last 10 years, the stock has returned negative 18%, while the S&P 500 has soared nearly 300%:
“Safe” Stock? No Way
Don’t buy the turnaround story here. GIS has a long way to go before it delivers positive returns. And if history is any indication, the stock may never get there—especially with the speed at which the healthier-eating trend is moving.
Coke Looks Like “Dead Money” (at Best) in 2026
Next up, the Coca-Cola Company (KO), which faces similar problems as GIS. To be fair, Coke is in a better spot because it has plenty of low- (or no-) calorie drinks to push, such as Coke Zero, Dasani bottled water and various coffees and teas. But the shift toward healthier eating is still a headwind.
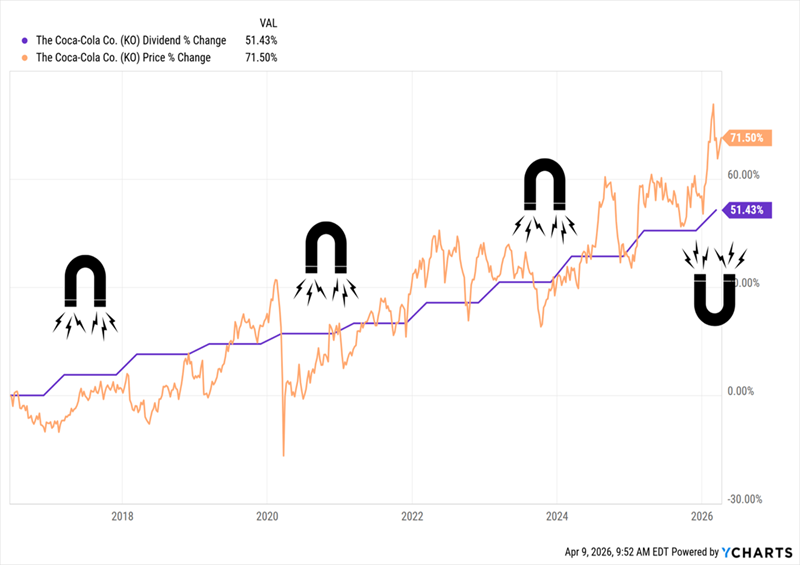
Meantime, Coke’s lame dividend growth—typically just a penny or two a year—isn’t enough to get our hearts racing, especially with the stock yielding just 2.7%. But despite all that, investors still cling to Coke as a “safety” stock. That’s why they’ve bid its shares well above its sluggish payout growth.
KO Gets Out Over Its Skis
If you’ve been reading me for a while, you know I preach the power of buying fast-growing dividends, because they pull the stock up with them—a phenomenon I call the Dividend Magnet. But the magnet can work both ways, pulling down a stock that’s gotten too far ahead. That’s the risk here.
With that said, let’s pivot to two “essentials” stocks I recommend now, starting with another food maker investors regularly (especially these days) get the wrong idea about.
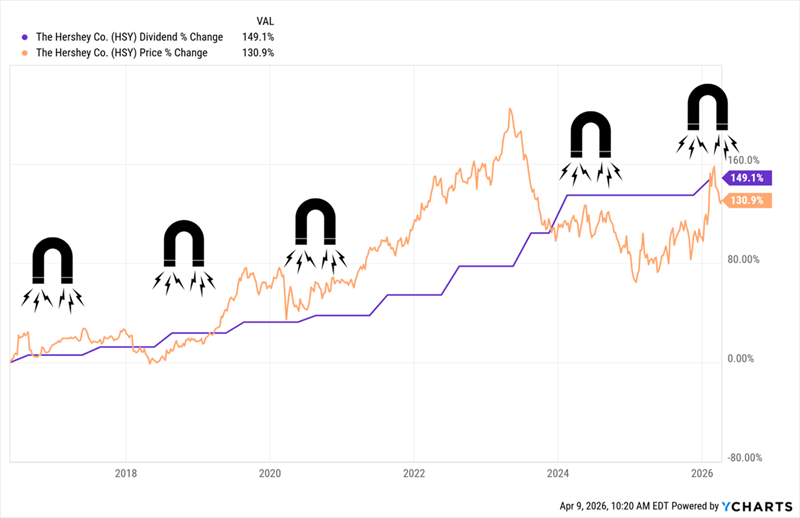
Hershey: A Contrarian Play On Healthier Eating
I’m talking about the Hershey Co. (HSY). I know: You’re wondering how I could recommend a maker of chocolates given what we’ve just discussed. Hear me out.
For one, there’s evidence that GLP-1s are less of a problem for chocolate makers. New research from Lindt & Sprüngli, for example, found that among GLP-1 users, sales of chocolate actually rose nearly 17% in 2025. The findings were based on an internal study of the company’s sales by market-research firm Circana.
Wait, what?
When you think about it, it makes sense, because it suggests these folks are ditching “repetitive” snacks like chips, salted peanuts and the like for small indulgences, like chocolate. This rhymes with why we like Hershey in the first place: People are likely to keep buying small treats, even in a slow (and inflation-weary) economy.
That’s backed up by Hershey’s sales growth, which is ticking right along, rising 4.4% in 2025 and forecast to grow 4% to 5% this year.
Meantime, Hershey expects strong earnings growth as it recovers from a cocoa-price spike in 2024. That’s breathing new life into the dividend, which was hiked 6% last year after holding flat for a short time. That, in turn, adds more “pull” on the stock, which is trailing its payout as we speak:
HSY’s Dividend Magnet Is Tuned
Hidden Yields members who bought HSY on my February 2025 buy call are up 24.7% as I write this. But it’s not too late. Thanks to the above “dividend lag,” more growth is on the table here.
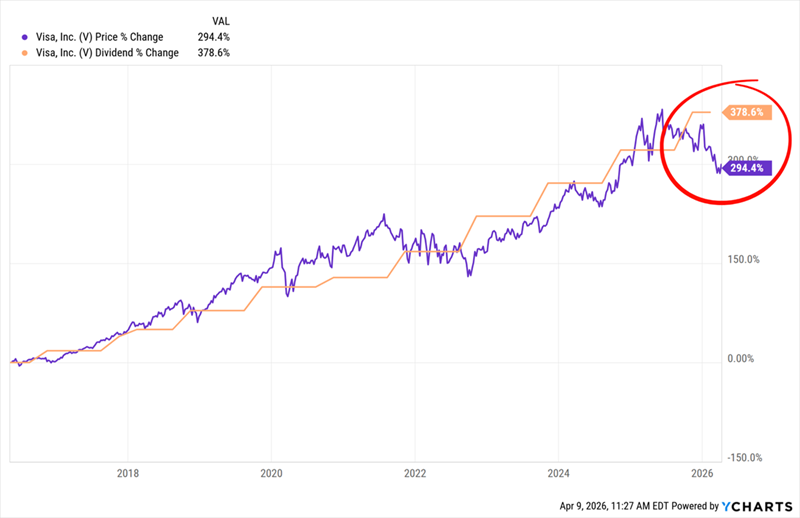
Beyond Food: Visa Is Our Favorite “Tollbooth”
Not many people see Visa (V) as an “essentials” stock, but it is.
Visa controls a large slice of the global payments network, collecting a “toll” on every purchase—from the discretionary to the necessary—that rolls through it.
Management isn’t just sitting back, though: It’s looking ahead, making sure it doesn’t get left behind in digital currency, particularly the rising use of “stablecoins.” These digital “coins” are far from the crypto wild west we’ve heard about these last couple of years; they’re tied one-for-one to the US dollar. Their main use these days is for cross-border transactions, as they can be processed without being converted to local currency. Visa already allows stablecoin settlement on its network.
Meantime, in the here and now, US consumer spending continues to hold up, rising 0.5% in February, ahead of its 0.3% rise in January.
Even so, Visa has pulled back 11.7% this year—a clear mismatch for a company that saw revenue and adjusted EPS each jump 15% in its fiscal 2026 first quarter. That’s opened a wide gap—and another buy window—between Visa’s dividend and its share price:
Visa Is Unloved—in More Ways Than One
Visa yields just 0.7% today, but don’t let that put you off—with the 379% payout growth you see above, it would be paying 3.4% on a buy made 10 years ago. That’s nearly 5X the current yield and is in addition to the 294% price gain.
As you can also see, buyers have profited off every dip in the chart above. There’s no reason for this time to be any different.
That last point, in fact, nicely sums up our strategy: Sell laggards into strength, then buy strong stocks the market has left behind. And that’s exactly what we’re doing with these four tickers.
These 5 “Dividend Magnet” Plays Could Be Our Next 148% Winners
When it comes to the Dividend Magnet, we want to buy at the point where the stock has fallen way behind its dividend growth.
That way, when it snaps back, we get maximum upside. That pattern is obvious in the cases of Hershey and Visa.
Nothing in Contrarian Outlook is intended to be investment advice, nor does it represent the opinion of, counsel from, or recommendations by BNK Invest Inc. or any of its affiliates, subsidiaries or partners. None of the information contained herein constitutes a recommendation that any particular security, portfolio, transaction, or investment strategy is suitable for any specific person. All viewers agree that under no circumstances will BNK Invest, Inc,. its subsidiaries, partners, officers, employees, affiliates, or agents be held liable for any loss or damage caused by your reliance on any information.
The new tax year is upon us, meaning many investors will have a lump sum to add to their stocks-and-shares Isas – at what is a scary time to go about allocating capital. Recent levels of uncertainty would give pause even to the most veteran of investors.
As a general principle, the right thing to do is stay the course. Review your strategy and portfolio, and as long as they are still right for your goals and time horizon, it’s business as usual. If you are feeling worried about investing a lump sum in one go, you can always drip-feed the money into the market over a few weeks or months.
Still, you might be pondering which types of equity funds are likely to fare best over the next few months if the Middle East ceasefire doesn’t hold, or if volatility returns in another form.
Investors’ Chronicle
A quality resurgence
The theory goes that the most defensive equity sectors comprise companies selling essential goods and services. Broadly, this applies to the likes of consumer staples, healthcare and utilities.
In reality it’s a little more complicated. For example, within healthcare, there are also a number of growth-focused biotech companies that are actually quite racy, while the big pharmaceutical companies make up the more defensive side of the sector. But the idea is that defensive companies’ earnings should prove resilient even during an economic downturn.
Looking for global equity funds with above-average exposure to these sectors will usually lead you to managers deploying a ‘quality’ strategy. The most famous example, Terry Smith’s Fundsmith Equity (GB00B41YBW71), currently has more than half of its portfolio between healthcare and consumer staples, with Unilever (ULVR) as one of its top holdings.
Quality as a style does have a defensive tilt, at least in theory, given it looks for resilient, cash-generative companies with solid balance sheets. But the style has been out of fashion in the past few years and these funds have actually underperformed quite severely, especially in the UK and Europe.
This is partly because valuations had grown pretty demanding, and partly due to sector-specific or company-specific issues, such as the struggles seen at weight-loss drug provider Novo Nordisk (DK:NOVO.B). Arguably, it is also partly because, despite the various geopolitical crises of the past few years, markets remained fairly ‘risk on’ throughout, never really going into defensive mode for prolonged periods of time.
If the war in Iran continues, leading to higher inflation and economic stagnation, will that give quality companies a fresh boost? It could, but with interest rates likely to stay higher for longer, valuations remain a crucial consideration.
As at the end of 2025, Morningstar estimates that Fundsmith’s portfolio was still trading on a price/earnings (PE) ratio of 24. This will be lower now – the fund has shed about a tenth of its value year to date – but is still not exactly cheap. Some quality companies are starting to look less pricey, however. Unilever, for instance, was trading on a multiple of about 16 at the time of writing, although again this is partly for stock-specific reasons: investors are worried about how energy shocks will affect both its costs and its emerging market customers, and unsure about the planned spin-off of its food business.
The chart below shows how, with value stocks outperforming and quality struggling, the valuation gap between some high-profile value and quality funds is closing somewhat.
Still, a focus on valuations should continue to favour value companies overall. These have been outperforming over the past couple of years, particularly in Europe and the UK. Typical ‘value’ territory usually means a PE ratio no higher than the low teens.
Rob Morgan, chief investment analyst at Charles Stanley, argues: “Regions, sectors and styles that are priced for perfection are more vulnerable, while areas trading on reasonable multiples with solid cash generation offer a better margin of safety. This rewards patience in unloved but fundamentally sound areas.”
Jason Hollands, managing director of Bestinvest, thinks we are entering a period of ‘warflation’ rather than stagflation for the US economy – a temporary rather than permanent energy supply shock, which may not seriously impact the economy or companies, whose earnings expectations and balance sheets still look reasonably resilient. “That said, risks are building: higher energy costs, tighter financial conditions and rising bond yields all increase the probability of slower growth and potential earnings downgrades if the situation persists,” he adds.
Assuming a period of higher energy prices and lower global growth, “the balance of probabilities would favour more value-oriented investment strategies”, he says.
The funds to buy
Experts emphasise the importance of diversification in the current environment. The war could end this month or persist for some time longer yet, so we just don’t know what is going to work. Blending different styles and asset classes is a good starting point.
If you do want to give quality a go but look beyond the usual suspects of Terry Smith and Nick Train, Ben Yearsley, investment director at Fairview Investing, suggests Trojan Global Income (GB00BD82KP33). The fund invests in quality companies “purchased at attractive valuations and held for the long term”. As at the end of February, a third of the fund was in consumer staples, and another 11 per cent in healthcare. It was fairly concentrated, with just 32 stocks, and the top holdings were American derivatives exchange company CME Group (US:CME) and British American Tobacco (BATS).
For value, Hollands suggests the Xtrackers MSCI World Value ETF (XDEV), Murray International (MYI) and Ranmore Global Equity (IE00B61ZVB30). The latter was recently profiled on the IC (‘My favourite holding period is a day’). First, keep in mind that even with trackers, you do still need to take a look at what’s inside; this one still has significant exposure to the US, even if this weighting is less than the broad stock market (42 per cent).
This exposure may not be the worst thing in the world considering value stocks in the US have not rallied as enthusiastically as their European counterparts in the past year or so. Still, the ETF also has a lot in the tech sector (28 per cent), and its biggest holding is semiconductor company Micron Technologies (US:MU), whose share price has increased more than fivefold in the past year.
Meanwhile, Morgan argues for a combination of value and growth strategies. “Higher interest rates raise the cost of capital, so companies with low debt, strong free cash flow, and resilience across the cycle are likely to outperform the highly leveraged, except in the cases of very strong structural growth stories where the debt load melts away,” he says. “It’s therefore a bit of a ‘barbell’ situation for investors.”
He favours a “core of resilient compounders”, provided by value-tilted funds with a focus on earnings growth such as M&G Global Dividend (GB00B39R2Q25) and Artemis Global Income (GB00B5ZX1M70), combined with “a collection of unique growth situations”, such as the companies targeted by Scottish Mortgage (SMT).
For defensive exposure, you could also consider a sector-specific fund, although of course this is a more targeted option, not a core global equity holding. Yearsley suggests taking a look at the listed infrastructure sector, where his fund of choice is First Sentier Global Listed Infrastructure (GB00B24HJL45); Morgan likes FTF ClearBridge Global Infrastructure Income (GB00BMF7D662).
Baillie Gifford Shin Nippon PLC ex-dividend date BlackRock Latin American Investment Trust PLC ex-dividend date JPMorgan American Investment Trust PLC ex-dividend date JPMorgan Asia Growth & Income PLC ex-dividend date JPMorgan European Growth & Income PLC ex-dividend date Merchants Trust PLC ex-dividend date Montanaro UK Smaller Cos Investment Trust PLC ex-dividend date Unite Group PLC ex-dividend date