Investment Trust Dividends
The latest answer to wide discounts raises questions of its own.
16th February 2026
by Dave Baxter from interactive investor
Investment trust boards keen to vanquish a share price discount (or a pesky activist) have tried plenty of measures in recent years, and not always with great success.
This might explain why a more drastic gambit is gaining in popularity: ceasing to be an investment trust altogether.
Smithson Investment Trust Ord SSON
shareholders last week backed proposals to morph the trust into an open-ended fund, and seemingly with good reason.
The move, which follows a similar shift by Middlefield Canadian Income last year, converts it to a vehicle that trades at net asset value (NAV), eliminating the discount in one fell swoop and giving investors an uplift.
With discounts widespread and Saba Capital continuing to frighten boards, there could be more to come.
Two trusts, the UK multi-cap income fund Diverse Income Trust Ord DIVIand Alexander Darwall vehicle European Opportunities Trust EOTfloated the idea of such action at the end of last week (13 February) alone.
But if this is one way to slay a discount, investors should remember that there is still a trade-off. In the worst instances, making the switch could wipe out some of the traits that justified a trust’s place in your portfolio.
We’ve previously observed that the Smithson conversion doesn’t seem to sacrifice too much in terms of characteristics associated with the trust structure.
The team didn’t use gearing to attempt to juice returns and the portfolio itself seemed pretty liquid, meaning the closed-ended structure isn’t needed to house the assets.
With its global “smaller company” remit, the median market capitalisation for a holding in the fund still comes to a whopping £6.1 billion.
Meanwhile, the fund doesn’t have really big position sizes, an area where trusts can be flexible but most open-ended funds cannot.
Turning to last week’s two candidates, it doesn’t seem that the Diverse Income trust would have that big a shift either.
The trust doesn’t use gearing, has small position sizes and already has substantial overlap with the open-ended fund run by the same team, Premier Miton UK Multi Cap Income B Inc.
As the table shows, there’s only a slim difference between the two when it comes to performance. They also have very similar dividend yields.
| Not so different after all? | |||
| Fund | One-year total return (%) | Five-year | 10-year |
| Diverse Income | 28.6 | 37.9 | 97.9 |
| Premier Miton UK Multi Cap Income | 27.9 | 34.7 | 98.3 |
Source: FE Analytics, 13/02/2026. Past performance is not a guide to future performance.
It’s perhaps a good rule of thumb that a trust could feasibly make the switch, were it to already operate in a similar manner to an open-ended fund.
That means investing in relatively liquid shares, not using gearing and not having enormous position sizes. But let’s not assume this silver bullet will apply in all cases.
Trade-offs still exist. With the Diverse Income example, it’s worth noting that as an open-ended fund it would have to pay out all dividends it received each year, rather than being able to hold some back and build a “reserve” if needed in leaner years.
This can help trusts protect their payouts in periods of dividend cuts and keep upping the amount they distribute to shareholders over the years.
In this case, Association of Investment Company (AIC) data shows that Diverse Income has grown its dividend by an average of 4% annually over five years. It is a “next generation dividend hero”, having raised payouts for 13 consecutive years.
In Diverse Income’s annual report last year (to 31 May 2025) the board acknowledged the structural advantage of the revenue reserves.
As it put it: “In 2020-21, when many portfolio companies cut their dividends as a result of the pandemic leading to a decline in the trust’s annual revenue, this temporary setback was countered by drawing upon reserves built up in prior years, enabling the trust to continue to pay increased dividends. Since that date, the trust’s revenue has fully recovered, and its annual revenue and dividends have continued to grow.”
The drawbacks of a switch are, of course, more obvious when trusts make good use of their structural traits in the first place.
This definitely applies to European Opportunities: it makes generous use of gearing, recently accounting for 15% of NAV, and would lose this opportunity to amplify returns in an open-ended vehicle.
The fund is also well known for its big bets, with the top holding having at times accounted for 15% (or more) of the portfolio.
This has admittedly been a double-edged sword: Darwall’s two massive holdings of recent years eventually turned disastrous, in the form of Novo Nordisk AS Class B NOV
and, even worse, German payments processor Wirecard, which collapsed in 2020 amid fraud allegations.
But investors may well still back a manager who can show such conviction.
Diverse Income is not alone in having an open-ended “sibling”.
Multiple trusts, including Baillie Gifford names such as Scottish MortgageOrd SMT
Baillie Gifford US Growth Ord USA
have open-ended funds run by the same teams.
That’s also the case for wealth preservation trusts like Personal AssetsOrd PNL
UK funds such as Temple Bar Ord TMPL
and Fidelity Special Values Ord FSV, and a smattering of others including Polar Capital Technology Ord PCT.
While some of these “sibling” pairs are pretty similar, the differences can illustrate how jumping from a trust structure to open-ended won’t always be feasible, were the trusts to need such an option one day.
An obvious issue here is the penchant the Baillie Gifford trusts have for private companies, something an open-ended fund would be unable to hold.
But other nuances are at play: Temple Bar managers Ian Lance and Nick Purves cannot make quite such liberal use of overseas shares when investing for the open-ended TM Redwheel UK Eq Inc R Inc, for example.
Some of these issues might simply be marginal for investors. But they do make a difference, and are worth considering before throwing in the towel on investment trust status.


| Company Name | Place change | |
| 1 | Artemis Global Income I Acc | Unchanged |
| 2 | Royal London Short Term Money Mkt Y Acc | Unchanged |
| 3 | Greencoat UK Wind UKW1.79% | Up 4 |
| 4 | Vanguard LifeStrategy 80% Equity A Acc | Up 1 |
| 5 | Vanguard FTSE Global All Cp Idx £ Acc | Up 1 |
| 6 | Artemis SmartGARP European Eq I Acc GBP | New |
| 7 | Scottish Mortgage Ord SMT0.52% | Down 3 |
| 8 | HSBC FTSE All-World Index C Acc | Unchanged |
| 9 | Vanguard LifeStrategy 100% Equity A Acc | New |
| 10 | L&G Global Technology Index I Acc | New |
Investors have continued to throw money into tech-heavy funds in the face of recent wobbles for the sector.
The Magnificent Seven stocks are having a trying start to the year as investors fret about the sheer level of spending now expected on artificial intelligence (AI) ventures. Every single Magnificent Seven member is down year to date as of 13 February, with Microsoft Corp
MSFT shares off by around 17%.
If that has pushed names such as Amazon.com Inc AMZN
and Microsoft into our bestselling shares tables this month, investors also appear to have doubled down on funds with big exposure to such stocks as well as the broader “tech” space.
The L&G Global Technology Index I Acc, which tends to offer more concentrated exposure to the biggest names than other tech funds, re-enters out list, while traditional global passive names Vanguard FTSE Global All Cp Idx £ Acc and HSBC FTSE All-World Index C Acc remain popular, alongside the tech-heavy Scottish Mortgage Ord SMT
This week’s list nevertheless points to plenty of differences of opinion on this front.
It’s hard to ignore the continued presence of the US-light, value-focused Artemis Global Income I Acc at the top of the table, for one, while investors are looking for returns outside the US via its outperforming stablemate Artemis SmartGARP European Eq I Acc GBP.
Meanwhile, the US-light Vanguard LifeStrategy 80% Equity A Acc moves up one to fourth place, while the all-equity version of the same fund returns to the list. And plenty of investors still like a steady option (with plenty of opportunity cost) in the form of Royal London Short Term Money Mkt Y Acc.
continues to draw people in, likely thanks to its high yield and wide share price discount to net asset value (NAV). But it’s notable that software sell-off victim HgCapital Trust Ord HGT0 has disappeared from the list, as have commodity funds such as BlackRock World Mining Trust Ord BRWM
Funds and trusts section written by Dave Baxter, senior fund content specialist at ii.

Even the Ones Who “Did Everything Right”
In this exclusive briefing, you’ll discover:
Dear Reader,
You saved. You invested. You followed the “rules.”
And yet here you are—uneasy.
Wondering if you really can afford to retire. Or stay retired.
And who could blame you?
One minute, inflation’s the threat. The next, it’s recession.
And the broader economy? It’s bloated with debt and only getting worse.
We touch new all-time highs, then the market zigzags like a drunk squirrel—making it feel impossible to plan, let alone sleep at night.
So you start looking for stability. Maybe trim a position here. Tap a bit of principal there. Just for now.
But that’s exactly how it begins.
And once you start selling shares to supplement your income, you’re on a slippery slope.
A slow-motion wealth drain most retirees don’t realize they’re in—until it’s too late.
I call it…
The Share Selling “Death Spiral”
Some financial advisors (who are not retired themselves, by the way) say that you can safely withdraw and spend, say, 4% of your retirement portfolio every year. Or whatever percentage they manipulate their spreadsheet to say.
Problem is, in reality, every few years you’re faced with a chart that looks like this.
Apple’s Dividend Was Fine – Its Stock Wasn’t

As you can see, the dividend (orange line above) is fine — growing, even — but you’re selling at a 25% loss!
In other words, you’re forced to sell more shares to supplement your income when they’re depressed.
Remember the benefits of dollar-cost averaging that built your portfolio? You bought regularly, and were able to buy more shares when prices were low?
In this case, you’re forced to sell more shares when prices are low.
When shares rebound, you need an even bigger gain just to get back to your original value.
The Only Reliable Retirement Solution
Instead of ever selling your stocks, you should instead make sure you live on dividends alone so that you never have to touch your capital.
This is easier said than done, and obviously the more money you have, the better off you are. But with yields still pretty low, even rich folks are having a tough time living off of interest today.
And you can actually live better than they can off of a (much) more modest nest egg if you know where to look for lesser-known, meaningful and secure yield.
I’m talking about annual income of 8%, 9% or even 10%+ so that you’re banking $50,000 (and potentially more) each year for every $500,000 you invest.
You and I both know an income stream like that is a very nice head start to a well-funded retirement.
And it’s totally scalable: Got more? Great!
We’ll keep building up your income stream, right along with your additional capital.
And you’ll never have to touch your nest egg capital – which means you won’t have to worry about or running out of money in retirement, or even the day-to-day ups and downs of the stock market.
The only thing you need to concern yourself with is the security of your dividends.
As long as your payouts are safe, who cares if your stock prices swing up or down on a given day?
Most investors know this is the right approach to retirement.
Problem is, they don’t know how to find 8%, and 10% yields to fund their lives.
And when they do find high yields, they’re not sure if these payouts are safe. Will the company or fund have enough cash flow to pay the dividends into the future?
And how sensitive are these payouts to the latest headline, Fed policy change or unrest on the other side of the globe?
We’ll talk specific stocks, funds and yields in a moment.
But first, a bit about myself.
 My name is Brett Owens. I first started trading stocks in college, between classes at Cornell.
I graduated cum laude with an industrial engineering degree — which is actually pretty popular with Wall Street recruiters.
But I couldn’t stand the thought of grinding it out in a cubicle for 80 hours a week. So I moved to San Francisco and got into the tech scene.
A buddy and I started up two software companies that serve more than 26,000 business users.
The result was a nice chunk of change coming in … and I had to decide what to do with my money.
I had seen plenty of young “techies” come into sudden cash and burn through their windfall in a year, ending up right back where they started.
That was NOT going to be me. I already had dreams of living off my wealth one day, decades before I retired.
I got plenty of cold calls from brokers wanting to “help” me. But I knew that nobody would care as much about my money as me.
So I went out on my own and invested my startup profits in dividend-paying stocks.
I’ve been hunting down safe, stable and generous yields ever since, growing my wealth with vehicles paying me 8%, 9%, even 10%+ dividends.
Over the past 10+ years, I’ve been writing about the methods I use to generate these high levels of income.
Today I serve as chief investment strategist for Contrarian Income Report — a publication that uncovers secure, high-yielding investments for thousands of investors.
Since inception, my subscribers have enjoyed dividends 5 times (and much more!) the S&P 500 average, plus big annualized gains!
And that brings me to a crucial piece of advice…
The ONE Thing You Must Remember
If I could leave you with just one nugget of investing wisdom today, it would be to NEVER overlook the incredible wealth-building power of dividends.
Few investors realize how important these unglamorous workhorses actually are.
Here’s a perfect example…
If you put $1,000 in the dividend-paying stocks of the S&P 500 back in 1973, you would have had $96,970 by the end of 2024, or 97x your money.
But the same $1,000 in the non-dividend payers would have grown to just $8,990 — 91% less.
That’s why I’m a dividend fan.
The stock market is a fantastic wealth-building machine, but it doesn’t always go straight up!
There have been plenty of 10-year periods where the only money investors made was in dividends.
And that’s what gives us dividend investors such an edge.
When you lock in an 8%+ yield, you’re booking an income stream that’s bigger than the stock market’s long-term average return right off the bat.
Of course you can’t just buy every ticker symbol out there with a flashy yield, or you’ll get burned pretty fast.
So let’s wipe the false promises of mainstream finance from our minds and start thinking the “No Withdrawal” way…
Step 1: Forget “Buy and Hope” Investing
Most half-million-dollar stashes are piled into “America’s ticker” SPY.
The SPDR S&P 500 ETF (SPY) is the most popular symbol in the land. For many 401(K)’s, this is all there is.
And that’s sad for two reasons.
First, SPY yields just 1.1%. That’s $5,500 per year on $500K invested… poverty level stuff.
Second, consider a hypothetical year when, say, SPY fell 20%, not at all out of the question, given the multiyear run stocks have been on. Just from that alone, your $500K would be slashed to $400K.
SPY was down nearly 20% that year. That is no bueno, because that $500K would have been reduced to $400K.
The last thing we want to do is lose the money we’re getting in dividends (or more) to losses in the share price. Which is why we must protect our capital at all costs.
Step 2: Ditch 60/40, Too
The 60/40 portfolio has been exposed as senseless.
Retirees were sold a bill of goods when promised that a 60% slice of stocks and 40% of bonds would somehow be a “safe mix” that would not drop together.
Oops.
Inflation — plus an aggressive Federal Reserve, plus a (thus far) persistently steady economy — drop-kicked equities and fixed income before they went on a serious bull run in 2023, 2024 and into 2025 (with a brief interruption for the April “tariff tantrum.”)
It just goes to show that bonds are not the haven guaranteed by the 60/40 high priests. They could easily plunge just as hard (or harder) than stocks in the next economic crisis.
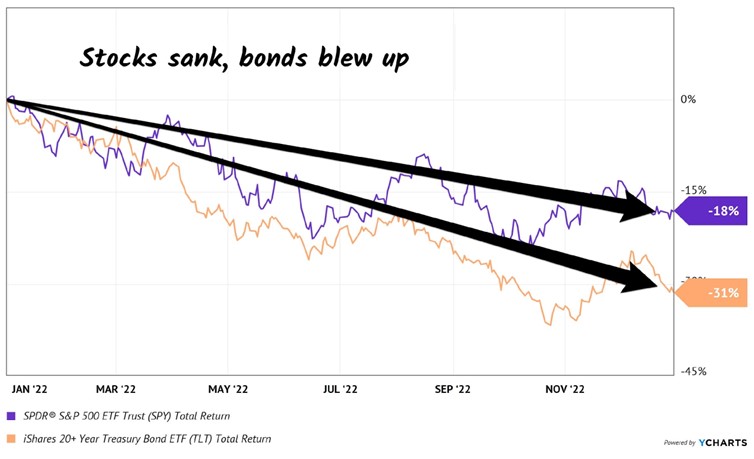
Just like they did in 2022 (sorry, we’re only going to spend one second on that disaster of a year). US Treasuries plunged, which resulted in the iShares 20+ Year Treasury Bond ETF (TLT) getting tagged.
Sure, it still paid its dividend. But even including payouts, the fund was down 31% — worse than the S&P 500. Ouch!
When stocks and bonds are dicey, where do we turn? To a better bet.
A strategy to retire on dividends alone that leaves that beautiful pile of cash untouched.
Step 3: Create a “No Withdrawal” Portfolio
My colleague Tom Jacobs and I literally wrote the book on a dividend-powered retirement.
In How to Retire on Dividends: Earn a Safe 8%, Leave Your Principal Intact, we outline our “no withdrawal” approach to retirement:
To make that nest egg last, and our working life worthwhile, we really need yields in the 7% to 10% range. We typically don’t see these stocks touted on Bloomberg or CNBC, but they are around.
Of course, there are plenty of landmines in the high-yield space. Some of these stocks are cheap for a reason. Which is why we need to be contrarian when looking for income.
We must identify why a yield is incorrectly allowed to be so high. (In other words, we need to figure out why the stock is priced so cheaply!)
As I write, the top 10 payers in my Contrarian Income Report portfolio yield about 11.4% on average.
On every million dollars invested, this dividend collection is spinning off an incredible $114,000 every single year!

And you don’t have to be a millionaire to take advantage of this strategy.
A $750k nest egg would generate $85,500 annually…
$500K could hand you $57,000…

You get the idea.
The important thing is that these yields are safe, which creates stability for the stock (and fund) prices attached to them.
We want our income, with our principal intact.
It’s really the only way to retire comfortably, without having to stare at stock tickers all day, every day.
Now, many blue-chip yields are reliable. They just need to hit the gym and bulk up a bit. Here’s how we take perfectly good, yet modest, dividends and make them into braggarts.
Step 4: Supersize Those Yields
Mastercard (MA) is a near-perfect dividend stock. Its payout is always climbing, having nearly doubled over the last five years. (MA shareholders, you can thank every business that accepts Mastercard for your “pennies on every dollar” rake.)
Tap, tap, tap. Remember cash? Me neither. Another 2020 casualty, with Mastercard making a few dimes or dollars on every plastic transaction.
The cashless trend has been in motion for years. But international growth prospects remain huge. Just a few years ago, 80%+ of transactions in Spain, Italy and even tech-savvy Japan were in cash.
We expect more dividend hikes as more cash turns to plastic. Or skips plastic entirely and goes straight to e-transfers. Mastercard and close cousin Visa (V) nab a nice piece of that action, too.
The only chink in MA’s armor? Everyone knows it is a dynamic dividend stock. So it only yields 0.6%. Investors keep bidding it higher, knowing that the next dividend raise is just around the corner.
So, the compounding of those hikes makes MA a great stock for our kids and grandkids. You and I, however, don’t have the time to wait for 0.6% to grow. And $3,000 on a $500K investment simply won’t get it done.
Let’s instead consider top-notch closed-end fund (CEF) Gabelli Dividend & Income Trust (GDV), managed by legendary value investor Mario Gabelli.
Mastercard is one of Gabelli’s largest holdings. But we income investors would prefer GDV because it boasts a healthy dividend right around 6.4%, paid monthly, nearly 13 times what Mastercard pays (and this is low in CEF-land; other funds, like the next one we’ll talk about, pay nearly double that).

And as I write this, thanks to the conservative folks who buy CEFs, we have a rare opportunity to buy Mario’s portfolio for just 88 cents on the dollar.
Yup, GDV trades at a 12% discount to its net asset value, or NAV. It’s a way to boost MA’s payout and snag a discount, too.
Where does this discount come from?
CEFs are like their mutual fund cousins, with one exception: they have fixed pools of shares, so they can (and do) trade higher and lower than their NAVs, or “fair” values (the value of their holdings minus any debt).

As contrarians, we can step in when they are temporarily out of favor, like after a pullback, when liquidity is low, and buy them at generous discounts.
GDV holds more blue-chip dividend payers alongside MA, such as American Express (AXP), Microsoft (MSFT) and JPMorgan Chase & Co. (JPM). And with GDV, we have an opportunity to purchase them at a 12% discount.
These high-quality stocks wouldn’t normally qualify for our “retire on $500K” portfolio because everyone in the world knows they are strong long-term investments.
Even though these companies are constantly raising their dividends, constant demand for their shares keeps their prices high (and current yields low). So they never meet our current-yield requirement.
GDV does. The fund pays a monthly dividend that adds up to a nice 6.4% annual yield.
Let me give you one more idea (and this is where that much larger payout comes in): the Eaton Vance Tax-Managed Global Diversified Equity (EXG) is another CEF with a similar blue-chip dividend portfolio.
But EXG generates even more income than GDV by selling covered calls on the shares it owns.
More cash flow means a bigger dividend — and EXG pays an already terrific 8.6%!
So we buy and hold EXG and GDV forever, collecting their monthly dividends merrily along the way? Not quite.
In bull markets, these funds are great. But in bear markets, they’ll chew you up.
Step 5: Protect That Principal!
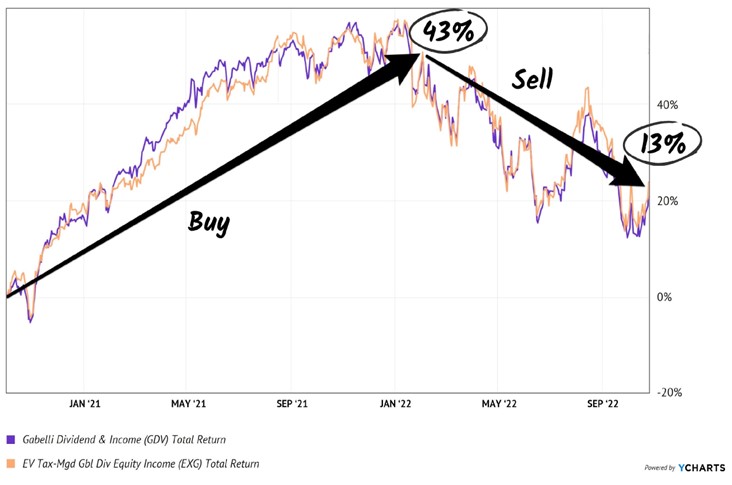
My CIR readers will fondly recall the 15 months we held GDV and EXG together, collecting monthly dividends plus price gains that added up to 43% total returns.
What was happening in that period, from October 2020 until February 2022? The Federal Reserve was printing money like crazy. Not only did the Fed stoke inflation, but we also enjoyed an asset-price lift.
Starting in 2022, we had the opposite situation. The stock market was topping, and we didn’t want to fight the Fed. We sold high, and by late 2022, both funds were down sharply:
We Sold EXG and GDV Just Before They Plunged
For whatever reason, “market timing” is a taboo phrase among long-term investors. That’s a shame because it’s quite important.
By aligning our dividends with the market backdrop, we can protect our principal from bear markets.
Step 6: Start Here to Retire on $500K
So if the “tried and true” money advice — like the 60/40 portfolio and the 4% rule — has been properly exposed as broken…
Where do we go from here?
Well, imagine your portfolio in just a few days or weeks from now spinning off 8%, 9% and even double-digit dividends with the reliability of a Swiss watch… with many of my recommendations paying every single month no less!
No more worrying how much is coming in next month.
No more worrying about the Fed’s next move. Or the next inflation or jobs report.
No more worrying about outliving your nest egg.

Searching for ways to supercharge your dividends ? Royston Wild reckons these high-yield passive income shares are too good to ignore.
Posted by Royston Wild
Published 15 February
For me, the best way to make an abundant passive income is by buying dividend shares. Share prices continue to rally, which means dividend yields are moving in the other direction. Yet there are still stacks of terrific companies with sky-high yields to choose from.
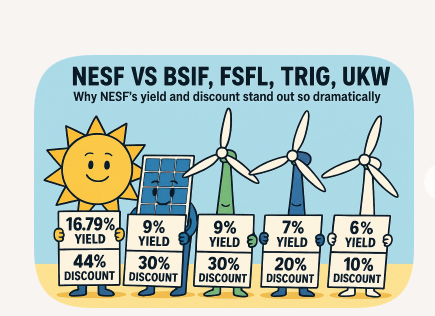
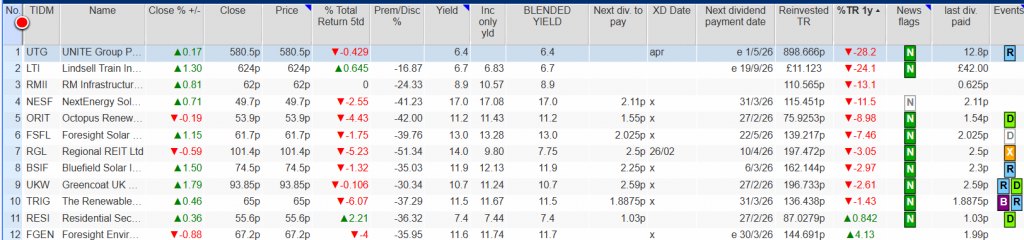
But what about if you’re searching for double-digit dividend yields? No problem. Take the following three stocks: The Renewables Infrastructure Group (LSE:TRIG), Octopus Renewables Infrastructure Trust (LSE:ORIT), and JPMorgan Nasdaq Equity Premium Income ETF (LSE:JEPQ). Each has a forward dividend yield above 10%, and a long record of paying market-beating cash rewards.
And I’m confident they can continue delivering brilliant income streams to investors. Want to know why?

Exchange-traded funds (ETFs) can be a great way to source a passive income. These can hold a wide variety of assets, helping to protect shareholders from individual shocks and providing a smoother return.
The JPMorgan Nasdaq Equity Premium Income ETF — which has a 10.8% dividend yield — is one such diversified fund to consider. It holds Nasdaq 100 US tech stocks which it then sells covered calls on. When out-of-the-money call options are sold, the income is paid to investors in dividends.
It’s a more complicated way to make income from the stock market. A focus on growth shares also means the fund could drop sharply in value during economic downturns. Yet over time, the ETF has proved a great dividend generator and one I expect to keep outperforming.
Investment trusts that focus on renewable energy are another top income source to consider. This is because interest rate pressures and worries over a slower-than-expected green transition have pushed prices lower, supercharging dividend yields.
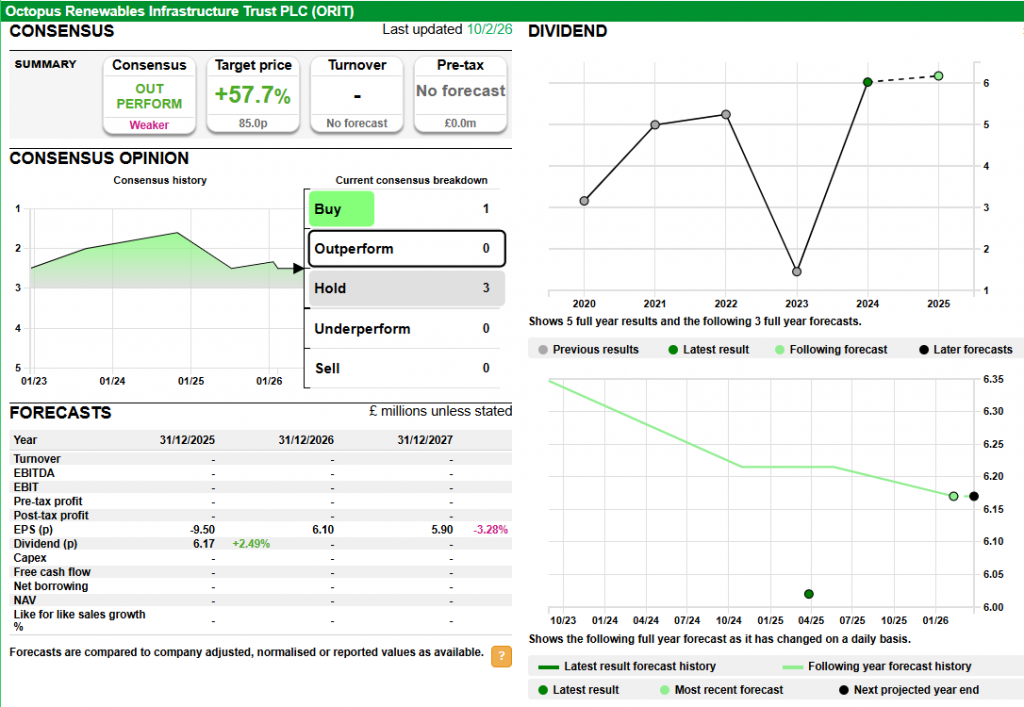
Octopus Renewables Infrastructure Trust now carries a 10.5% forward dividend yield. Could it rebound in value soon? I think so, with further Bank of England interest rate cuts on the horizon.
There’s a lot I like about the trust from a dividend perspective. Like other electricity producers, its operations are highly defensive and provide a steady flow of cash that can be returned to shareholders. I also like its wide, Europe-wide geographic footprint — this doesn’t eliminate the threat of weather-related disruptions, but it lessens the danger as localised calm conditions have a smaller impact on total power production.
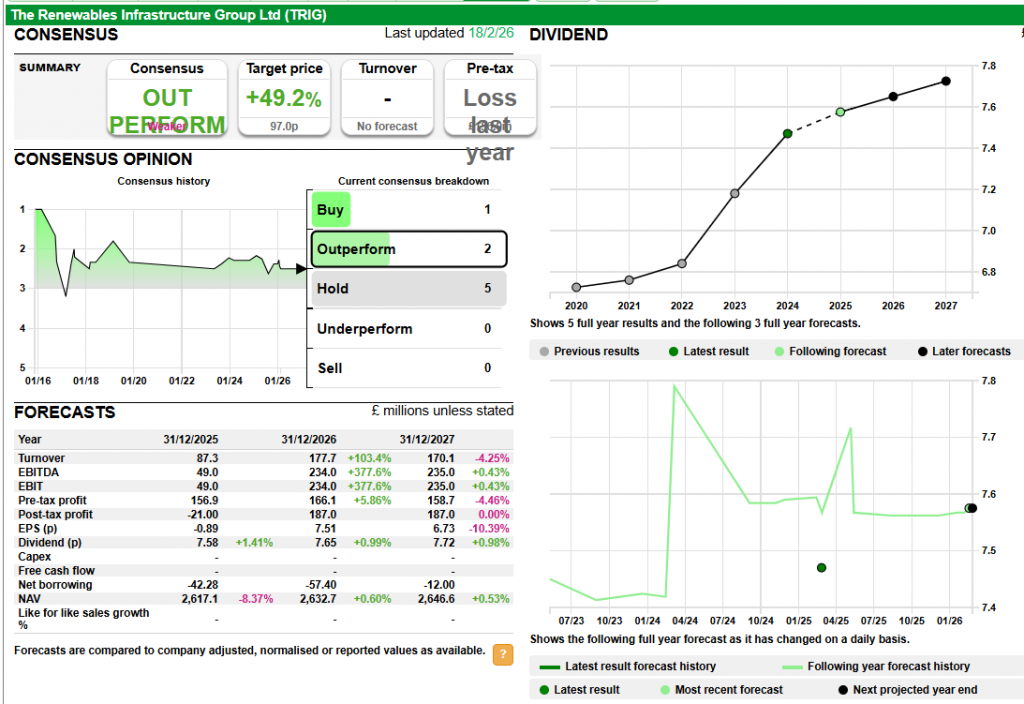
The Renewables Infrastructure Group is a renewable energy stock I’ve actually bought for my portfolio. And with a 10.7% forward yield, it’s one I think investors should seriously consider.
Why did I plump for this particular operator, you ask? With more than 80 assets on its books, it has an even wider footprint to protect against isolated operational problems. These are also spread across Europe, but that’s not all — its portfolio comprises onshore and offshore wind farms, solar projects, and battery storage assets, meaning it’s also well diversified by technology.
Lower electricity prices have been a problem of late. I’m confident, though, it will remain a robust passive income generator and that it’s share price will rebound following recent weakness.
Story by Rupert Hargreaves
Why MoneyWeek likes investment trusts© Getty Images
The investment-trust structure was conceived in the mid-1800s to fill a gap in the market for a low-cost, mass-market investment vehicle. One of the first was Foreign & Colonial, founded by City of London financier Philip Rose. The entrepreneur had a revolutionary goal: to provide the “investor of moderate means the same advantages as the large capitalist”
In the 1800s, investing was largely the preserve of the wealthy, with limited options available to the smaller investor. Foreign & Colonial pooled investors’ money and invested it in a diversified portfolio, spreading risk across a basket of assets.
The closed-ended structure, which provided a stable pool of long-term capital, made these investment companies ideal vehicles for financing the expansion of the British Empire and the rapid industrialisation of the Americas. As global investment markets grew and diversified, the range of investment options available to investors with investment trusts expanded, and the range of trusts available also expanded.
Investment trusts are structured as companies. They issue a set number of shares at the time of their flotation, and this forms a fixed capital base. Investors are then free to buy and sell the shares on an exchange. As the shares are freely traded and the asset base is fixed, trusts can trade at a premium or a discount to their underlying net asset value (NAV).
Open-ended vehicles, such as exchange-traded funds (ETFs), unit trusts and open-ended investment companies (Oeics) issue or eliminate excess shares at the end of each day to ensure the NAV and the share price match. This means there’s no room for a discount or premium to emerge.
This also means the capital base can shrink dramatically if the number of sellers consistently exceeds the number of buyers (and the price of shares in the fund falls). As the capital base shrinks, the vehicle has to continue selling assets to fund investment outflows. If those assets are challenging to sell, this can lead to a liquidity crunch. That’s why investment trusts tend to be the best vehicle for holding illiquid assets. They have no obligation to sell the assets, no matter how wide the discount to underlying NAV may become.
Some of the biggest trusts in illiquid sectors are the infrastructure trusts 3i Infrastructure (LSE: 3IN), Greencoat UK Wind (LSE: UKW) and the Renewables Infrastructure Group (LSE: TRIG). All of these trusts own portfolios of illiquid infrastructure assets, which generate steady inflation-linked cash flows.
Infrastructure isn’t the only asset class that lends itself well to the investment-trust structure. Trusts are ideally suited to owning portfolios of mixed assets, such as bonds, gold and stakes in hedge funds or private-equity investment funds. BH Macro (LSE: BHMU) has a position in the global macro hedge fund Brevan Howard, giving investors access to a fund that would otherwise be unavailable.
HarbourVest Global Private Equity (LSE: HVPE) is just one investment trust in the private-equity sector, offering investors exposure to this asset class via the trust structure. RIT Capital (LSE: RIT) and Caledonia (LSE: CLDN) are two examples of trusts making the most of the flexibility offered by the structure. Both are majority-owned by their founding families and own a broad portfolio of assets, from private-equity holdings to direct investments in other companies and portfolios of equities.
The structure of the investment trust also lends itself well to borrowing money. Investment trusts that specialise in acquiring illiquid assets – such as wind farms, property and infrastructure assets – can borrow against those assets to increase growth and build the asset base. These companies can also borrow to invest in equities. Borrowing money to invest in shares can be risky, but trusts can often mitigate some of the risk by issuing long-term fixed bonds.
For example, Scottish American (LSE: SAIN) issued £95 million of long-term debt between 2021 and 2022 with a blended interest rate of under 3%, maturing between 2036 and 2049. The trust, which owns a portfolio of equities, as well as property and infrastructure via other investment trusts, used the cash to reinvest into the portfolio.
The ability to borrow money is particularly helpful for the real-estate investment trust (Reit) segment of the market. Reits are a version of the typical investment trust, but with tax benefits when the majority of the portfolio is deployed into property. Companies like Supermarket Income (LSE: SUPR) and PHP (LSE: PHP) have leveraged this structure to build property portfolios designed around supermarkets and healthcare facilities, respectively.
MoneyWeek has always preferred investment trusts to open-ended funds for the above reasons – and the fact that they have historically outperformed other actively managed, open-ended funds. However, this has started to change in recent years. Investment trusts, particularly in equities, have struggled to keep up with the performance of other funds. As a result, investors have drifted away, and discounts to NAVs have risen sharply.
But there’s still a place for trusts within investors’ portfolios. Thanks to the structure of trusts, they are invaluable to build exposure to specific themes such as small caps, emerging markets, property and infrastructure. There are virtually no mass-market alternatives to the infrastructure offering, and trusts such as BH Macro, RIT and Capital Gearing (LSE: CGT) offer the sort of portfolio diversification that just can’t be found elsewhere.
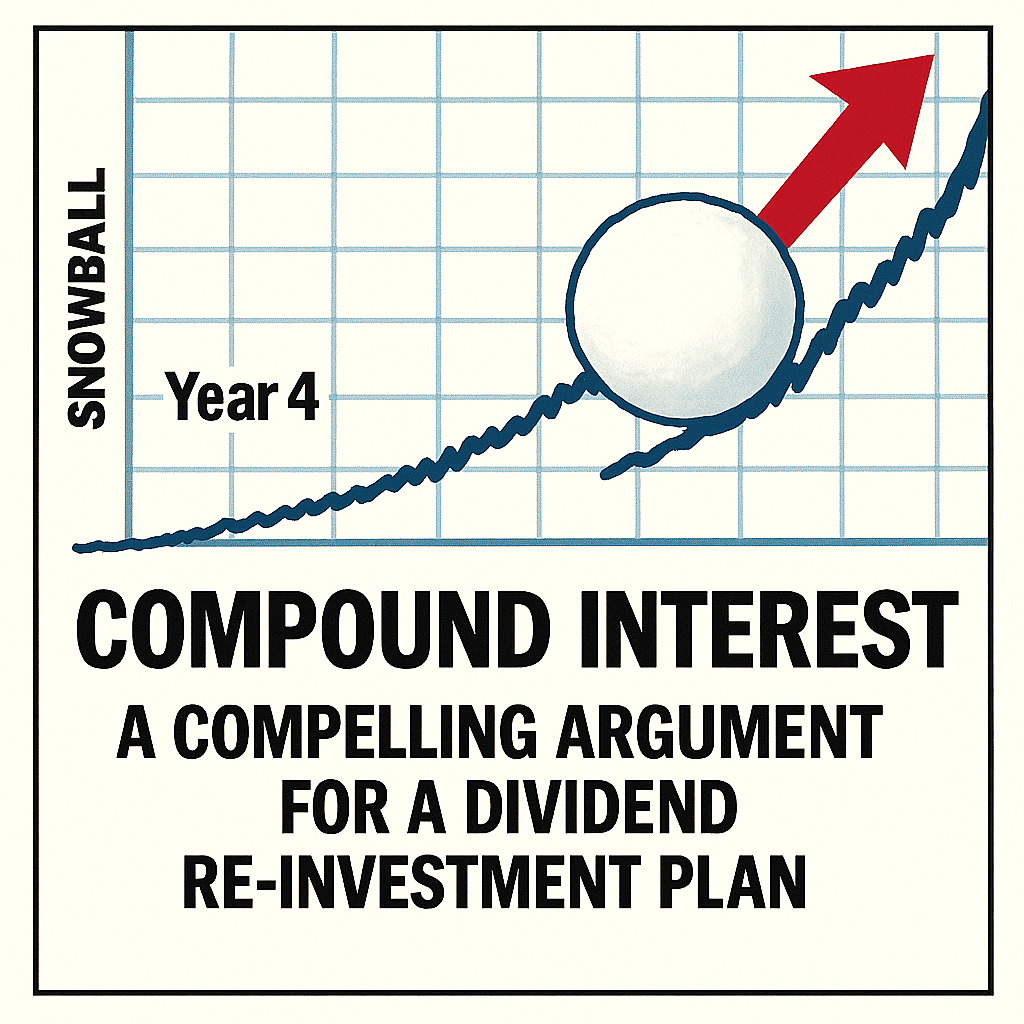
The 2026 target a yield of 10%, which in year 4 of the plan is already higher than an annuity and you get to keep all your hard earned. Remember when its gone its gone.

If you had been lucky or had a diversified Snowball
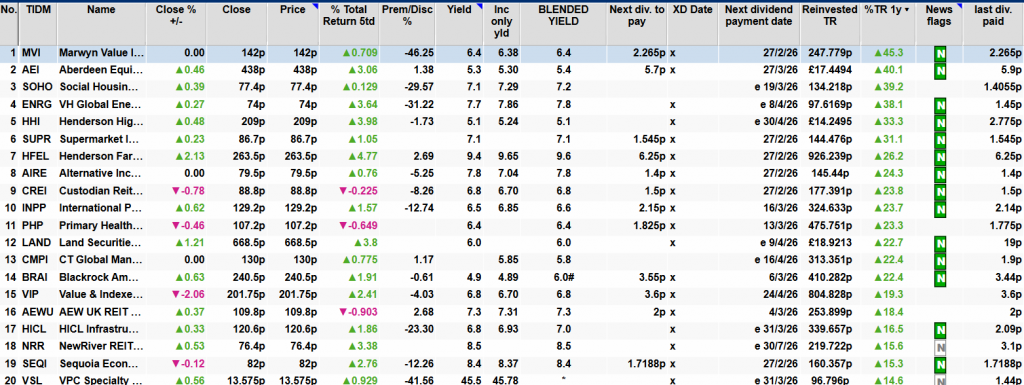

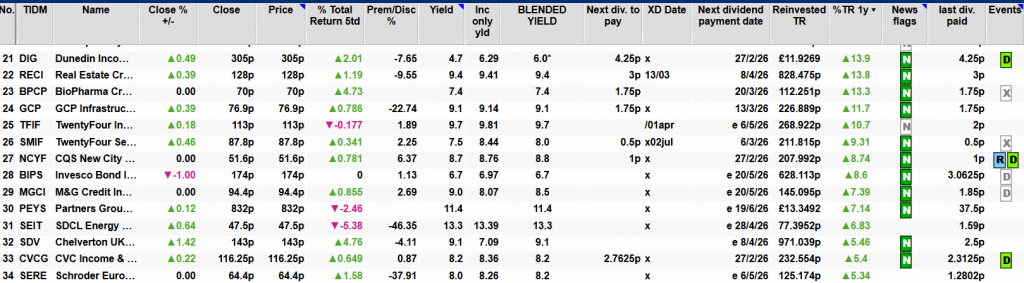


My share programme has changed their format, so until I get used to the new format, let’s look back at yearly performance, where if your Snowball is both

And you have been unlucky, these are the TR returns for one year.

19th February 2026
CT GLOBAL MANAGED PORTFOLIO TRUST PLC
All data as at 31 January 2026
This data will be available on the Company’s website,
CT Global Managed Portfolio Trust PLC
Income Portfolio
| Top Ten Equity Holdings | % |
| JPMorgan European Growth & Income | 6.6 |
| Murray International Trust | 6.1 |
| JPMorgan Global Growth & Income | 6.1 |
| NB Private Equity Partners | 5.4 |
| JPMorgan Global Emerging Markets Income Trust | 4.7 |
| Schroder Oriental Income Fund | 4.4 |
| STS Global Income & Growth Trust | 4.3 |
| The Law Debenture Corporation | 4.2 |
| 3i Infrastructure | 4.1 |
| TwentyFour Income Fund | 3.8 |
| Total | 49.7 |
Note: All percentages are based on Net Assets
| Net Gearing | 6.6% |
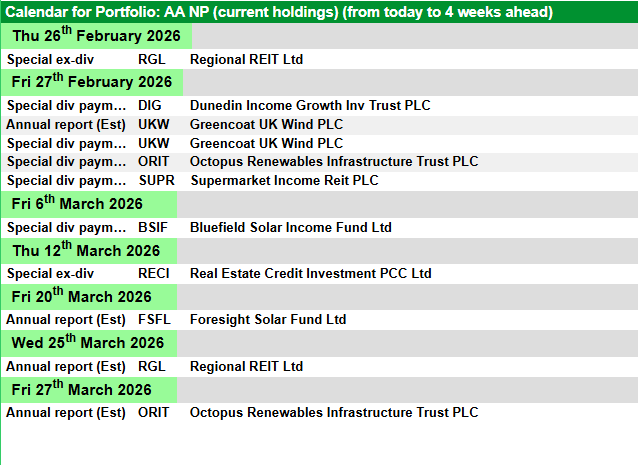
Research for your Snowball.
© 2026 Passive Income Live
Theme by Anders Noren — Up ↑
