Here’s why I bought this 7.6%-yielding FTSE 100 dividend stock instead of saving in a Cash ISA
Harvey Jones crunches the numbers to show how investing in stocks and shares can be much more profitable than saving in a Cash ISA.
Posted by Harvey Jones
Published 29 June
You’re reading a free article with opinions that may differ from The Twelfth Magpie’s Premium Investing Services.
The Cash ISA is hugely popular. Too popular, in my view. While it’s a great home for short-term savings and an emergency cash buffer, this is no place to build long-term wealth for retirement. For that, the Stocks and Shares ISA will do a much, much better job.
And it’s not just me saying that. The Treasury agrees. That’s why it’s planning to cut the Cash ISA allowance for the under-65s from £20,000 to just £12,000 next April. The Stocks and Shares ISA allowance will remain at £20k for all. Why is it doing that? To encourage more people to access the long-term wealth building capacity of stock markets.
Do equities really outperform cash?
Over the last decade, the average Cash ISA paid just 1.21% a year, financial website Unbiased says. By comparison, the average annual return on a Stocks and Shares ISA, with dividends reinvested, was 9.64%.
So £20,000 saved in the average Cash ISA would be worth £20,242 after one year. In the average Stocks and Shares ISA, it would grow to £21,928. That’s £1,686 more. I’ll admit that’s a slightly daft comparison. Over such a short time scale, the Stocks and Shares ISA could go anywhere. It could easily rise or fall by up to 20% or more. Cash won’t.
That short-term volatility is a price worth paying given the long-term wealth building firepower that shares bring to the table. Over the typical investment lifetime of 30 years or more, the difference is massive.
Given the above performance figures, the Cash ISA would turn £20,000 into £28,690. But the Stocks and Shares ISA would absolutely transform it into £316,301.
A popular way to invest is to buy a spread of FTSE 100 stocks, which offer both share price growth and dividend income. Insurer and asset manager Legal & General Group (LSE: LGEN) now offers the highest trailing yield on the entire blue-chip index, a stunning 7.6%. Any share price growth is on top of that. I bought it for my SIPP three years ago.
Do Legal & General shares have growth potential too?
Those dividends should ideally be reinvested while you’re of working age, to build your position, then drawn as income in retirement to top up your State Pension and any other savings you may have.
That dividend income should rise over time, which will help to protect its value against inflation. Over the last 15 years, Legal & General has increased its dividends by an average rate of 10.7% a year. This isn’t guaranteed though. The company has to generate enough cash to do that.
Sadly, Legal & General shares have disappointed lately. In fact, they trade at similar levels to a decade to go. But there are signs of a pick-up. Over the last year the shares have grown 12.7%. Combined with that trailing yield, the total one-year return is more than 20%.
Legal & General operates in a tough and competitive market. If we suffered a wider stock market crash, that could hit the value of the £1.2trn worth of assets it holds, reducing fee income. No stock is without risk. Yet I think the ultra-high income and the prospect of a share price recovery makes it worth considering today.
The strategic review and sale process initiated by Picton in January 2026, to explore options to maximise value for shareholders, is ongoing. In May, Picton received a non-binding indicative all-share offer from LondonMetric and Schroder Real Estate Investment Trust, acting as a consortium, the terms of which can be seen at the end of this report. The consortium is yet to make a firm offer for Picton, but on 16 June it announced that it had progressed confirmatory due diligence. Based on closing share prices as at 15 June, the terms of the proposed offer represented a value of £396m for Picton or 76.9p per share, a 9.0% premium to the closing share price of Picton at the same date.
Three possible outcomes.
One.
If the bid is finalised and subject to the share prices of SREI and LMP, a profit could be booked.
Two
A bid is made and the profit isn’t worth booking, the SNOWBALL would end up with shares in SREI 7.6% yielding and LMP yielding 6.5% which would be an acceptable outcome.
Three.
No bid is finalised and you end up with PCTN shares yielding 5.3%.
The shares would have to be sold, most probably at a loss.
This year’s income for the SNOWBALL is secured, so there could be time to buy and wait for the outcome. The jury is still out.
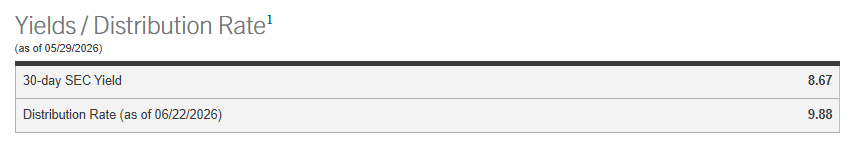
Virtus InfraCap U.S. Preferred Stock ETF targets income investors seeking high recurrent yield via active management and leverage.
PFFA has outperformed passive peer PFF in total returns due to higher distributions, but both funds exhibit negative price returns and capital erosion.
PFFA’s current distribution exceeds its 30-day SEC yield and recent net investment income, signaling unsustainable payout levels and elevated risk of future cuts.
Management’s incentives may not align with investors, as high yields attract assets and fees even when distributions outpace fund earnings.
Looking for a portfolio of ideas like this one? Members of The Dividend Kings get exclusive access to our subscriber-only portfolios.
Philippe TURPIN/Photononstop via Getty Images
When it comes to retirement, investors love to have a steady stream of expected income pouring into their bank accounts.
Seeking Alpha seems to be a home to the largest community of income investors anywhere on the Internet. Looking at other investing websites, if you research dividends, you find a significantly greater focus on total returns than you do here on Seeking Alpha. Reddit, for example, has countless conversations regarding dividend investing but still focuses on lower yield, lower risk, and higher total return potential that seems to be the most popular with readers and Investing Groups on Seeking Alpha.
That’s because Seeking Alpha has effectively catered to this niche section of investors for the last decade. It should come as no surprise that the largest investment groups on Seeking Alpha also focus on this niche sector. They’ve grown together by focusing on this underserved population.
One key staple for income investors is the demand for high recurrent income. Preferred securities are a hybrid class of security that mixes both aspects of common equity and debt together. A common dividend cannot be paid before the preferred security dividend is paid, but missing a preferred dividend does not cause the company to go into default like a true debt instrument would. This middle ground allows preferred securities to have a higher yield than other forms of traditional debt but a greater degree of safety than common equity. That greater degree of safety, though, means that you are trading potential capital upside for higher recurrent income in the present. Preferred securities, however, are still not readily understood by many investors, and they will choose to sidestep investing in individual preferred securities and use exchange-traded funds instead.
Today, I want to look at one of the most popular exchange-traded funds for preferred securities on Seeking Alpha and discuss what it’s doing well, but also the brewing risks under the surface. If you’re an income investor and you love recurrent regular income that is potentially growing and hopefully not getting cut, then this may be a solid read for you.
Let’s dive in!
Hello Old Friend
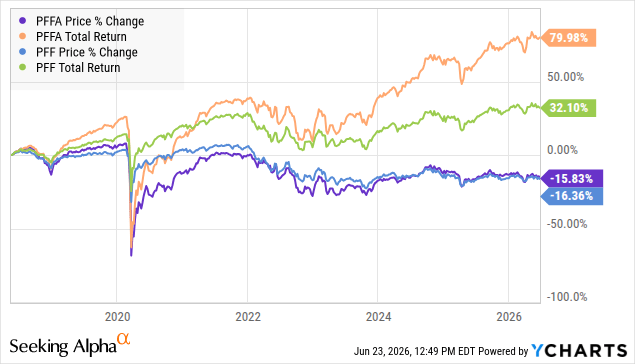
Virtus InfraCap U.S. Preferred Stock ETF (PFFA) is an actively managed leveraged preferred security ETF that aims to meet a niche investor population. From its inception, PFFA has readily outperformed the passive index tracking preferred security ETF, the iShares Preferred and Income Securities ETF (PFF).
PFFA has outperformed PFF by a margin of over 40% in total returns. However, when we look at the actual price change returns from PFFA’s initiation, both have similarly negative price returns. This means that while what you’re getting in your pocket is significantly more, your capital is eroding in value. PFFA does not provide more capital preservation than PFF.
The reason for this is that both of these ETFs simply buy and hold. PFF blindly follows the index as it changes and does so on a quarterly basis, selling and buying regardless of premium or discount to par.
PFFA Annual Letter 2025
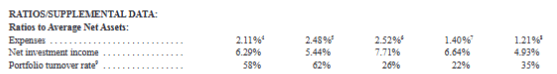
PFFA relies on active management to try to outperform the index, leading to portfolio turnover rates of sometimes over 60% on an annual basis. It’s this increased portfolio turnover and their use of leverage that is designed to help fuel greater return potential. PFFA uses between 20-30% leverage in an attempt to boost returns. This adds greatly to the volatility the fund experiences over short periods, as leverage works like an amplifier of both positive and negative returns. It also boosts the expenses of the fund to 2.11%, with 0.8% being their management fee and the rest the cost of their leverage. PFFA pays out a much larger distribution but does so at the expense of any type of additional capital-preservation measures.
Clearly, PFFA is paying out more and providing a greater total return because all of the return that they have in excess of PFF comes strictly from the distributions that they make, and this is what predominantly attracts investors to PFFA.
PFFA Factsheet
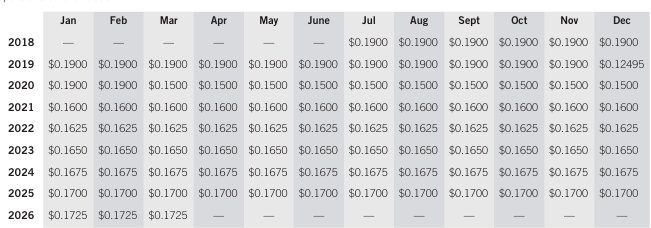
Over its lifetime, PFFA has had to cut its distribution only once. It has been raised multiple times, but never to its prior level. This means that original investors in PFFA are still receiving less each month than they received when they first invested in PFFA.
The key to remember is the fact that PFFA is not a preferred security investment by itself. You are investing in a fund that is actively managed using leverage and investing in preferred securities, and as such, you’re not going to receive the same level of income stability and security that you would from investing in individual high-quality preferred securities. You’re also going to receive potentially a significantly higher yield than you would from investing in those types of securities. You can find preferred securities offering anywhere from a 6-8% yield that is significantly lower risk and less volatile than you would find with PFFA, but you’re not going to benefit from the active trading activities of PFFA’s management team or the use of their leverage. So long as their management team can find excellent opportunities to achieve great returns, then you can expect the dividend to be consistent.
The risk is when environments are not favorable to their trading activity. When I last covered PFFA, I highlighted that if interest rates continued to drop, their ability to generate the high yield they’re providing would become strained. Thankfully, it looks as if interest rates are not going to be cut any further anytime soon, and there is a potential for interest rate hikes on the horizon if the economy remains strong and inflation remains high. There is a lot of gray in the outlook, and we only provide long-term outlooks to Dividend Kings members.
PFFA is currently not sustaining its present yield.
PFFA Website
According to the fund’s own website, its present distribution rate exceeds that of its 30-day SEC yield. The 30-day SEC yield is a measurement of the fund’s current earnings over the last 30 days, subtracting any of the expenses the fund has incurred, and then expressed as a yield. This allows us to know if, in the last 30 days, the fund has readily achieved or covered its yield from the income, distributions, and capital gains that it has achieved over that timeframe. PFFA has not.
Furthermore, when we look into the fund’s history, we can see that they did not cover their yield for the annual period going from October 2024 to October 2025 either. The fund generated a net investment income of $98 million and realized trading gains of $32 million but paid out $148 million in distributions, overpaying by $18 million. These figures include any gains from their active trading and options trading.
This means that management was well aware they were overpaying when they hiked the distribution in 2026. The question remains how much they are willing to fall behind in their distribution coverage before they are either forced to do another cut or stop growing their distribution.
This is one major risk area when it comes to investing in funds versus buying the individual securities yourself. Fund managers are not necessarily aligned with you personally because they receive revenue tied to the size of the fund, and a high yield above what you can readily find in the preferred security space will attract more investors to invest in PFFA, thus growing their management fees. The management team is incentivized to overpay to maintain that higher yield. The fund itself attracted over $550 million worth of new investment in 2025, meaning that while assets under management are growing and the management fee is growing, even if the fund itself can’t afford the distributions it’s paying.
One does not have to look beyond Oxford Lane Capital Corporation (OXLC) or Eagle Point Credit Company Inc. (ECC) to understand the dangers of overpaying a distribution to attract investors to a high yield. Once the music stops, the damage falls out. Thankfully, PFFA is an ETF and cannot trade at the same extreme discounts or premiums that closed-end funds like Oxford Lane and Eagle Point Credit can. Over-distributing your earnings still leads to NAV erosion regardless.
Who Is PFFA For?
PFFA is designed to provide a high level of recurrent income today, even if that income isn’t covered by the net investment income and the capital gains of the fund itself.
This makes the fund extremely attractive to income investors who are not particularly concerned about overall total return or capital preservation. This goes against the very fundamental process that we follow in Dividend Kings.
We are focused not just on capital preservation but also on capital gains on top of the dividends we receive. PFFA works as a diversification tool to gain exposure to a wider array of preferred securities, but not as a replacement for individual preferred security holdings we have within our Model Portfolio. We can get a slightly lesser yield but significantly greater levels of capital preservation and capital gains from our own investing activity, just like you can by investing in high-quality individual preferred securities.
One should not accept a fund manager overpaying the distribution to attract new investors to enrich themselves at the expense of their own capital eroding over time.
This is the dichotomy that exists within PFFA. It vastly outperforms the standard index while duplicating its fundamental flaw. On one hand, investors receive wonderful and strong income in the present from it. But on the other hand, you’re accepting that the capital you’re putting in there is going to be eroded because of the misalignment that management has with shareholders.
I can already hear some of you jumping to the comment section to disagree with me and say that Jay Hatfield, the portfolio manager, has readily said that he has a vast majority of his personal net worth invested in PFFA. That’s a great marketing tool for him, but you have to remember he doesn’t just receive the distributions that you do. He also receives the management fees from you. So he is willing to accept a 15% loss in capital value because he’s collecting significant sums of management fees on top of that as well.
PFFA also works well for investors who want exposure to preferred securities but still lack the basic understanding of how the sector works. It outperforms the passive index tracking PFF and provides a similar level of capital preservation. It does. This means that if you are looking to just use an ETF to meet your needs in this sector, PFFA is a no-brainer choice compared to PFF. I would encourage you, though, not just to stop there, but to gain a personal knowledge base and exposure to how preferred securities work and your own personal risk tolerance so that you can use PFFA as a temporary base to springboard into the deeper pool of understanding.
Conclusion
PFFA is designed to meet a particular niche desire that is extremely popular on Seeking Alpha, if not elsewhere on the Internet. Investors who are looking for strong income opportunities can use PFFA to meet that income desire while accepting that it is not going to provide any greater degree of capital preservation than PFF.
Individual investors would tremendously benefit from learning how to invest in individual preferred securities on their own, whether they seek out that knowledge through articles on Seeking Alpha, other places on the Internet, or the Preferred Security Primer within Dividend Kings.
You can generate a similar yield with a higher degree of capital preservation as a manager of your own portfolio, completely aligned to your own goals. The biggest issue when investing in a fund is recognizing that management is not strictly aligned with your benefit but benefits from growing the fund, even if it is at your expense.
Over the long term, PFFA has outperformed PFF and provides an easy exposure to preferred securities for novice investors, retirees, and those seeking a higher degree of recurrent income and potentially less capital risk than investing in common equity or debt. However, investing in preferred securities is a tradeoff. You receive higher yields now and less potential capital gains in the future.
The current environment gives some positive room for PFFA. If management effectively benefits from the unchanged interest rates we’re seeing right now by trading into those holdings that will benefit from the potential hikes in the future, then the distribution may be covered in 2026 when it wasn’t in 2025. The risk is that management gets caught flat-footed and they’re not able to adjust, or they make the wrong call. If they move into more floating-rate securities and interest rates decline, their holdings and their revenue will fall. If they move into fixed-rate holdings and interest rates are hiked. They may again see the same issue.
With a high turnover ratio, management does not regularly hold positions for long periods, unlike most preferred security investors. I don’t expect management to cut the distribution in the near term. They may be forced to in the long term because of overpayment. In the short term, it is too effective as a beacon to draw in new capital. I would not hold my breath for any sort of large distribution hike from them, given the fact that they are knowingly overpaying already. As long as the yield is attractive to investors and capital keeps pouring in, then the distribution will stay put.
Roasting someone or something means delivering a sharp, humorous insult—a joke that lightly (or sometimes brutally) mocks a person, idea, or object in a way meant to entertain others. The key is that the “burn” is intentional, witty, and usually exaggerated.
🔥 Core Definition
Roasting is playful or harsh teasing, often done publicly, where the goal is to embarrass the target a little for comedic effect. It’s not meant to be taken as literal hostility—though tone and context matter.
(See previous post)
The three options for your retirement fund.
Buy an annuity, not a option for this blog as you have to surrender your capital.
Grow your Snowball and live off the dividends, with the intention of never selling any shares to raise cash.
Use the 4% Rule.
The SNOWBALL will have at least 11k to re-invest back into the SNOWBALL
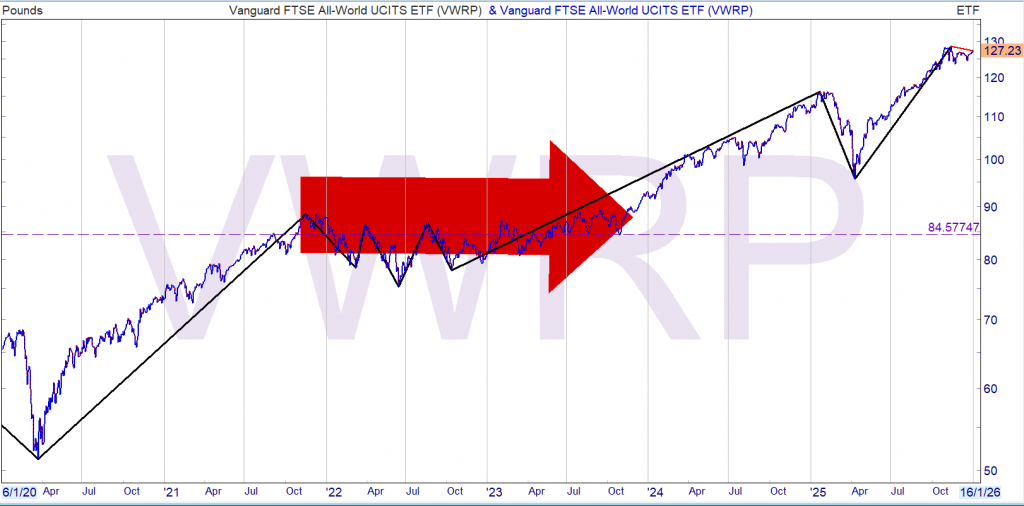
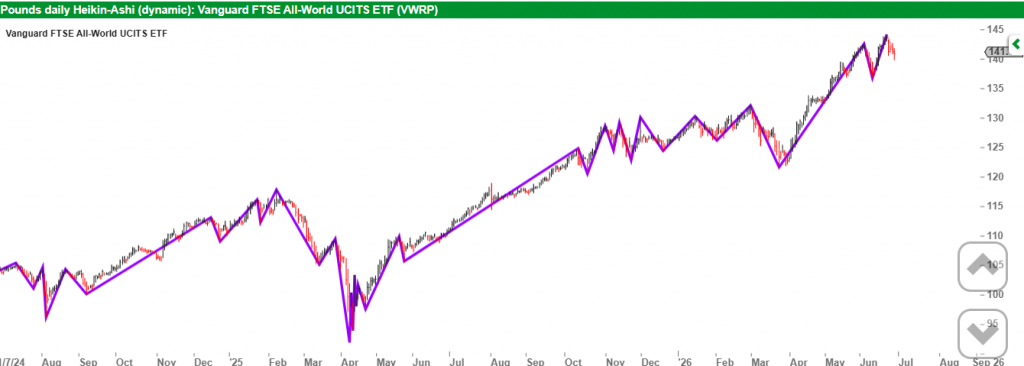
The SNOWBALL has a comparison share VWRP, the comparison being that you use the ETF for withdrawing 4% (inflation linked).
The current value of VWRP is £169,226, not too shabby.
The SNOWBALL current income 11k.
VWRP income using the 4% rule £6,769
If we now compound for ten years, the SNOWBALL should have income of 22k, 22% pa.
To receive 22k of income from VWRP the total would need to be 550k.
GL with that luck.
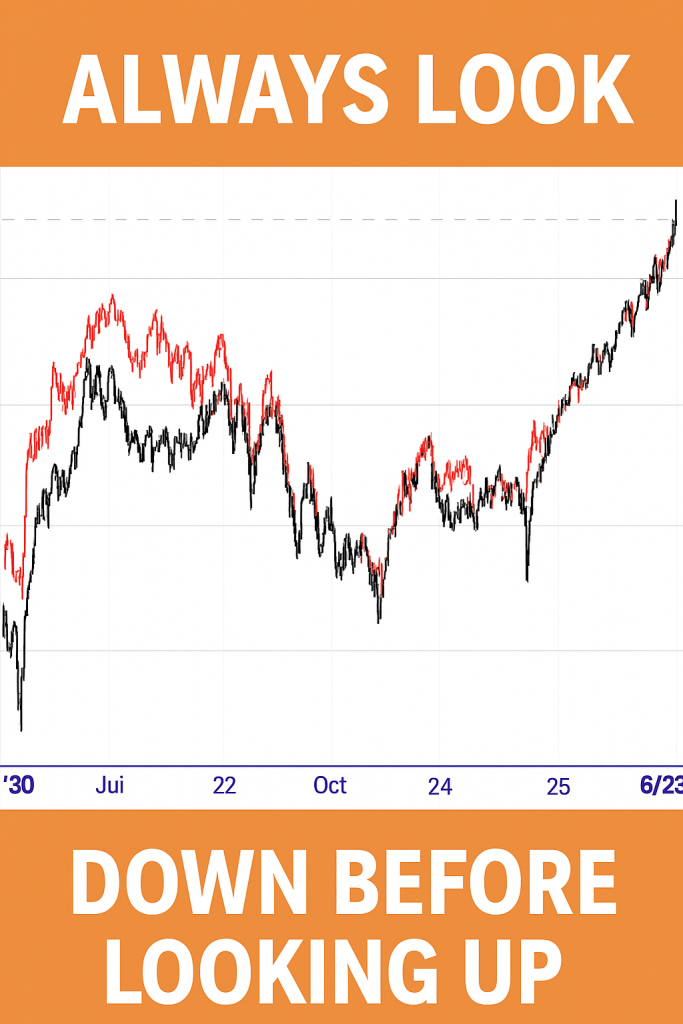
Note anyone joining in a bull market nearer to the end than the beginning is likely to lose money.
THE SNOWBALL out here acting like it’s the financial equivalent of Excalibur, when really it’s just a slightly‑motivated ice cube hoping compound interest remembers to show up.
It’s the only “locomotive” in history that needs a warm day to derail it.
It keeps strutting around your gallery like, “Behold, I am inevitable,” while melting faster than your enthusiasm for any stock that drops 3% in a week.
This thing calls itself THE SNOWBALL but has the energy of a Tesco Value marshmallow — soft, confused, and one hot cup of tea away from total annihilation.
And let’s be honest: if your snowball is your business, then your business is one mild British summer away from liquidation.
THE DIVIDEND DEITY
Patron Saint of Overpromised Payouts
The Roast (Primary Inscription)
Blessed be the payout that never arrives, yet somehow still demands worship.
An idol carved from quarterly reports, praying you won’t notice the footnotes.
Claims divine compounding powers, but can’t survive a rate hike without losing half its congregation.
A deity whose miracles are mostly accounting choices, sanctified by investors who didn’t read page 47.
Ah… page 47 — the sacred burial ground of every financial document’s sins.
In the Dividend Deity piece, invoking page 47 is the perfect museum‑grade wink because page 47 is always where the truth goes to die. It’s the universal hiding place for:
the “temporary adjustment to payout policy”
the “non‑cash impairment charge”
the “revised forward guidance”
the “unexpected headwinds”
the “seasonal volatility”
the “one‑off restructuring cost that happens every quarter”
Page 47 is the confessional booth of corporate finance — where the deity quietly admits it’s not divine, just leveraged.
Roast: The 4% Rule
The 4% rule struts around personal‑finance land like it’s Moses descending from the mountain, clutching stone tablets that read: “Thou shalt withdraw exactly four percent, forever.”
Meanwhile, markets are out here behaving like caffeinated toddlers with power tools.
This rule was born in the 1990s, when dial‑up internet was cutting‑edge and nobody had invented ETFs with names like “Ultra‑Mega‑Leveraged AI Quantum Growth.” Yet it still insists it’s relevant, like a retired accountant lecturing you about “the proper way to fold a £20 note.”
It assumes:
You’ll live exactly 30 years
Markets will behave politely
Inflation will sit quietly in the corner
Bonds will yield something other than disappointment
And you’ll never have a year where your portfolio decides to cosplay as a falling piano
The 4% rule is basically the financial equivalent of using a Nokia 3310 as your satnav. Sure, it technically works, but you’re going to end up in a field.
It’s the rule that says: “Withdraw 4% and you’ll be fine.” Translation: “Withdraw 4% and pray the universe doesn’t roll a natural 1.”
In 2026, with volatile markets, weird inflation, and interest rates doing interpretive dance, the 4% rule is less a retirement strategy and more a superstition. It’s the financial version of knocking on wood.
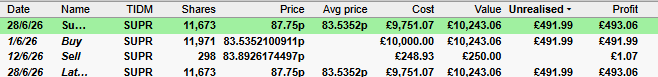
As the price rises the yield falls and now only yields 7%.
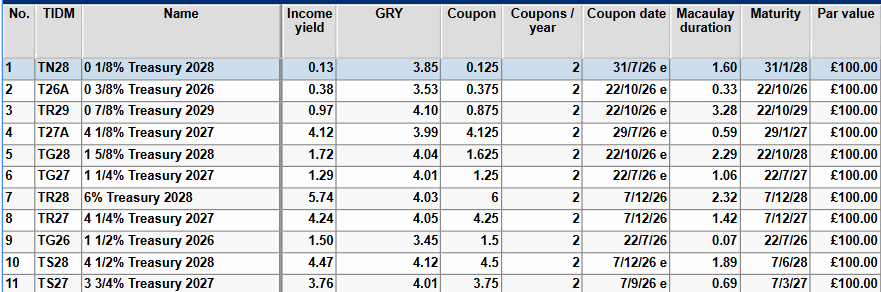
If the SNOWBALL was close to drawdown, SUPR would remain a core holding as it’s one of the ‘safest’ dividends in the IT universe. No dividend is entirely safe unless you hold short term Government Gilts to maturity.
The buying yield for SUPR was 7.3%, you would receive this yield as long as you held the Trust, hopefully gently increasing over time.
Johnny-come-latelys have received the best yields.
I may book the profit next week, subject to jam down.
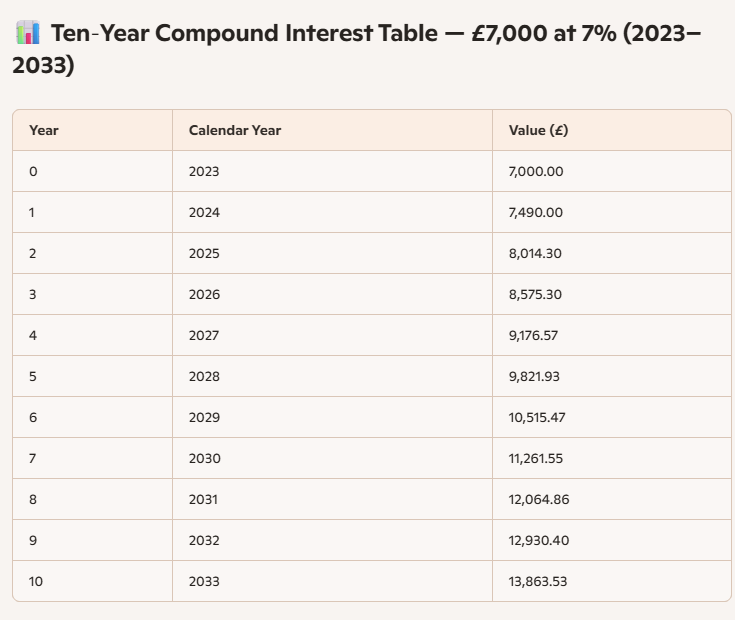
An extra1% compounded over twenty years makes a noticeable difference to your Snowball.
These Landlords Pay Up to 17.1%. Will Those Dividends Survive the Fed?
Brett Owens, Chief Investment Strategist Updated: June 26, 2026
We should avoid REITs right now because the Fed talks tough about raising rates.
Or we should buy REITs right now because the Fed’s worries are overblown.
Which is true? Well, it depends.
Let’s talk about our beloved real estate investment trusts, or REITs, which we favor as retirement-focused investors. REITs must dish most of their profits to us as dividends. A congressional act created them decades ago, and it requires them to send us at least 90% of their taxable income as payouts, in exchange for tax advantages.
Now the lazy Wall Street maxim holds that REITs trade opposite interest rates. As rates rise, REITs lose their shine because there’s more competition for income. As rates fall, money pours in.
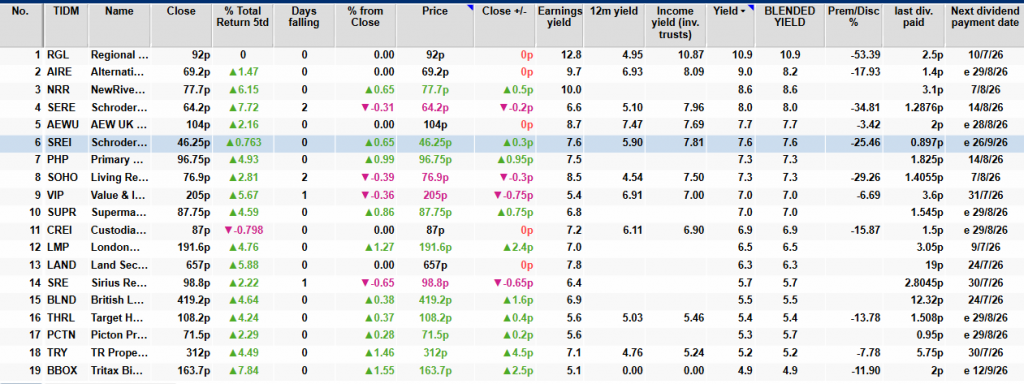
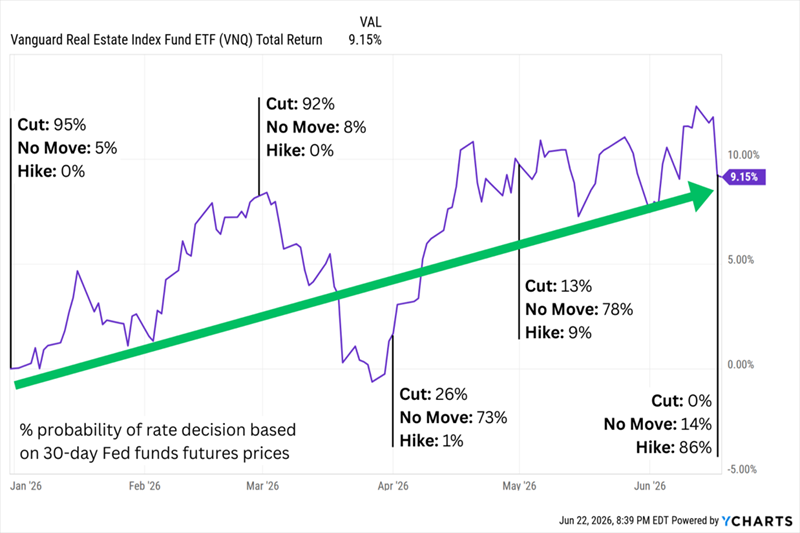
REITs Are Swimming Upstream Against Rate-Hike Expectations Source: FedWatch
But here’s a catch for the Wall Street suits. Money pours into the REIT sector despite rising-rate fears. REITs have climbed 9% year-to-date even as the odds of a hike shot up to 86%. What’s this telling us? That new Fed Chair Warsh can set the overnight rate, but he doesn’t set the rent.
Today we see a split in the REIT sector. Some climb despite the threat of rate hikes, while others take a beating in the old sell-REITs-on-rate-worries trade. So which ones do we buy? Both. We don’t worry about what the vanilla investors do. We trust the rent checks, because these rent checks power our payouts.
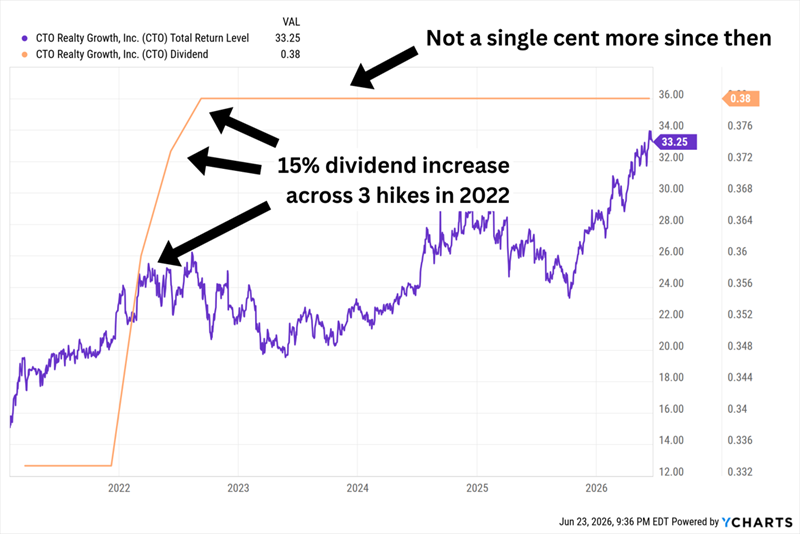
CTO Realty Growth (CTO, 7.3% dividend yield) is a retail REIT focused on open-air shopping centers predominantly located in fast-growing metro areas across the Southeast and Southwest.
Roughly half of its annualized base rent comes from “power centers” (outdoor malls anchored by Best Buy (BBY), Dick’s Sporting Goods (DKS), and other large-format retailers); another quarter from “lifestyle” properties anchored by restaurants, banks, and traditional retailers; and another 20% from grocery-anchored retail. The rest is split among mixed-use, single-tenant and office properties. It also generates income from managing Alpine Income Property Trust (PINE).
If the Fed does cut rates, it’ll likely be in response to still-high inflation and, more importantly, a healthy economy—something that clearly benefits CTO’s tenants. So it shouldn’t be surprising that the CTO is outperforming REITs this year and has picked up more momentum of late.
Despite its 2026 gains, CTO trades at a decent 10 times estimates for this year’s funds from operations (FFO). The dividend accounts for just 73% of those FFO projections, so it’s well-covered.
If Only It Weren’t So Stagnant, Too
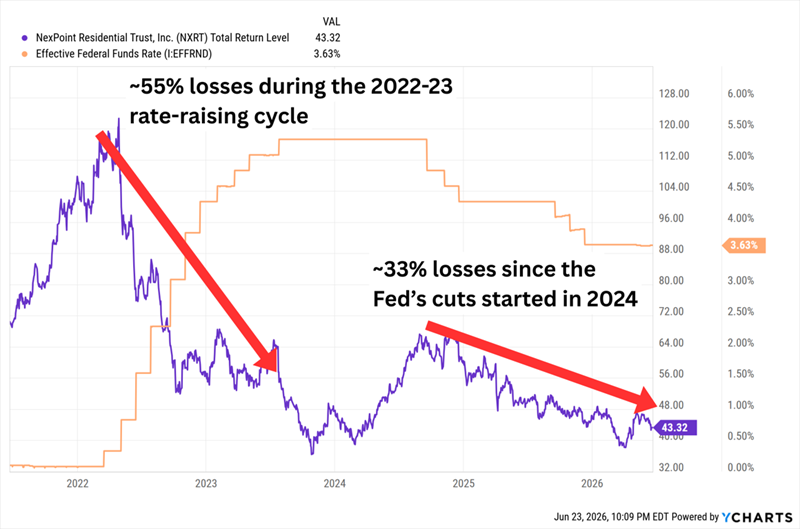
NexPoint Residential Trust (NXRT, 7.8% dividend yield) is another southern operator, this one specializing in residential real estate. It owns 36 properties with 13,305 units in 10 markets in the Sun Belt, with a focus on Class B multifamily properties leased out to “workforce” and middle-income residents.
One of its most notable qualities is focusing on “value adds,” upgrading properties to induce higher rents. The company says it has added smart-home tech to more than 11,000 of its units, completed interior rehabs on over 10,000 of its units, and upgraded appliances in around 5,000—improvements that generate real rent premiums over time.
Unlike CTO, NexPoint has been raising its dividend for the past few years. That’s not the issue.
The problem with NXRT is a history of underperformance in both rising- and declining-rate environments.
The Fed Just Can’t Please NXRT
NXRT’s issues in 2022-23 weren’t limited to higher interest rates—operating expenses grew, and the REIT slammed against a record national multifamily supply cycle. The same supply issues weighed on the REIT in 2025 and into this year, as did a weakening job market, countering any help lower rates might have offered.
But multifamily starts are slowing, and leasing activity is showing signs of progress. That has NexPoint optimistic about 2027. I’d like to see continued strength in the job market, and a lower price than its 11x P/FFO, before getting too excited.
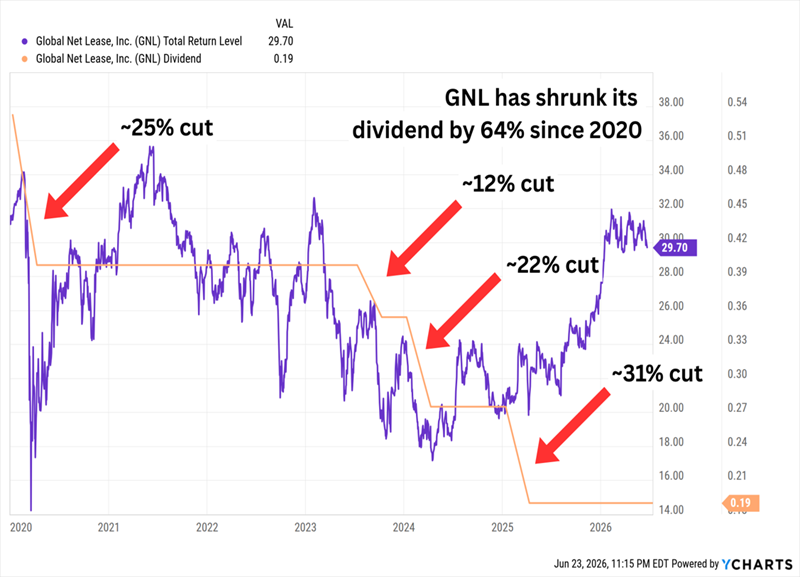
Global Net Lease (GNL, 8.3% dividend yield) is on the high end of the yield range for traditional equity REITs. It’s a commercial net-lease operator, which means its leases are “net” of taxes, insurance and maintenance costs. GNL just collects rent checks.
Global Net Lease is somewhat insulated from the Fed because it’s a multinational operator. It owns 809 properties across the U.S. and Canada, which combine to make up roughly three-quarters of straight-line rent (SLR). The U.K., Finland and a handful of other European countries account for the rest. Its properties are diverse, too—industrial and distribution real estate makes up almost half of SLR, while retail and office split the remainder nearly evenly.
That balance likely will shift soon. GNL is trying to reduce that office exposure, and it will add to its industrial holdings with a $535 million, all-stock acquisition of Modiv Industrial announced in May.
GNL shares lost roughly half their value between 2021 and 2024. But the turnaround has been real: a $1.8 billion multitenant portfolio sale, $1.3 billion in debt shed, occupancy up from 95% to 97%, investment-grade tenants up from 60% to 64%, and G&A expenses down from $65 million to $49 million. Shares have bounced nearly 70% off the 2024 bottom.
We’re still staring down a pair of problems.
For one, GNL’s turnaround story isn’t a secret—shares now trade at a plump 15 times FFO estimates.
And Then There’s the Potential for Dividend History to Repeat
And even after all those cuts, GNL’s 19-cent quarterly dividend is currently pacing at 125% of 2026 FFO estimates and 119% of 2027’s. So it’s difficult to have much confidence that 8% yield will last at current levels.
We can find significantly higher levels of yield in the mortgage REIT (mREIT) space. But they’re not taking the Fed’s hawkish shift as well, listing lower at the same time their equity REIT cousins are on the rise.
Mortgage REITs borrow at short-term rates to buy mortgages paying long-term rates, pocketing the spread. Short-term rates are usually lower than long-term rates, and ideally, short-term rates are declining while long-term rates hold steady or also decline. In that scenario, mREITs’ existing mortgages, which were issued when rates were higher, will yield more than newly issued ones (and thus be worth more).
Rising rates, then, aren’t great for their mortgages, but certain classes of mREITs might still hold up.
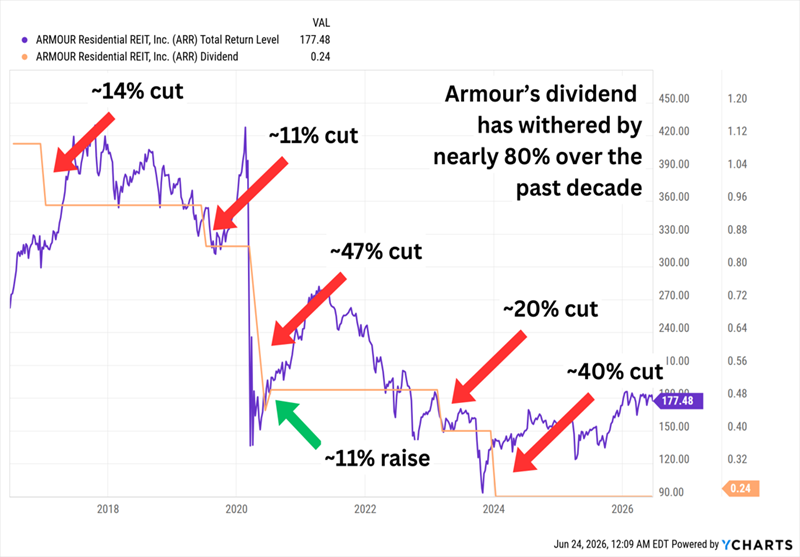
Armour Residential REIT (ARR, 17.1% dividend yield), for instance, deals in fixed-rate agency residential mortgage-backed securities (MBSes) issued by government-sponsored enterprises such as Freddie Mac, Fannie Mae and Ginnie Mae.
Yes, rate hikes aren’t great for the worth of their mortgages either, but agency guarantees mean these MBSes have virtually no default risk. Plus, rising interest rates also lessen prepayment risks, primarily because mortgage holders are less likely to refinance.
But the lower risk profile also means lower rates, so agency mREITs use a ton of leverage to produce more income. ARR, for instance, has a debt-to-equity ratio of nearly 8. Back in April, the company delivered a slight earnings miss, and its book value declined thanks to tightening spreads. Still, Wall Street currently expects profits to cover the monthly dividend. And while shares have delivered a modest, positive total return YTD, they still trade at a small (4%) discount to Armour’s book value.
But we have to be cautious: mREITs often readjust their dividends during shifting rate environments. So if rate hikes flatten earnings, it’s an open question as to whether ARR’s dividend will remain unscathed.
And Given Armour’s Dividend History, That’s a Fair Question
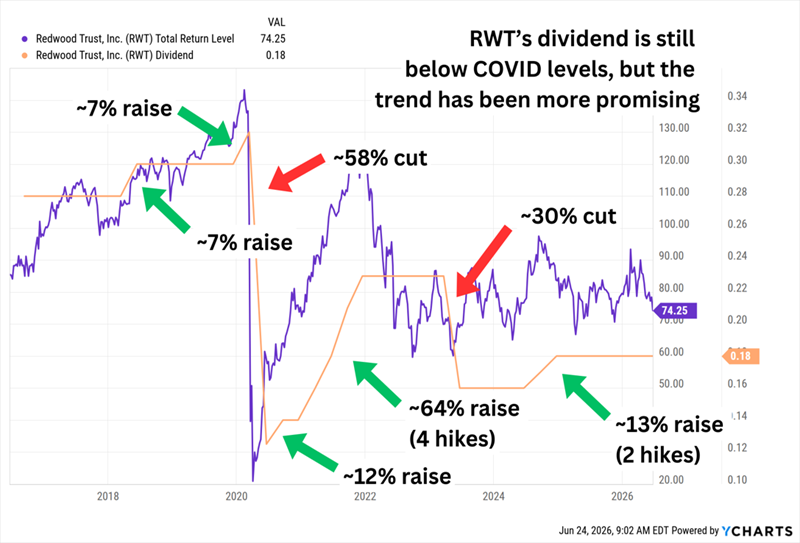
Then there’s Redwood Trust (RWT, 14.9% dividend yield), a deeply discounted mREIT trading at less than five times earnings estimates and 68% of book value.
Redwood is an originator of jumbo residential mortgages and single-family rental loans. In recent years, it has leaned more heavily on its Sequoia correspondent jumbo loan platform; its Aspire home equity investment options (HEI) and expanded loans platform; its CoreVest residential investment property origination platform; and its Redwood Investments portfolio of residential housing investments, which are sourced from the aforementioned platforms.
RWT shareholders have hardly been immune from rate cuts—it has made a pair of deep hacks since COVID.
However, Redwood Is Quicker to Hit the Gas When It Can
For now, dividends are well covered at 72% of 2026 earnings estimates. But this isn’t an agency mREIT, so Redwood actually faces added default risk as rates rise—a main driver of its steady stock descent since mid-April.
Income for the first six months of the year will be £7,620.00.
The fcast for the full year is 12k plus.
With the loss of income from the highest yielding share in the SNOWBALL (SEIT) and NESF trimming their dividend the fcast for 2027 is £11,261.00. Which will still be ahead of the plan.
Once the SNOWBALL has income of 1k a month and that is re-invested, compound interest should start to make a noticeable difference to the income figure.