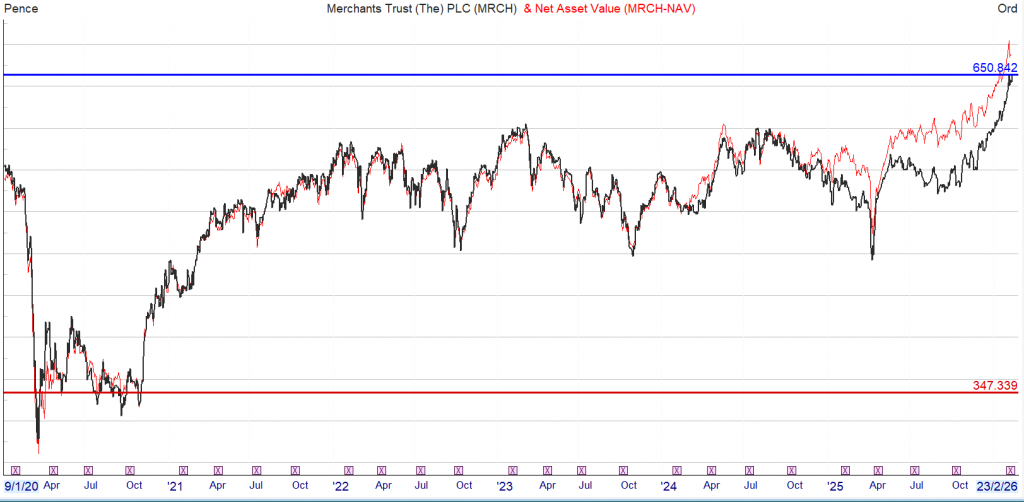
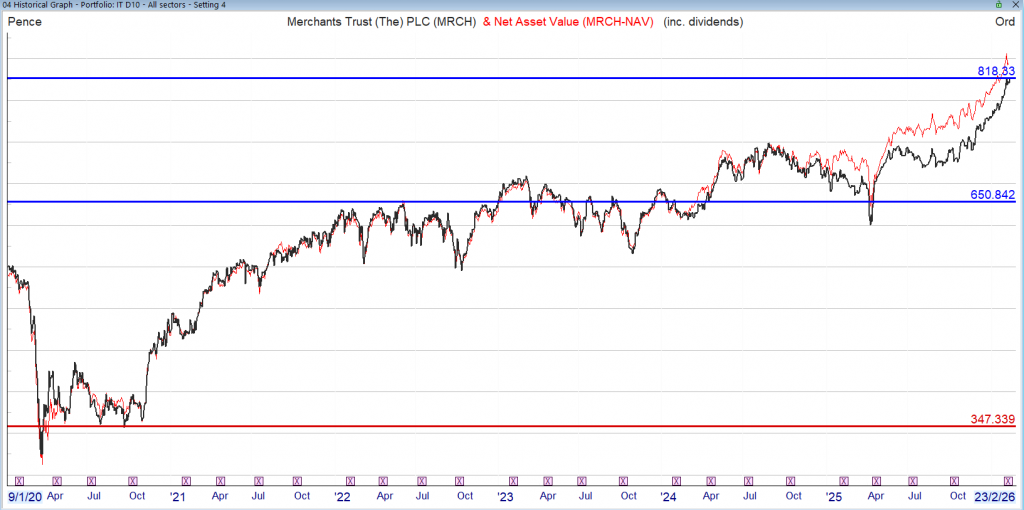
With dividends included
Investment Trust Dividends
With dividends included
If you think of your portfolio as money lending business and as long as the company continues to pay you interest, you are willing to lend it’s your hard earned.
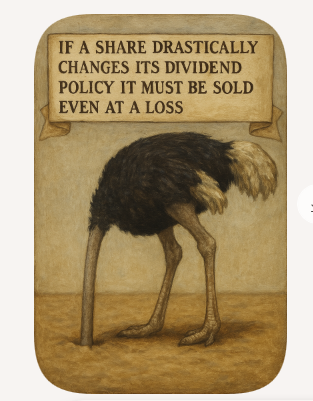
If one of your customers fail to pay their interest payment, close the loan arrangement and move on.

Be watchful that the fire doesn’t melt your Snowball


The SNOWBALL currently has currently £1,763 xd and when received added to the cash of £445, will be re-invested, probably in a new position.


TwentyFour Income Fund Limited (“TFIF” or “the Company“), the FTSE 250-listed investment company whose investment objective is to deliver income for shareholders by investing in less liquid asset-backed securities (“ABS”), is pleased to announce its Interim Results for the six-months ended 30 September 2025.
TwentyFour Select Monthly Income Fund Limited (“SMIF” or “the Company”), the listed, closed-ended investment company that pays a monthly dividend to shareholders by investing in a diversified portfolio of credit securities
Similar companies but not identical, SMIF pays a monthly dividend which could be useful to balance your monthly outgoings.

TFIF
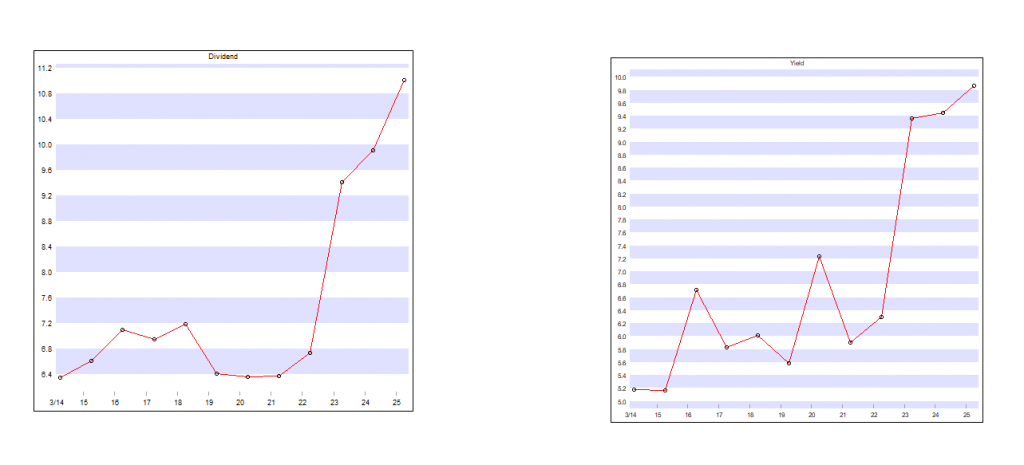
SMIF

TFIF currently pays a quarterly dividend of 2p
SMIF currently pays a monthly dividend of 0.5p
Both funds may pay out any surplus income as a special dividend, which complicates the yield graph above.
As interest rates fall the higher dividends become more attractive so both shares trade at small premium.
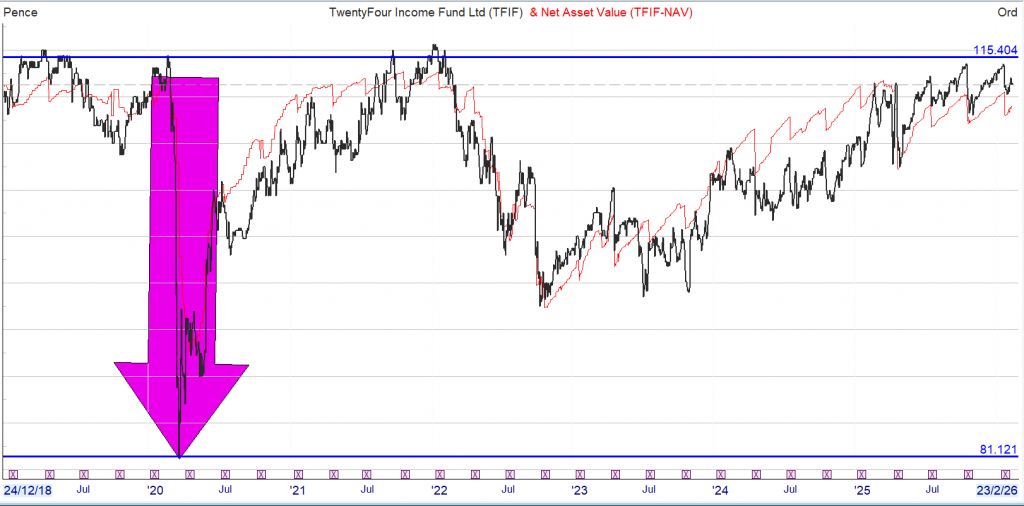
Not without risk as the covid crash shows.

Feb. 09, 2026
Rida Morwa Investing Group Leader
Co-authored with Beyond Saving
We sit here writing about investments every day. For those of us who are deep into the investment world, it’s easy to lose sight of the reality that most people face: Managing your own investments is intimidating.
You worked your whole life in a business that probably had nothing at all to do with investing. You honed your skills and became an expert at something, which meant that you probably weren’t spending much time learning the difference between EPS, adjusted earnings, FCF, FFO, AFFO, CFFO, EBIT, EBITDA, and the rest of the alphabet soup that we investment nerds throw around.
Then you start thinking seriously about your retirement, and it’s important to you. It’s literally your quality of life that is at stake. It’s something that feels too important to just put into the hands of some stranger. So you make the decision that you’re going to manage your own investments.
You’re a smart person, so you do some reading, and you find yourself being pulled in numerous directions. For every stock that you find, someone is screaming that it’s a wonderful buy, and someone else is screaming that it’s a horrible pick. And they’re throwing out numbers and alphabet soup to prove their point.
The result that we often see is that people end up with directionless portfolios. They buy whatever ticker caught their eye, without any clear purpose. Many people can’t answer the question, “How is this investment helping you achieve your goals?” Many can’t even succinctly answer the question, “What are your goals?”
One of the things we’ve really emphasized here at High Dividend Opportunities is communicating our strategy and why we do what we do. Yes, we provide picks like every other service out there, but we believe that teaching members to fish is every bit as important as throwing out a shopping list.
It has been an incredible 15 years for the equity markets. If we examine the annualized three-year return for the S&P 500 since 2012, it has consistently been above 10% and is currently over 20%.
That’s a long time for the equity markets to be consistently up. Investors have started accepting that such returns from equities are “normal” and that they should be expected. Yet, history tells us a different story. Consider that the all-time average for the S&P 500 is near 10%. In other words, returns from equities in the S&P 500 have been above average for 15 years and counting.
Many investors enter retirement with the plan of selling stocks for higher prices than they paid and using those gains to fund their lifestyle. The risk is that if prices decline, investors won’t have as much money as they think they have when they retire.
Here’s a look at rolling returns of the S&P 500 as measured by Vanguard 500 Index Fund;Investor (VFINX) since January 1985:
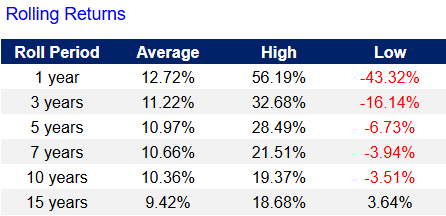
The current 15-year return is 14.86%. History doesn’t tell us this is normal. History tells us that this is well above average. For many investors today, 15 years accounts for the entirety of their experience in the market. Many investors, even on Wall Street, have never known anything different.
As a result, investors today feel invincible. They have accepted that the stock market “always goes up.” It’s something I’ve seen a few times over the decades. In the 1990s, there was a similar sentiment. In the 2000s, everyone was buying real estate and lending at 140% loan-to-value on houses because real estate would “always go up” – nothing “always goes up.” That simply is not how the real world works.
It’s important to keep in perspective that stock prices can go up in two ways. First, they can go up because the company is earning more money per share. That’s great because it means the company itself is growing, and whether it keeps going up is dependent upon the company’s ability to continue growing.
The second factor is valuation. This is the price relative to earnings per share. For each $1 a company is expected to earn over the following year, how much is that $1 worth?
In 2010, $1 in earnings in the S&P 500 translated to a share value of about $14. Today, $1 in earnings in the S&P 500 translates to a share price of about $22: Source
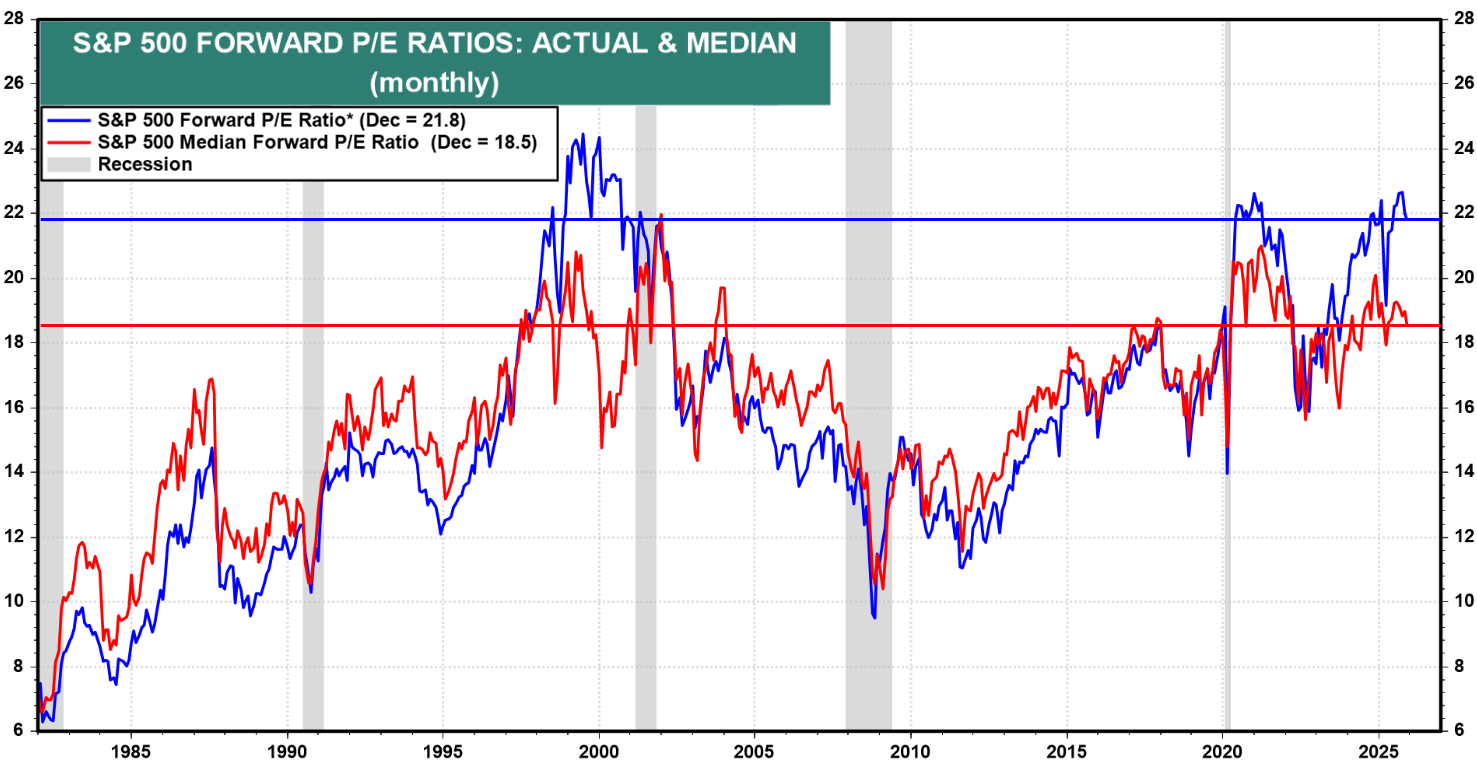
This is important to keep in perspective because while it’s plausible that earnings might continue to grow, it’s not plausible that valuations will continue to climb indefinitely. To get the same benefit of valuation expansion, the S&P 500 would have to climb to about 35x P/E.
Is that going to happen? Probably not. Realistically, one of two things will happen:
In short, it’s very unreasonable for a person retiring today to expect that their equity portfolio will continue to grow at a pace similar to what they’ve seen over the past decade. The risk that prices could materially decline cannot be ignored. In the past, the stock market has gone for 10-plus years without having any capital gains.
The plan of selling shares to fund your retirement is great if you can sell those shares at a higher price and higher valuation than when you bought them. It’s a plan that is very limiting if you are forced to sell shares at lower prices and lower valuations.
We approach the stock market differently from most people. When you retire, do you need $1 million, $2 million, or $5 million? No. You do not need a lump sum of cash, and if you have a lump sum of cash, odds are you are going to take that cash and invest it somewhere.
When you retire, you are losing an income stream. Specifically, the paycheck that you received on a regular basis and that you used to pay your monthly bills. The paycheck stops coming, but the monthly bills continue to come, and they will continue for the rest of your life. What you need is a source of cash flow that will cover those bills, and you need that source of cash flow to continue in perpetuity.
When we invest in the stock market, ultimately, we’re investing in businesses. If you were a landlord renting houses, would you sit there checking Zillow every month to see if you made money? Of course not. You check to make sure your tenants paid rent. If you’re running a restaurant, are you hiring an appraiser to assess the potential liquidation value every month? No. You’re looking at your revenue and expenses to determine if you’re making a profit. Anyone who owns and operates a business is going to be focused on the cash flows the business is producing. They aren’t constantly assessing it to determine what the business could be sold for today. They aren’t making decisions based on what they think the business might sell for in the future.
Why do we treat owning part of a publicly traded business differently?
Our goal isn’t to own a business that someone might pay us a higher price for in the future. Our goal is to own businesses that are generating significant recurring cash flows and are sending a portion of that cash flow to us in the form of interest payments or dividends. If we sell a stock, we’re just going to buy a different stock. We certainly enjoy it when that opportunity arises, but our primary goal isn’t that some fool will offer us a valuation that we think is entirely too high. Our primary goal is to generate cash flow from our portfolios that is substantial enough to fully replace the paycheck we lose when we retire.
The price that a stock is trading at only matters at two points: the minute you buy and the minute you sell. Every other price that falls in between is at best an interesting factoid.
We call our investment strategy the Income Method. It’s a strategy that focuses on investing in companies that produce significant cash flow and provide our portfolios with cash flow through interest and dividend payments. Our goal is to increase the cash that is flowing into our portfolio. We want enough cash flow that is high enough to support regular withdrawals and some excess so that we can reinvest. Reinvesting will help grow our income even if companies aren’t raising dividends. It also provides a cushion to ensure that turmoil in the market does not threaten our ability to pay bills. The electric company doesn’t care that the stock market is down or that dividends were cut—they want you to pay the bill anyway.

It isn’t a complicated idea, and it’s one that everyone who has ever managed a budget should be familiar with.
Does that sound familiar? It should because it’s what you’ve been doing your entire life. When you were working, you didn’t buy furniture so that you could sell it later to pay your rent. That would be silly. Yet in retirement, so many have readily accepted that you should sell assets, betting that the price of your remaining assets will grow fast enough that you won’t run out of things to sell.
Your retirement can be just like your working years. The only change is that your recurring income, which was being generated through your labor, is now being generated by the capital you have invested in stocks and bonds. You’re still generating an income, you’re still using that income to pay bills, and you’re still investing for your future. Instead of selling off assets every month, you are still buying more assets every month.
Some people would call that common sense.
The structure of the Income Method follows a few guidelines to ensure that we’re achieving our goals today and in the future. Getting a ton of income today isn’t useful if it isn’t sustainable. You can’t go out there and just buy the highest-yielding investments and expect things to end well.
Typically, we target having a portfolio that is producing an average yield of 9%. That’s a target that’s consistent with the long-term returns of the stock market. We expect that somewhere around 100% of our total returns will be coming in the form of interest/dividends, so we target an average yield that will be consistent with the long-term total returns investors can expect businesses to generate.
Nobody bats a thousand in the stock market. The reality is that you will sometimes make an investment that you thought had a safe income stream, and then something happens—the dividend is cut or even eliminated. When you were working, your income was likely tied to the one company you worked for. If you lost your job, you lost all your income until you found a new one.
Fortunately, as a retiree, it’s easy to diversify your income sources. We suggest a minimum of 42 different investments; we call it our Rule of 42. This means you have 42 different streams of income, so that if any one is disrupted, it isn’t a big deal.
Additionally, we suggest having a combination of common equities and fixed-income investments. The total return on common equities is often higher during periods like we’ve seen recently, where stock prices go up a lot. However, fixed-income like bonds and preferred equity will provide your portfolio with stable income year after year.
Investing as a retiree isn’t about getting the maximum possible. It’s about managing the risk to ensure that your portfolio has the best probability of meeting your needs.
When you look at stock market returns like the S&P 500, that’s always assuming you’re reinvesting 100% of your dividends and that you aren’t selling anything. When you’re in the building phase and working a career, that’s realistic. When you’re retired and using your portfolio as a source of income, that isn’t realistic at all.

Where a liquidation strategy means you are selling shares every year, the Income Method encourages you to use the interest and dividends your portfolio is producing to fund both your withdrawals and your reinvestment without selling a single share.
We suggest planning on reinvesting a minimum of 25%. So, if you want to withdraw $75,000/year from your portfolio, then you will need your portfolio to be producing over $100,000/year before you retire.

By reinvesting, you will own more shares and collect more interest and dividends next year. Allowing you to take out more to keep pace with inflation and providing a cushion in a Black Swan event like COVID-19.
When we make a decision to buy or sell investments, we look at it through the same lens that any business owner who makes decisions. What decision will make our income higher? More stable? Safer?
Sometimes, it isn’t possible to have everything. Maybe selling one investment to buy another will result in less income, but it’s something we judge to be safer. Or maybe we decide to take an intentional risk to buy something where the dividend is questionable but much higher. This isn’t different from any other investment style. Investing is about estimating the risk and balancing it against the potential reward and then determining what is best for you.
Some who follow the Income Method take a very conservative approach and focus on building up a large portfolio of fixed-income investments, avoiding any holdings that are “drama.” Others like to allocate a portion of their portfolios to “battleground” stocks where prices are very depressed, and yields are extraordinarily high.
Our job is to identify the opportunities and assess which investments will produce significant cash flow and which won’t.
The Income Method isn’t a “get rich quick” strategy. It isn’t an investment style that is trying to make homerun swings to see huge triple-digit returns. It’s a strategy that seeks to build an income stream methodically to reach a point where the interest and dividends are high enough to pay your bills, with an ample excess to reinvest so that you never have to sell an investment to survive. If you sell, you are selling because you believe there is an investment that is a better risk/reward.
We follow the macroeconomic news, but we don’t have to be reactive. We focus on the fundamentals of the companies we invest in. How much money are they making today, how much will they make in the future, and is the company going to continue providing a portion of those profits to us?
We take a long-term outlook and don’t worry about the short-term swings of the stock market. Our concern isn’t what someone in the future will pay for our shares – our concern is how much profit the businesses we own a piece of are going to generate. Valuations come and go, and right now they’re very high for a portion of the market. In our portfolio, we’re focused on the cash flow that we are collecting today, tomorrow, and next year. Whether the stock market is up or down doesn’t change our cash flow.
Stop treating your stocks like trading cards, hoping someone wants to pay more than you were willing to pay. Treat them like the businesses they are that are either producing cash flow for you or they aren’t.
Have a direction. Know what types of investments you are looking for and what benefit they provide your portfolio in the context of your overall strategy. Our method isn’t the only way to make money in the market, but it is the best strategy for us, and it’s a strategy that thousands have been able to successfully implement to achieve their goals.
A working example of Rule 2
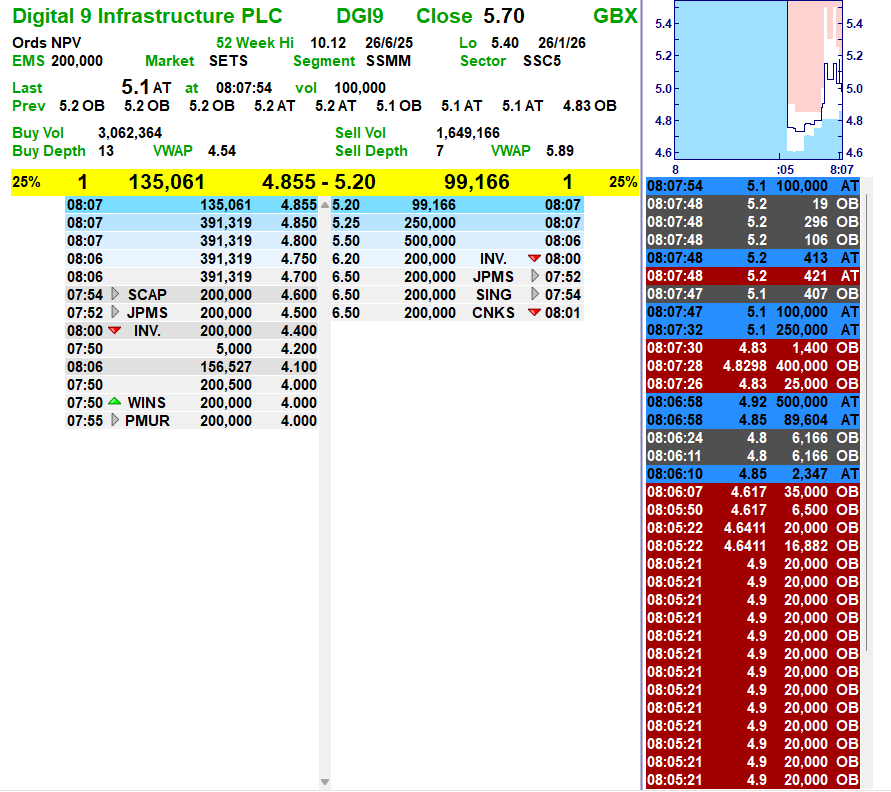
Digital 9 Infrastructure

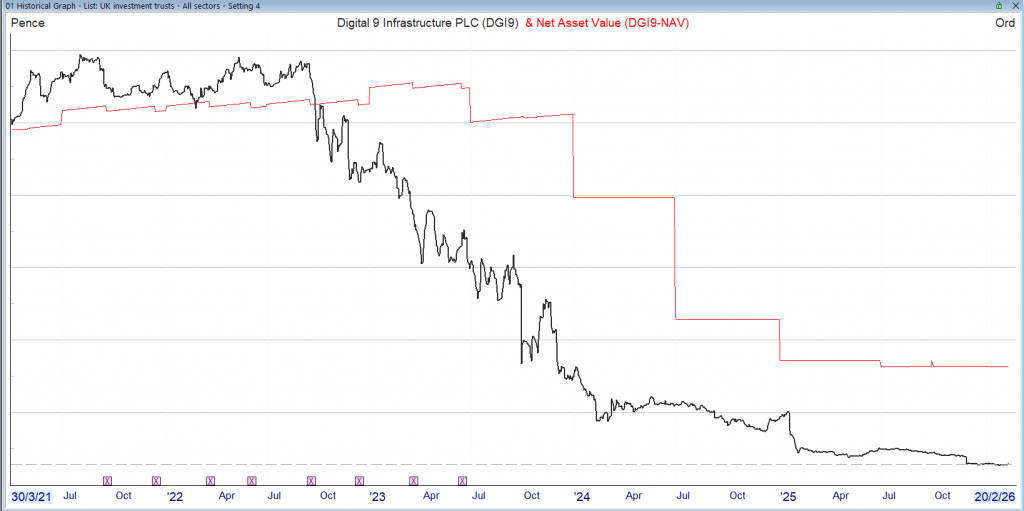
Although it would have been uncomfortable to take a loss, the funds could have been re-invested in another high yielder.
Thus avoiding the chance of a complete wipe out.

The SNOWBALL has a comparator share VWRP where if 100k had been invested in the ETF at the same time as the start of the SNOWBALL, the value would be £155,414, not too shabby.
The value of the SNOWBALL’s dividends are the only thing that is tracked as the intention is never to sell any of the SNOWBALL’s shares and live on the natural income. Remember to leave some of your capital to the local cat and dogs home.
The comparison is what ‘pension’ you could receive, we have already ruled out an annuity, although if you a pension pot of 1 million, you could take out an annuity and concentrate on spending your income. But for lesser mortals the comparison is using the 4% rule, although some research states that 3% would be better and then hope you don’t run out of money.
The latest figures for a pension would be
The SNOWBALL 10k
VWRP, let’s be generous and use the 4% rule £6,200
The gap should continue to grow, especially when the next market crash occurs.


Even starting from scratch at 60, investing £1,500 a month with a SIPP could build a pension pot worth close to half a million pounds! Here’s how.
Posted by Zaven Boyrazian, CFA
Published 7 February
You’re reading a free article with opinions that may differ from The Motley Fool’s Premium Investing Services.
When it comes to building a retirement nest egg, few investing tools match the power of a Self-Invested Personal Pension (SIPP).
When starting early, depositing as little as £100 a month can be all it takes to secure a much more luxurious retirement in the long run. But what about those starting later… much later?
An estimated one-in-six of people in the UK aged 55 and above don’t have any retirement savings beyond the State Pension. That’s despite it being nowhere near enough to live a comfortable retirement.
The good news is, even for a 60-year-old aiming to retire at 68, investing a good chunk of change in a SIPP each month can have a significant positive impact on retirement lifestyle. Here’s how.
Unlike other tax-efficient investing vehicles like an ISA, any money put into a SIPP receives tax relief. In oversimplified terms, that effectively translates into deposits being topped up by the government, refunding any income tax previously paid.
Sadly, when starting this late in life, some near-term sacrifices are going to have to be made. And if an individual can put aside up to £1,500, that’s when things get more interesting.
Assuming a 60-year-old is paying the 20% basic tax rate, a £1,500 monthly deposit translates into £1,875 of investable capital each month. And if a portfolio matches the stock market’s long-term average return of 8% a year, doing this for eight years will grow a roughly £251,000 pension pot.
Following the 4% withdrawal rule, that’s enough to earn an extra £10,000 on top of the State Pension, providing a lot more financial flexibility.
Please note that tax treatment depends on the individual circumstances of each client and may be subject to change in future. The content in this article is provided for information purposes only. It is not intended to be, neither does it constitute, any form of tax advice. Readers are responsible for carrying out their own due diligence and for obtaining professional advice before making any investment decisions.
Following the upcoming hike to the UK State Pension in April, this extra £10,000 would generate a total income of £22,547.60 a year. But by using a stock-picking strategy, investors could end up with a lot more.
Instead of trying to match the stock market’s 8% annual average with index funds, investors can aim to beat it by investing directly into the best businesses. And over the last eight years, that’s something Premier Foods‘ (LSE:PFD) shareholders have experienced first-hand.
Since February 2018, shares of the branded food producer have been on a bit of a rampage following a strategic pivot under new leadership. Including dividends, investors have earned a 394% total return. That’s the equivalent of a 22.1% annualised gain – enough to transform £1,875 a month into £485,190, or an extra £19,408 in annual retirement income (almost double!)
With around 90% of British households buying at least one of Premier Foods’ brands each year, the company has enormous market penetration in the UK. And right now, management’s seeking to replicate this success in new territories like Australia and North America.
Of course, international expansion carries significant execution risk. Its new target markets already have a wide range of established brands that the group needs to disrupt – a task that’s far easier said than done. And if it fails to deliver, the firm’s long-term growth prospects could be severely limited.
Nevertheless, with the leadership demonstrating its savvy capital allocation skills in recent years, Premier Foods may still be worth a closer look for investors seeking to build retirement wealth in a SIPP today.

Investors are going for a diverse range for their Stocks and Shares ISA choices as we get close to 5 April. Here are a few top picks.
Posted by Alan Oscroft
Published 10 February,

You’re reading a free article with opinions that may differ from The Motley Fool’s Premium Investing Services.
The ability to invest up to £20,000 in a Stocks and Shares ISA and not pay tax on any gains surely provides one of the best encouragements UK investors have. And there’s less than two months to go before time runs out to use up as much of our 2025-26 limit as we can.
In the early weeks of 2026, private investors are still piling their spare cash into UK shares. And more than any recent month I can remember, it looks like January was characterised by diversification. So what are the most popular stocks?
Please note that tax treatment depends on the individual circumstances of each client and may be subject to change in future. The content in this article is provided for information purposes only. It is not intended to be, neither does it constitute, any form of tax advice. Readers are responsible for carrying out their own due diligence and for obtaining professional advice before making any investment decisions.
According to interactive investor, Aviva (LSE: AV.) was the individual stock most bought by ISA investors in January, with Fresnillo second. The immediate attraction of Fresnillo seems apparent — it’s the world’s largest primary producer of silver. And few will have failed to notice how that metal has soared along with gold — though it’s fallen back from its peak of over $100 per ounce.
Fresnillo shares looks like they’ve been a bit of a short-term thing to me. Those who bought in January hit the highest-price month for silver ever. And that might turn out to be unfortunate timing.
I’m more impressed to see the persistent popularity of Aviva. Aviva is dull and boring, and very much a long-term investment in my view. It’s come through its painful refocus in good shape. And I’d rate it as likely to be less volatile than any stocks related to precious metals at the moment.
Oh, and Aviva has a forecast dividend yield of 5.7%. I like Aviva — it’s one of my own holdings.
My main fear is that a forward price-to-earnings (P/E) ratio of 14 might be a bit high. That doesn’t seem to offer a lot of safety margin in what can be a cyclical sector. And it could keep the share price back. But for the long term, it’s one of my top Stocks and Shares ISA considerations.
Scottish Mortgage Investment Trust was the most popular investment trust in January. And it regularly makes the top few places throughout the year. It shows UK investors want a taste of the Magnificent 7 tech stock action, but with a bit of diversification thrown in.
I can’t stress the importance of diversification enough. And it’s why I think newcomers to ISA investing should seriously consider starting with investment trusts. City of London Investment Trust is a popular ISA pick, for example. It holds a wide range of top UK stocks — including HSBC Holdings, Shell, Unilever… and a whole lot more.
Looking outside the UK, the US tech stock volatility of late has pushed Nvidia down the popular ISA rankings. But Microsoft made a new entry in interactive investor’s January list.
It’s easy to run out of ideas with the ISA deadline approaching. But looking around at what others are buying can help kickstart our thoughts. And every stock mentioned here has to be worth considering, in the right circumstances. Just as long as we diversify — or did I mention that already?

And

By Brad Thomas, Wide Moat Research
As I’ve said before, and I’m sure I’ll say again, avoid “sucker yields” at all costs.
For the uninitiated, a sucker yield is a dividend yield that looks too good to be true because – more often than not – it is. Put another way, it’s a dividend that’s just begging to be cut.
But that doesn’t mean that every high-yielding stock is a sucker yield.
The best high-yield opportunities typically occur when a company has durable cash flows and a disciplined balance sheet… but it has temporarily fallen out of favor for some reason.
In the case of real estate investment trusts (“REITs”), virtually the entire sector has fallen out of favor. The S&P Real Estate Sector came in dead last in 2025 – printing only 3.2% against the S&P 500’s 17.9%.
But here’s the good news…
That relative underperformance is concealing some strong companies. And the temporarily depressed share price means they have generous yields that are also reliable.
If we are in the early innings of a REIT Renaissance, then there’s a good chance these yields won’t be this high for long. Today, I thought we might have a look at some high-yielding REITs that can still let you sleep well at night.
Healthpeak Properties (DOC) is a health care REIT that owns 673 properties, including:
The company recently announced it was spinning off that latter collection to form a new REIT called Janus Living. Healthpeak will retain a substantial majority ownership in this venture, making the remaining shares available in an IPO that will probably take place before July.
Healthpeak will also serve as Janus’ external manager. This involves a $10 million annual management fee under an initial three-year term, with successive one-year renewal periods after that… all while receiving a pro-rata share of regular distributions.
So it’s no wonder that Healthpeak sees no problem with continuing its annual $1.22-per-share dividend after the IPO.
Now, a primary reason for the spinoff is that, based on DOC’s current valuation, it isn’t being rewarded for its premium housing assets as-is. Shares currently trade at 10.2 times compared with 40.5 times for Welltower (WELL), a pure-play senior housing REIT.
That enormous difference doesn’t make sense considering how Healthpeak’s MOBs and life-science buildings generate steady and predictable income. The company just reported earnings last night.
In the fourth quarter of 2025, funds from operations (“FFO”) per share was $0.47, exceeding consensus estimates of $0.46. For fiscal year 2025, adjusted FFO (“AFFO”) per share was $1.69 compared with an annualized dividend amount of $1.22 per share (payout ratio of 72%).
For all of 2025, Healthpeak saw new lease executions of 562,000 square feet and renewal lease executions totaling 889,000 square feet with 72% retention and up 5% cash releasing spreads on renewal.
But, as I wrote two months ago concerning pureplay life-science landlord Alexandria (ARE)… the life-science space has been hit hard with oversupply, even causing that impressive company to cut its dividend last year. So Healthpeak is suffering from association.
What critics don’t realize is that it’s actually held up decently despite the drama. Not perfectly, mind you, but decently.
For the record, Healthpeak’s fourth-quarter earnings did beat expectations. But lab occupancy declined 390 basis points (“bps”) sequentially on a backend-loaded basis to 77.1%.
The REIT issued guidance for the year as well, missing The Street’s adjusted FFO projection by 5.5%. And same-store life science NOI guidance specifically is now down 7.5% year over year.
On the plus side, DOC expects lab occupancy to pick up in the second half of 2026 with around 1.5 million square feet of leasing in its pipeline.
As the FAST Graphs chart below shows, DOC trades at 10.2 times price to AFFO (P/AFFO) compared to its normal 16 times multiple. At least it was trading that way last night. I’m sure the earnings news will have a further negative impact on its shares.
However, this all represents an attractive margin of safety – and with a well-covered 7.1% dividend yield to boot.
Just keep in mind that the actual company isn’t expected to grow much either this year – or next. As such, my best-case forecast is that DOC will return 20% in 2026 between its dividend and price appreciation.
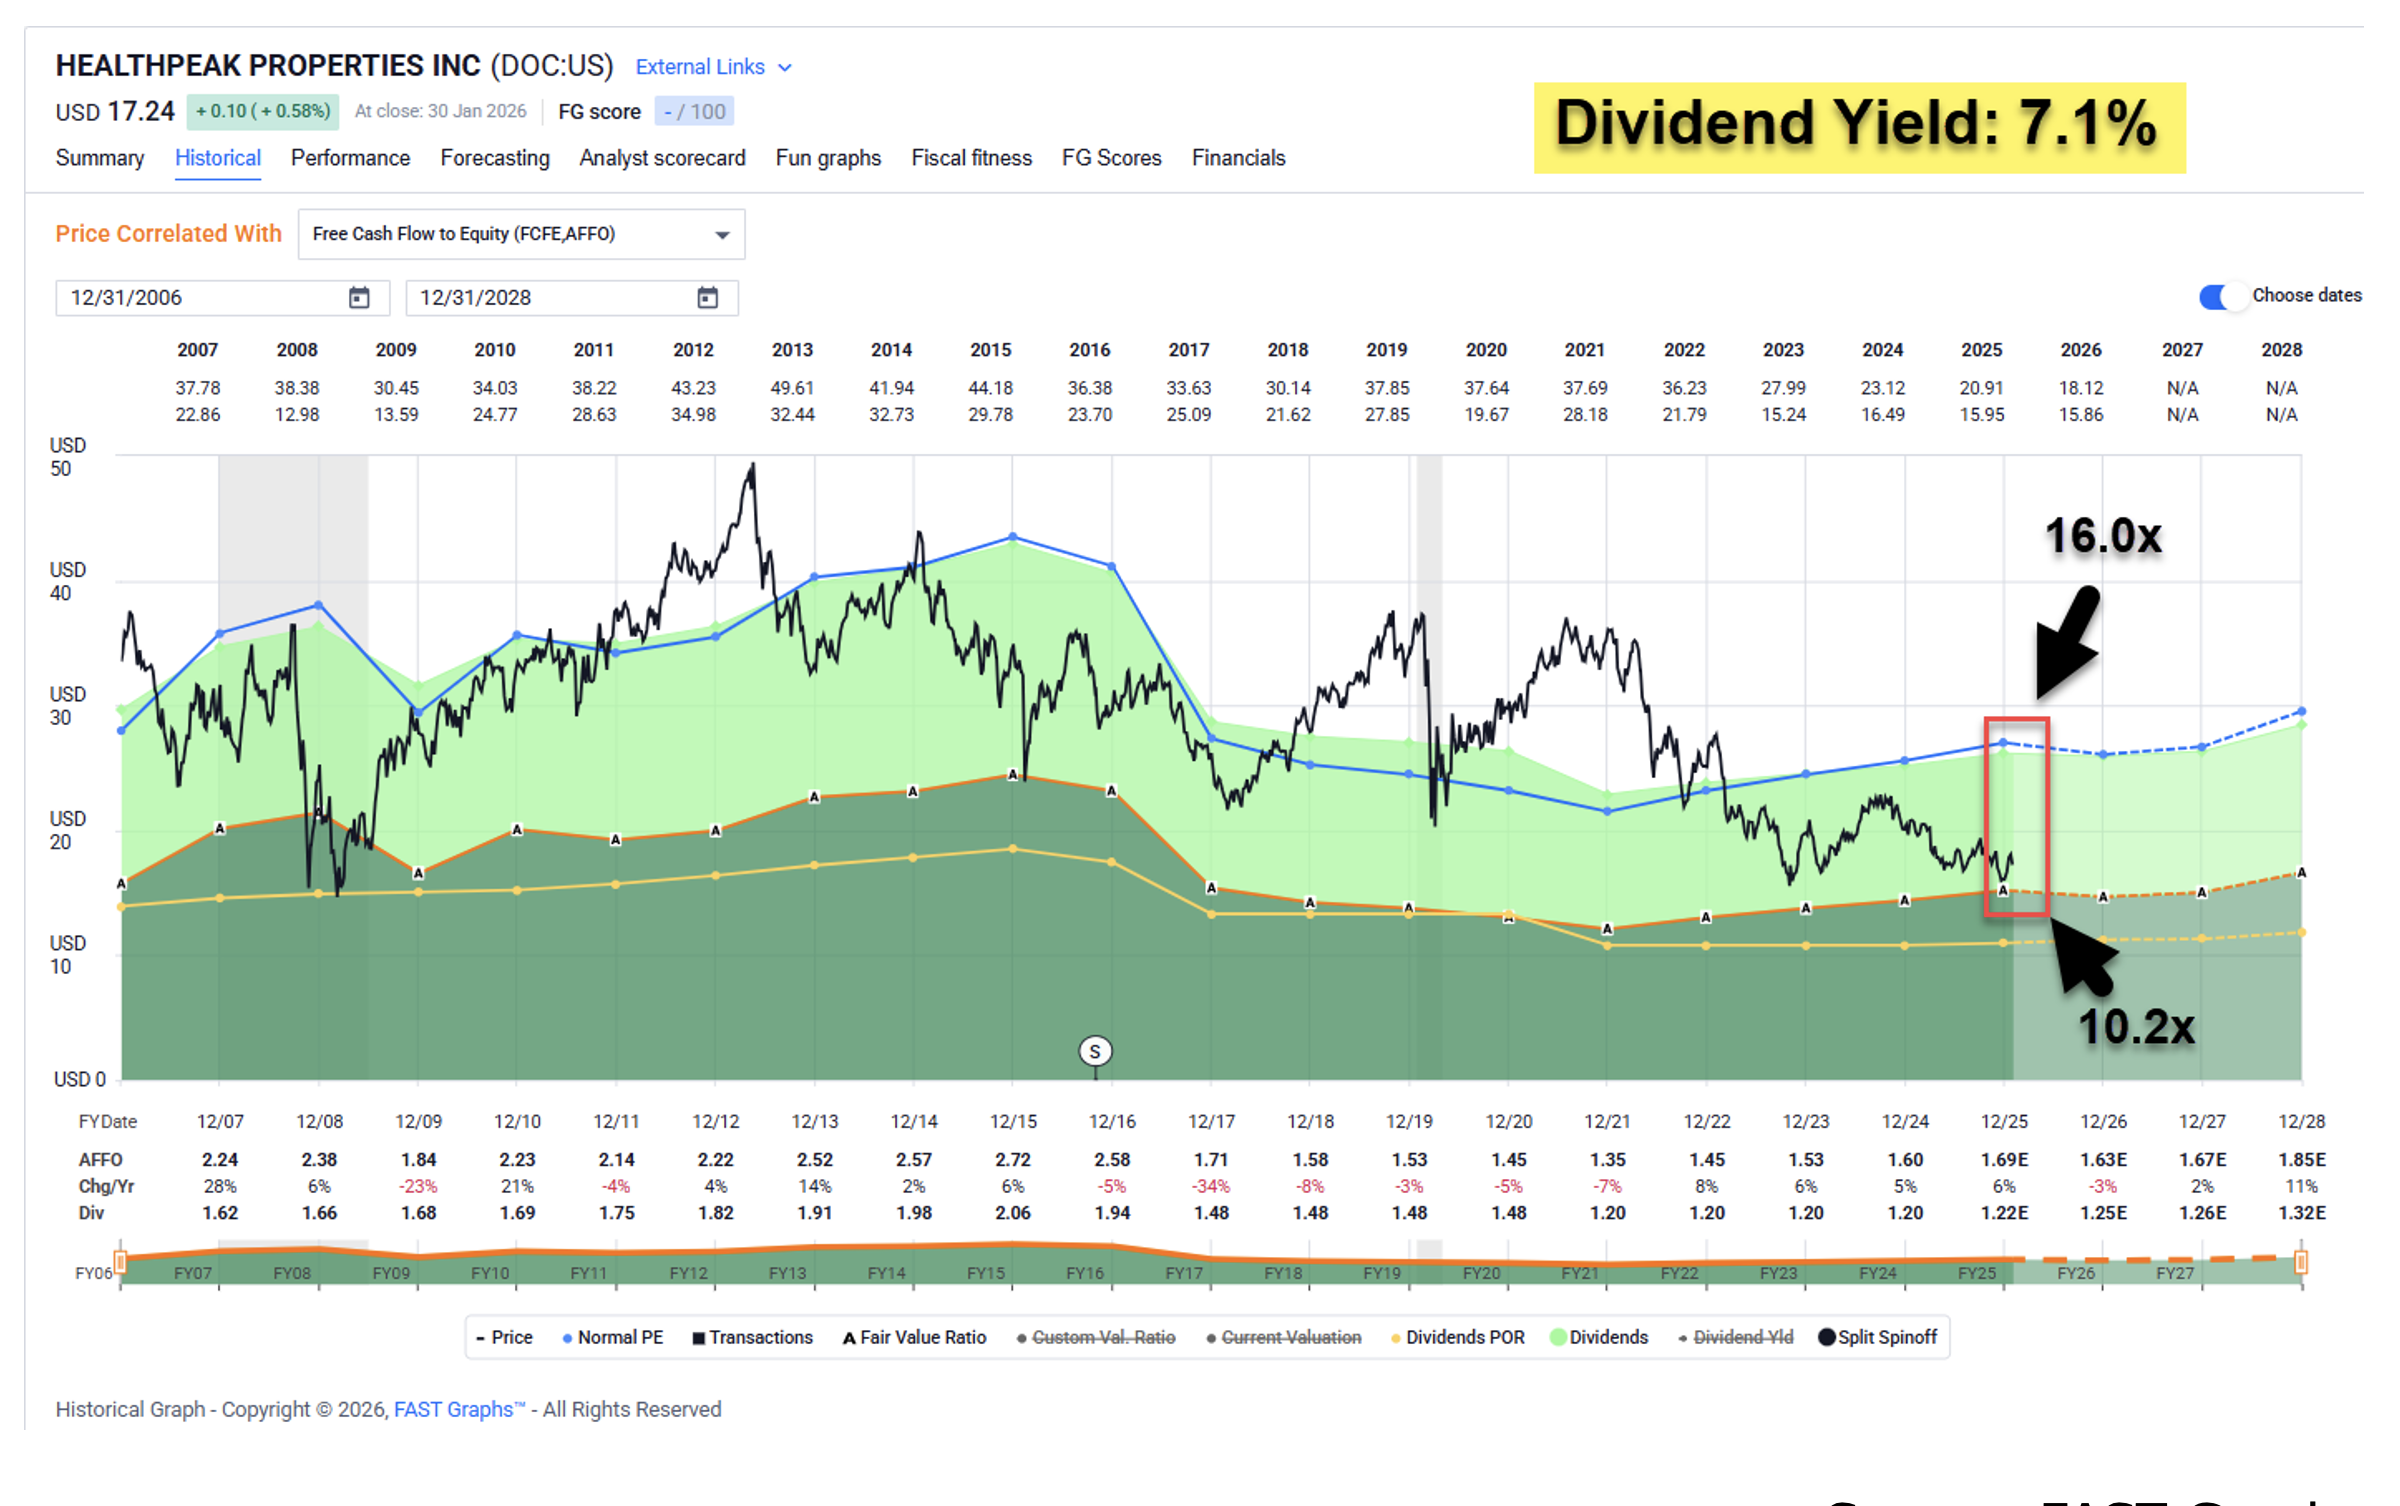
Source: FAST Graphs
I plan to interview Healthpeak’s management team later this week, information I’ll exclusively share with my Wide Moat Letter members.
VICI Properties (VICI) is a net-lease REIT with a target niche investing in experiential properties. Since Caesars Entertainment (CZR) spun VICI off during its bankruptcy reorganization, it’s become quite the growth story.
A world-leading gaming and experiential REIT, it boasts:
As shown below, VICI has a diversified asset base, though with outsized exposure to three large gaming tenants. Caesars generates 39% of its revenue, MGM Resorts (MGM) accounts for 35%, and The Venetian another 10%.
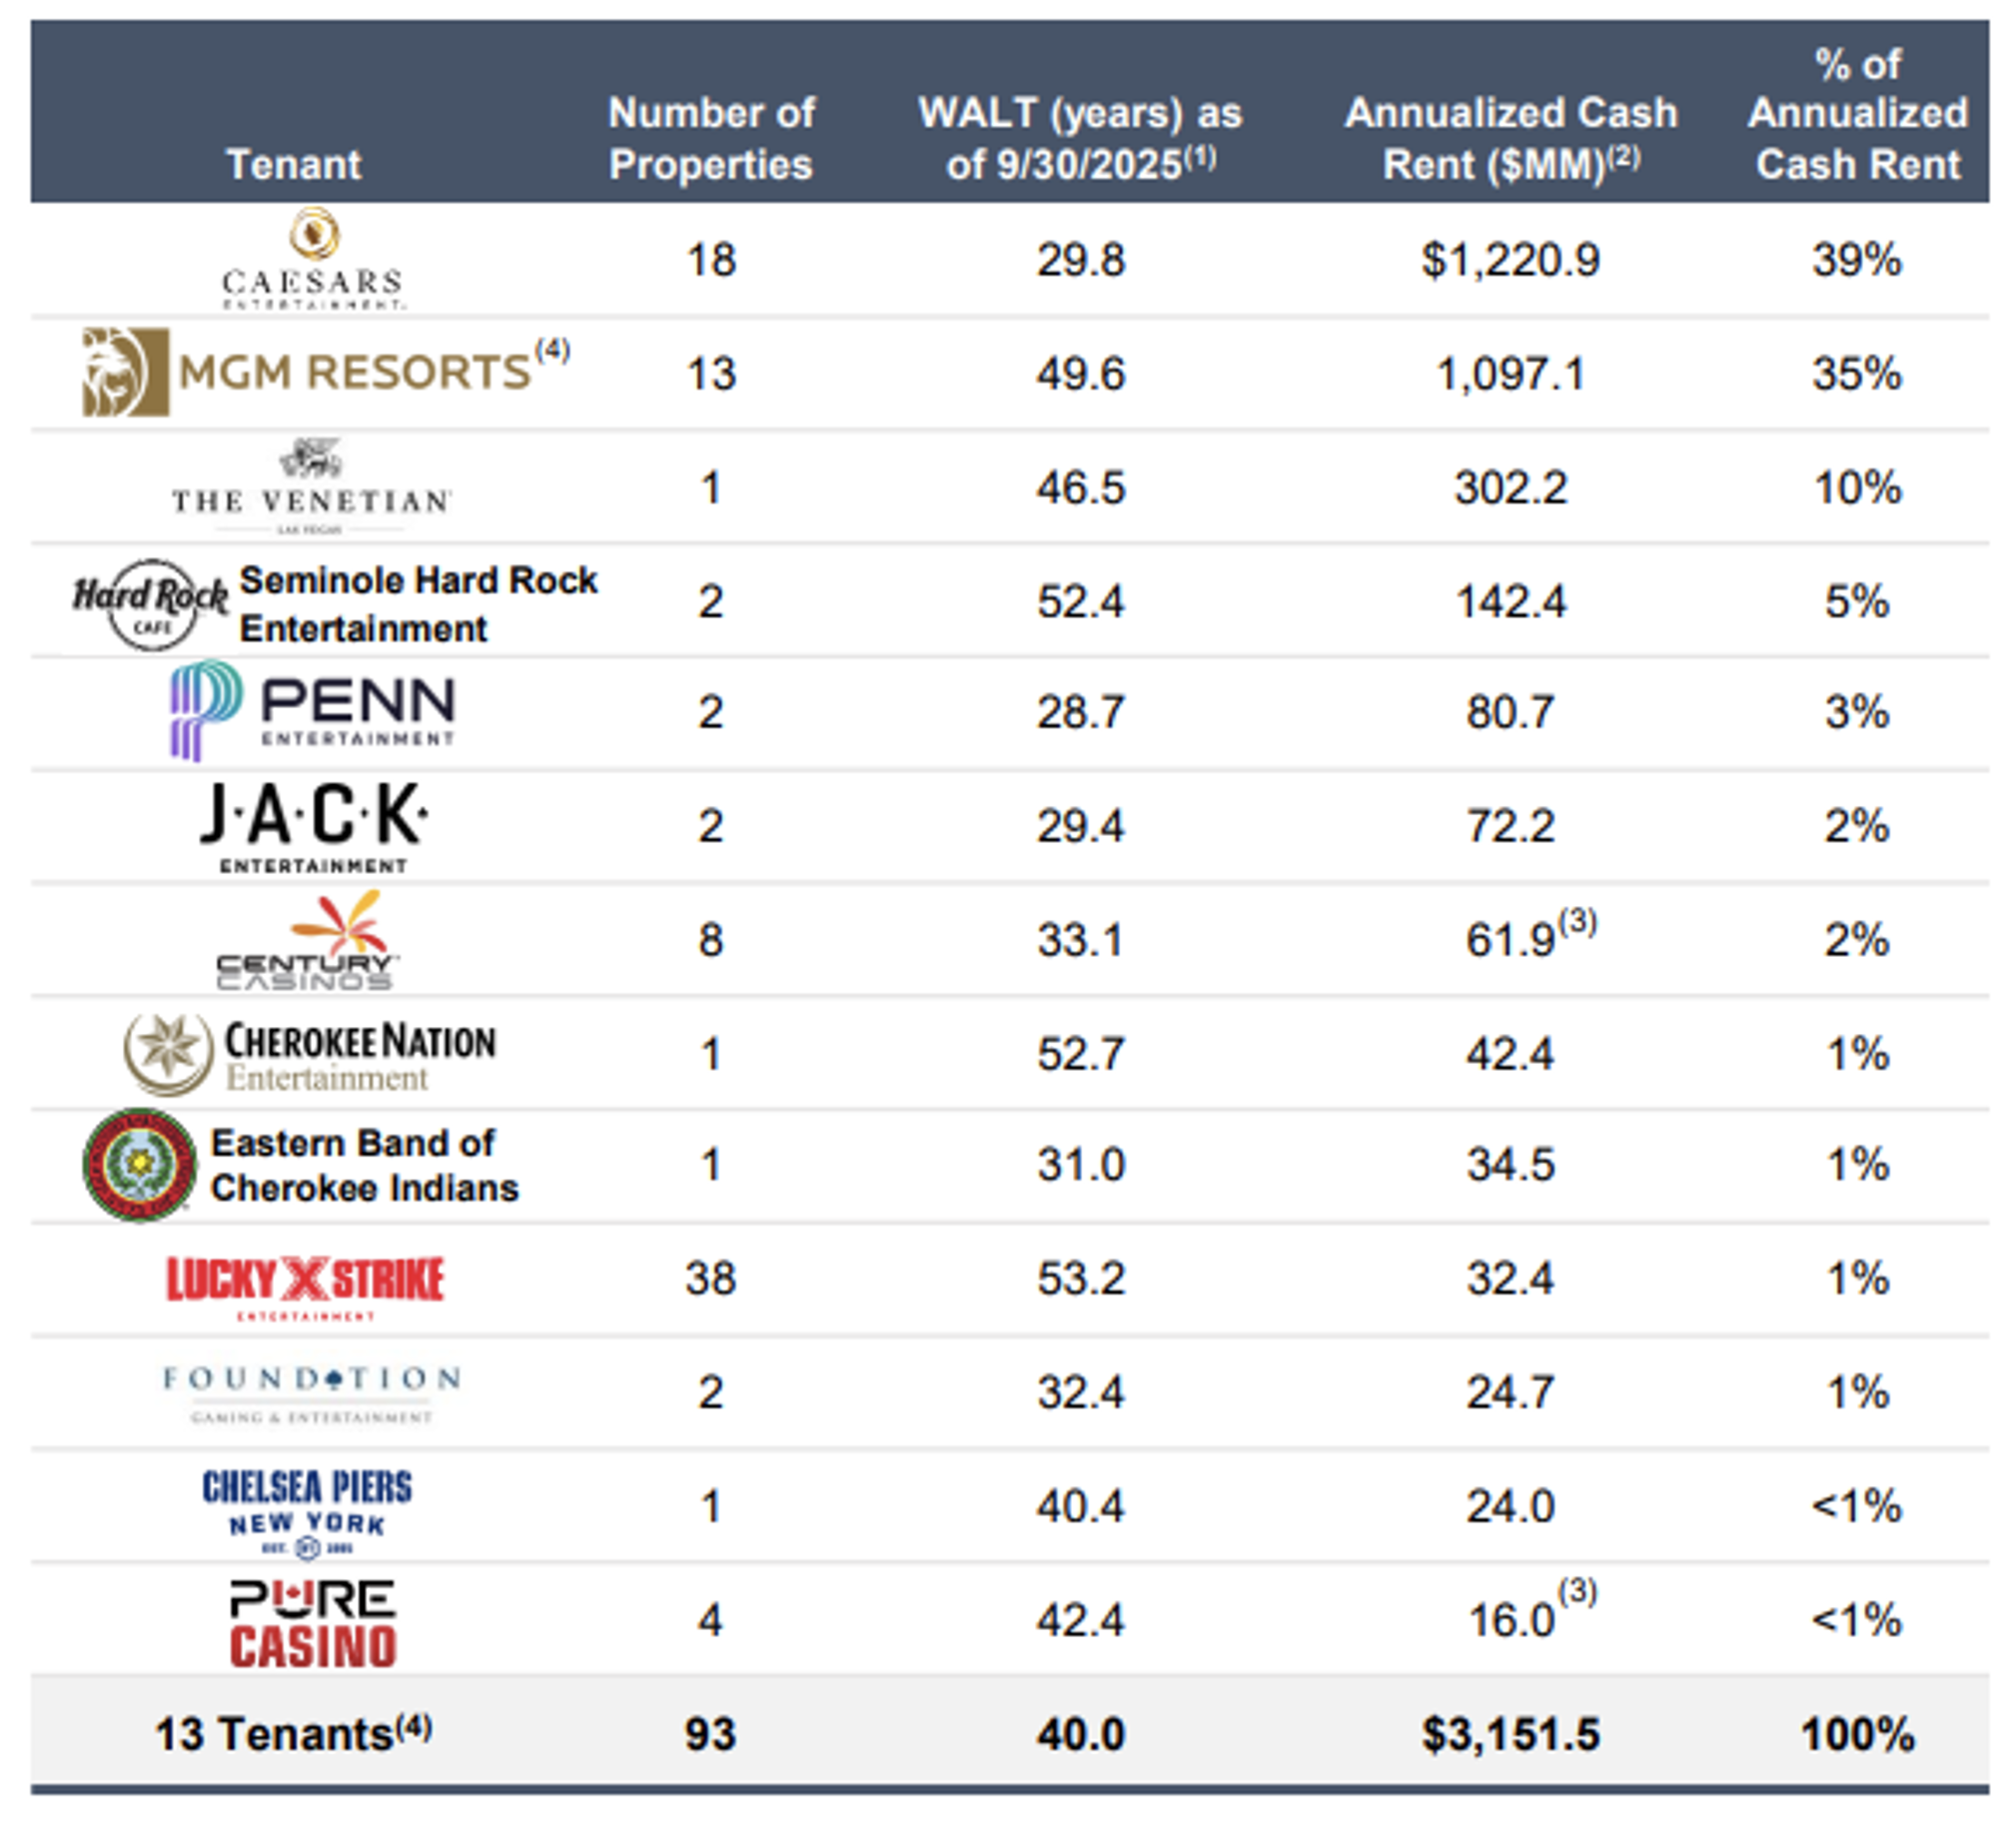
Source: VICI Properties
So it does face concentration risk. However, it also boasts multiple holdings in one of America’s most valuable, supply-constrained locations: The Las Vegas Strip.
This space is built out. You cannot create new comparable assets there without knocking something else down.
VICI owns 10 trophy assets on the Strip, including 660 acres of underlying land, 41,400 hotel rooms, and 5.9 million square feet of conference, convention, and trade show space.
It also owns 26 acres of undeveloped land strategically located adjacent to The LINQ and behind Planet Hollywood, as well as seven acres of Strip frontage property at Caesars Palace. All of these are subject to and part of a master lease with Caesars.
Here’s another thing going for VICI: Whether in or outside of Vegas, gaming licenses create regulatory barriers that keep competitors at bay. Casino operators must obtain state gaming licenses and comply with strict approval requirements… conduct background checks… and undergo regulatory oversight.
Put simply, you can’t just open up a new Caesars Palace across the street.
Also, VICI’s leases are typically signed for 30 to 50 years. They’re triple-net, too, which means the tenant pays taxes, insurance, and maintenance. That gives the REIT bond-like income, inflation protection, and minimal landlord responsibility.
In fact, VICI’s general and administrative expenses (G&A) as a percentage of revenue were just 1.6% in the third quarter of 2025. That’s the lowest you’ll find among its net-lease REIT peers.
Yet VICI shares are underperforming, trading at 11.8 times compared with their normal 15.4 times. This gives it a 6.4% dividend yield with a 75% payout ratio (using AFFO per share).
The primary reason for this devaluation is because of consumer sentiment in Las Vegas. Specifically, Ceasars has experienced a 28% decline in earnings before interest, taxes, depreciation, amortization, and restructuring or rent costs (“EBITDAR”) since 2021. Compared with 13% rent increases, coverage ratios have declined to 1 times.
That has left many investors nervous about where its landlord stands.
I visited VICI’s headquarters in New York City a few weeks ago to meet with the management team about all of this. As they pointed out, the leases in question are master-leased and corporately guaranteed by Caesars Entertainment.
Plus, VICI has taken prudent steps to maintain a disciplined balance sheet (rated BBB- by S&P and Fitch, and Baa3 by Moody’s). It’s also proud of the fact that it has consistently grown its dividend at a 6.6% compound annual growth rate (“CAGR”) since inception – the highest in the net-lease REIT sector.
That’s a track record it takes very seriously and works very hard to build upon.
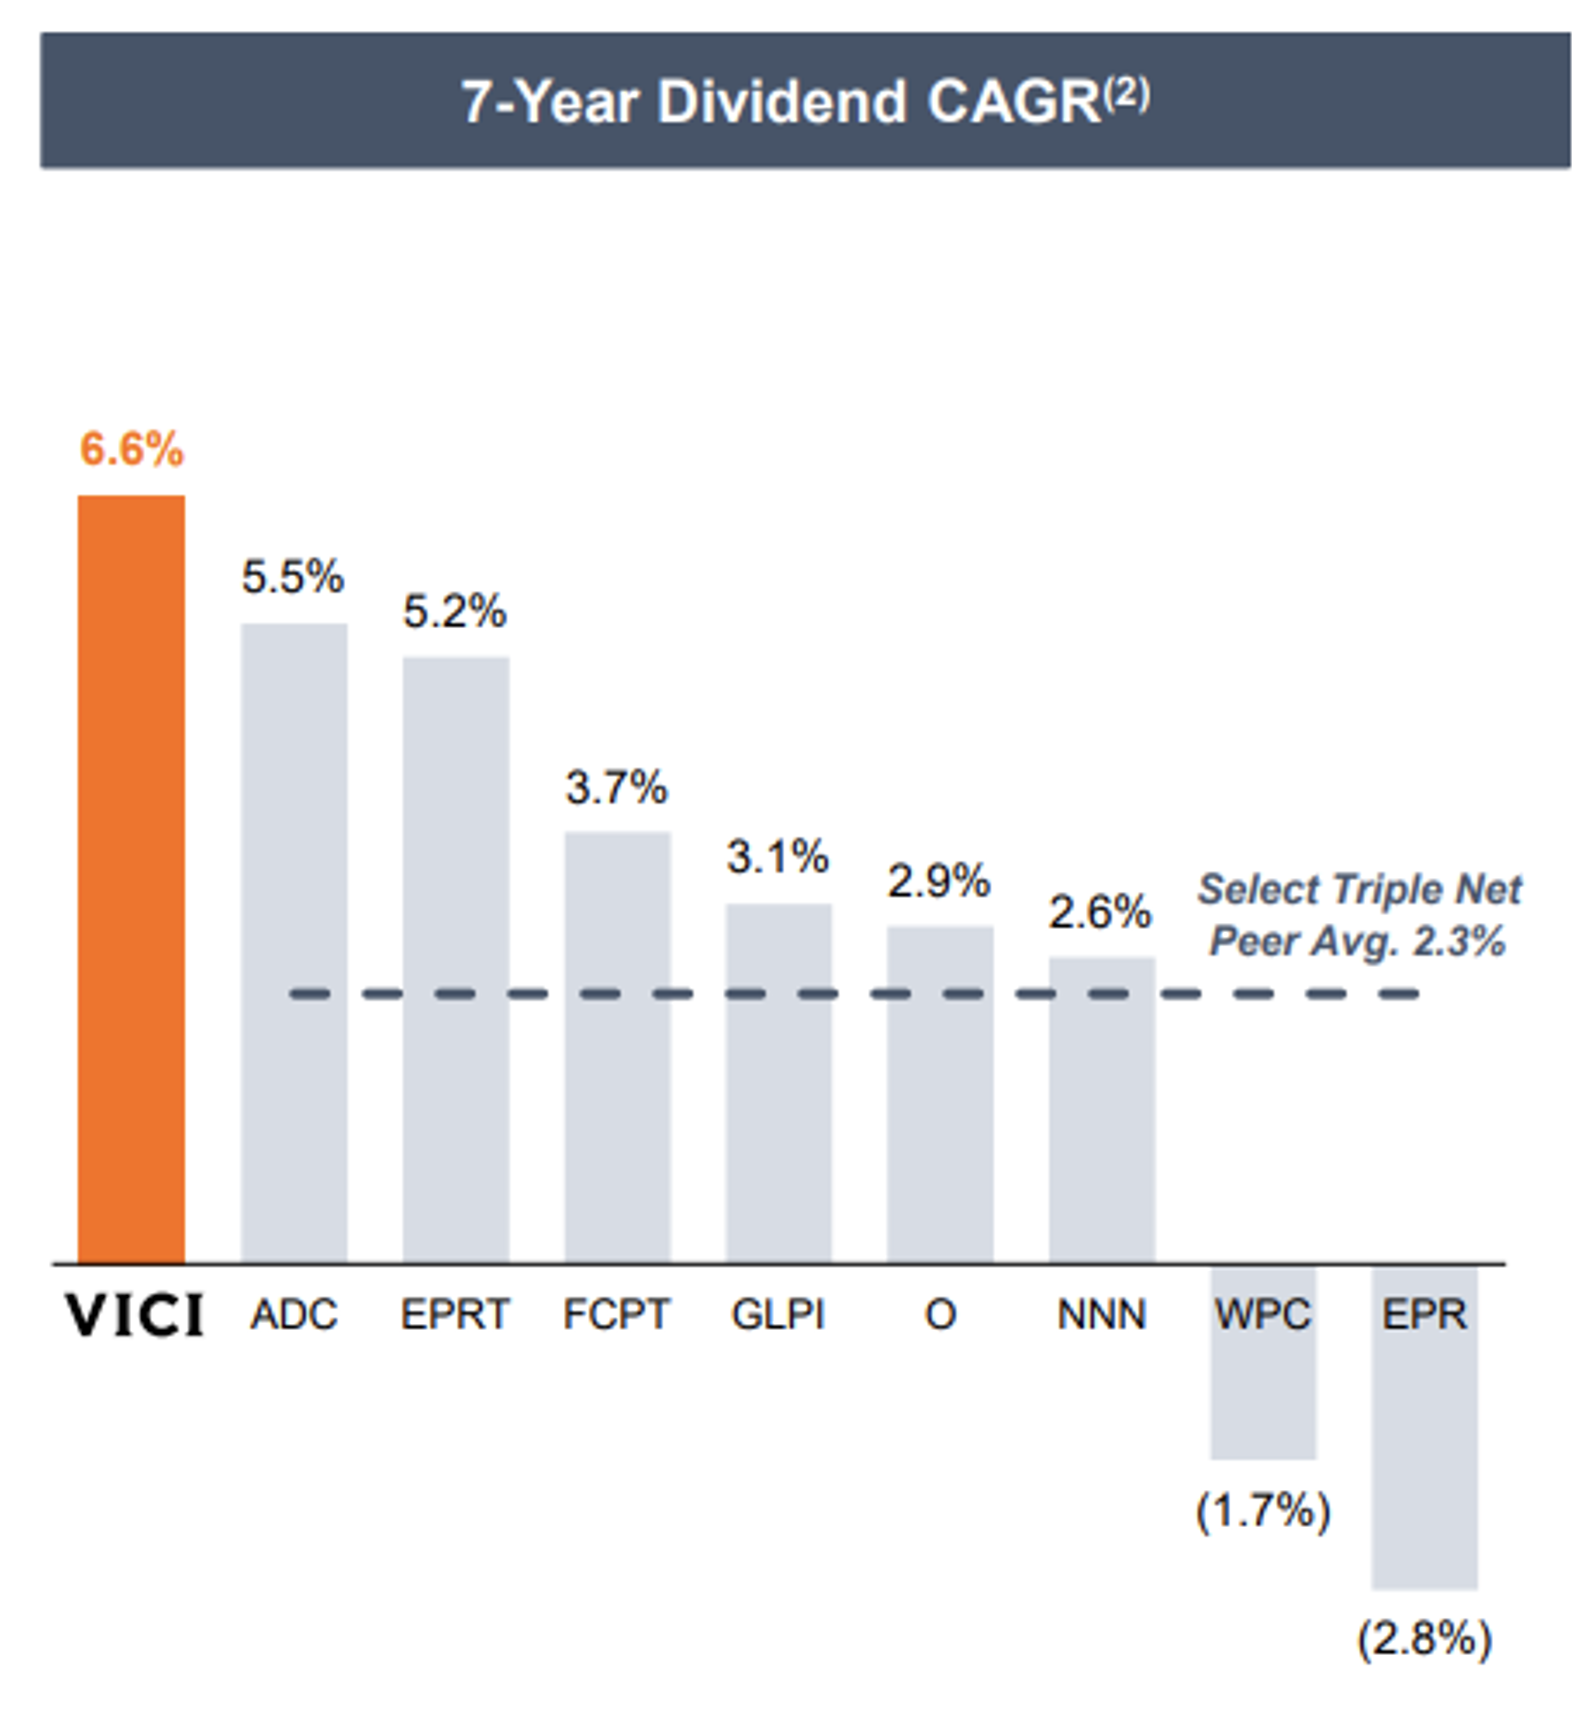
Source: VICI Investor Presentation
As a result, I believe VICI’s underperformance is a buying opportunity. Analysts forecast growth of 3% in 2026 and 2027. Between that, its 6.6% yield, and 15% discount, we estimate shares could return 25% over the next
© 2026 Passive Income Live
Theme by Anders Noren — Up ↑