Warren Buffett once called these stocks’ dividend growth “as certain as birthdays.” Here’s how they’re doing.
Story by William Dahl
Key Points
- In his 2022 annual letter, Warren Buffett invited readers to “peek behind the curtain” to understand Berkshire Hathaway’s success.
- Almost immediately, he singled out two stocks.
- Three years after he called their dividend growth “as certain as birthdays,” their payouts have risen by 21% and 91%.
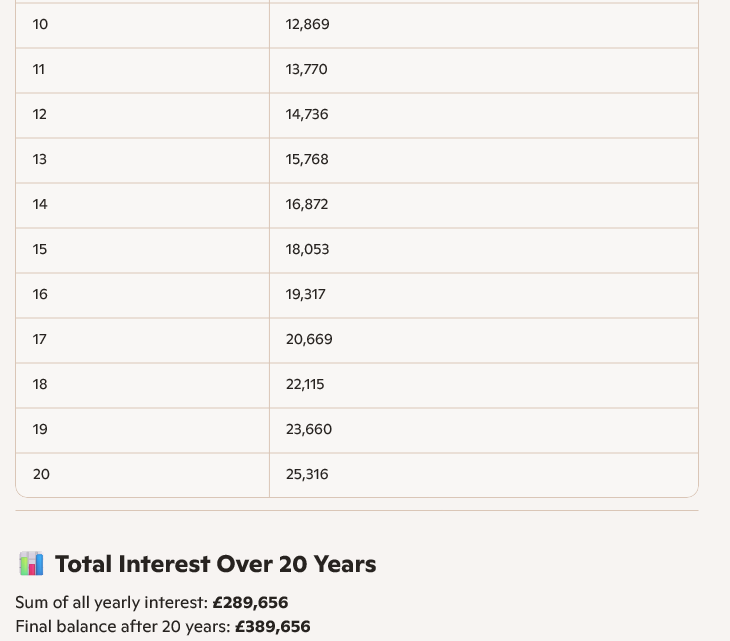
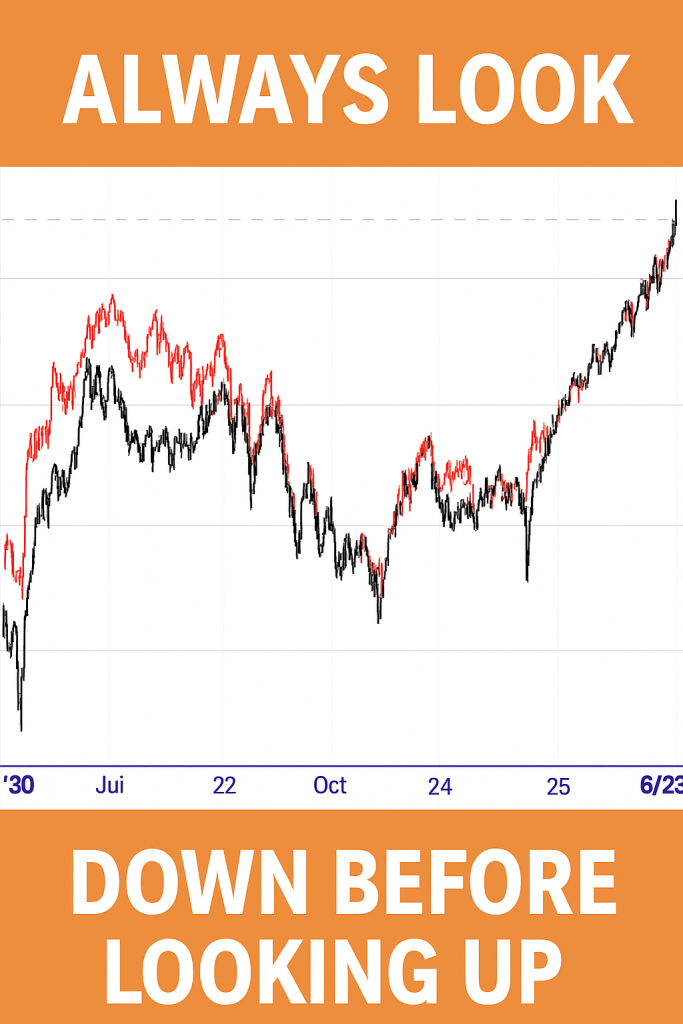
In his 2022 annual letter to Berkshire Hathaway shareholders, Warren Buffett had no shortage of good news to tout. Since he took the helm of Berkshire in 1964, the conglomerate had notched a 3,787,464% gain, compared to 24,708% for the S&P 500 — enough to turn every $1 initially invested into $37,875.
Yet the first number he brought up, apart from calling his capital allocation decisions in his 58-year tenure “so-so,” was to cite two investments that he said were central to Berkshire’s success.
These two companies, each of which Berkshire coincidentally had invested $1.3 billion into, now paid annual dividends amounting to almost half of Berkshire’s initial investment. This yield on cost was, Buffett predicted, highly likely to grow thanks to dividend hikes.

A line of hundred dollar bills seemingly sprout from the ground.© Getty Images
Of course, this was more than three years ago. What were the two dividend stocks that Buffett felt deserved a special mention? And was his confidence in them well-placed?
1. Coca-Cola
Buffett established his position in soft drink giant Coca-Cola (NYSE: KO) over a seven-year period, buying his 400 millionth share in August 1994.
He hasn’t bought a share since, but neither has he sold. And there’s a good reason.
In 1994, Berkshire was receiving $75 million a year in dividends from Coca-Cola. During the next 28 years, as the dividend increased each year, that number swelled to $704 million in 2022.
Today, Coca-Cola shares yield 2.8%. But while the $1.3 billion Buffett paid for his investment remains fixed, the annual dividend’s continued growth pushed his yield on cost up to almost 50%. That’s a remarkable feat considering that the S&P 500 has averaged annual returns of 10.5% during the past 70 years.
And since Buffett’s 2022 letter, the dividend had been boosted each year as he predicted. Those 400 million shares now pay Berkshire $206 million a year in dividends, at least until this March, when the company’s next quarterly dividend will go out after its expected 64th annual dividend increase.
2. American Express
Today, American Express shares yield less than 1%, as a 191% gain in share price during the last five years has pushed the yield down. But to Buffett, I suspect his yield on cost is far more important. Annual dividends, which totaled $302 million in 2022, have now grown to $577 million, or almost half of Buffett’s initial investment.
Can they keep it up?
Coca-Cola’s management doesn’t release dividend forecasts. However, with more than 50 years of dividend growth to its name, it has won the title of Dividend King, which barely one in 1,000 companies have achieved. Because management will be loathe to give that up, it’s very likely to announce yet another dividend hike next month, especially since it achieved robust earnings growth of 30% year over year last quarter.
Cruise Deals – We Won’t Be Beaten On Price – Cruise 118 | Cruise Holidays
In the case of American Express, the company increased its annual card fees for the 29th consecutive quarter in Q3, and we’ll see if the trend persists in its Q4 earnings call scheduled for Jan. 30. With earnings up 19% year over year, the company should have no difficulty raising its dividend, especially considering how its $2.3 billion in share repurchases means that the company will be mailing checks on fewer shares
With fundamentals and track records like these, you can see why Buffett highlighted Coca-Cola and American Express as examples of “the secret sauce” behind Berkshire’s stunning success. And as in 2022, their payouts look highly likely to rise in the years ahead.
If you haven’t got 40 years to your retirement, investing in shares that yield 1.8%, will not pay for that cruise you promised yourself, so you will have to take a higher risk and buy shares that have a higher starting yield.