Investment Trust Dividends
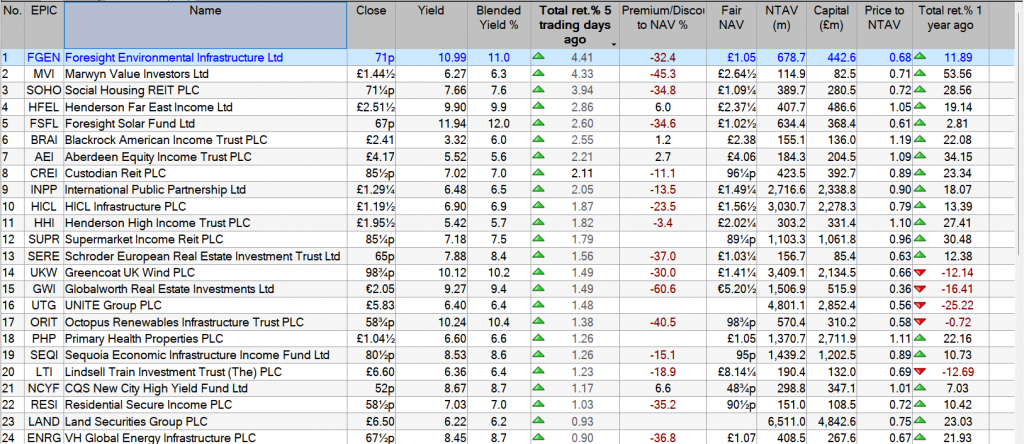
I’ve bought for the Snowball a further 1486 shares in FSFL for 1k.

I wanted to open a new position in the Snowball but that will have to wait, until later when markets flip over, until then


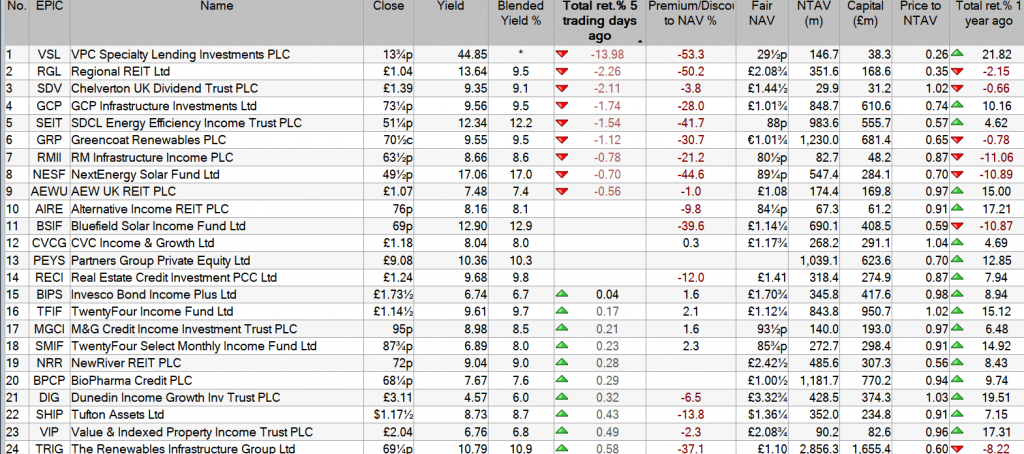
I’ve bought 1275 shares in DIG for 4k, completing the Snowball’s position in the share.
Cash for re-investment £3,532.00


I’ve sold the Snowball’s shares in BRAI for a short term profit of £302.00, mainly because I never managed to buy a full position before the share price rose.
A share I will most probably come back to.
Brett Owens, Chief Investment Strategist
Updated: January 14, 2026
Wall Street, please. Enough with the narratives.
CNBC and Bloomberg have become the ESPN and Fox Sports of the financial world. Stories are simplified, spun and spoon-fed to the audience.
We thoughtful contrarians can’t stomach this junk any longer!
These “experts” have vanilla investors sweating every headline. The always-impending recession. Job losses. Trade wars. Geopolitical battles. Domestic political dysfunction.
Sure, there’s a kernel of truth to every story. But investors who ride this roller coaster suffer heart palpitations and (worse!) retirement portfolio underperformance. They get scared stiff by the media coverage, sell stocks at the wrong time (near lows) and stay on the sidelines for too long.
Most investors are terrified of a recession because they own things people stop buying when times get tough. We own the things people literally cannot live without—like lunch.
Regardless of what awaits in 2026, people are going to eat. In my Hidden Yields, we played this “three meals a day” trend exactly one year ago and bought the company that processes the corn that goes into everything in the grocery store, Archer-Daniels Midland (ADM).
ADM is a “boring” company that prints cash in any economy. As the broader market chopped and churned over the past 12 months, this underappreciated food trade delivered 26% total returns to HY subscribers. No heart palpitations, just dividends (including one raise!) and price gains:
People Keep Eating, ADM Returns 26%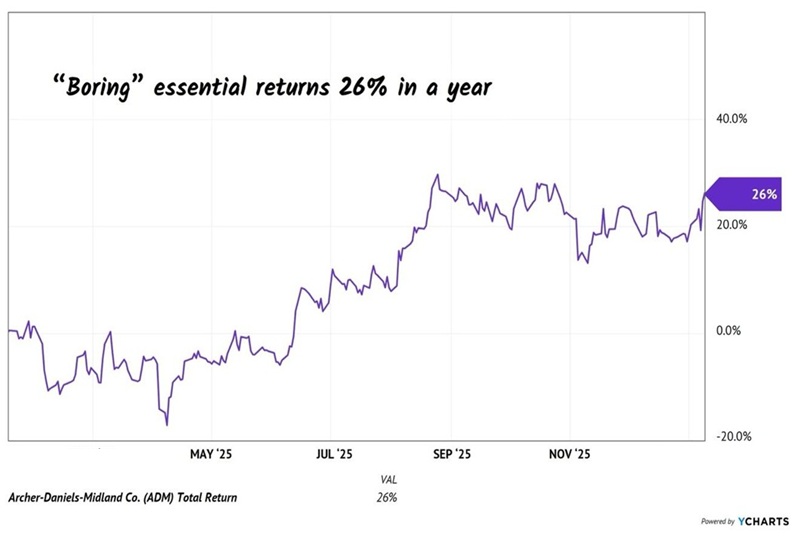
If you missed that run, I’ll share some good news—you have a second chance. ADM has pulled back in recent months, presenting us with a sweet opportunity to reload for 2026.
The stock topped out in late summer because Wall Street was concerned about low “crush margins,” industry jargon for the profit ADM makes from processing soybeans into meal and oil. Vanilla investors incorrectly saw this as a negative trend and sold the stock.
We careful contrarians know better. Agricultural markets move in predictable cycles. When corn prices are high, farmers plant more acres to chase the profit. That new supply floods the market, prices drop and farmers then plant less or switch crops (to cotton, for example).
Corn and soybean prices have come down in recent years, and the “dumb money” is fleeing the sector. This is exactly when we buy—at a cyclical low, with catalysts lining up to send related plays like ADM higher again.
Because recession or not, people keep eating. The global population is still climbing, adding millions of new mouths to feed every year. Developing nations are becoming wealthier and, with their money, people demand protein.
Raising chickens, pigs and cattle requires massive amounts of feed—mostly corn and soy meal. It takes about six pounds of feed to produce one pound of beef. This “multiplier effect” sets a floor on the corn and soybean fee inputs going forward and, guess what? They’re already about as low as they’re likely to go. It’s not a matter of if grain prices turn higher. It’s when.
Two previous worries for ADM are likely to turn into catalysts. First, policy. The EPA proposed a new Renewable Fuel Standard rule that includes higher biomass-based diesel targets. If approved, this will boost demand for corn and soybeans—and quickly improve those crush spreads. More profit for ADM.
Second, the business is getting leaner, cutting $500 to $700 million in annual costs over the next three to five years. While we wait, this “shareholder yield” monster is maximizing our future profit per share. Management’s aggressive share repurchases power a higher stock price. Over the last five years, ADM has reduced its share count by a fantastic 14%.
These “disappearances” are the quiet driver of total returns. They are the reason we earned 26% in a quiet year for crops. When ADM buys back its own stock, it reduces the number of shares outstanding. Every remaining share then owns a larger slice of the profit pie. This is how earnings per share (EPS) can increase, even if total earnings stay flat.
As we speak, ADM is using this “mini dip” in the stock price to buy back even more stock on the cheap. These smart shoppers know their stock is cheap and they are gobbling it up before crop prices rally.
Finally, there’s the dividend. ADM is a “Dividend King,” meaning it has raised its payout for more than 50 years in a row. Which means that through the inflation of the 1970s, the dot-com bubble, the Great Recession and COVID, ADM never missed a raise.
Last 20 Years of Dividend Kingpinning
I imagine it’ll do just fine through ’26, too—bull or bear!
ADM checks all the boxes we look for in Hidden Yields. Its products are essential. It’s boring. It’s bulletproof. It has plenty of upside and it generously pays us a 3.5% yield while we wait. And by the way, ADM is due to hike its dividend in the weeks ahead, making this is our last chance to “front run” the raise. Let’s not dilly-dally!
And ADM isn’t alone. I have identified five more “essential” stocks that are trading at similar valuations to where ADM was last January. These are recession-resistant dividend growers that are positioned to return 15% (or more) in the year ahead, regardless of what the economy does.
These are not the stocks you’ll see discussed on CNBC. They are too boring for TV! But they are exactly the kind of stocks that build real retirement wealth.

The AI Bubble Is Overblown (But This 10.6% Dividend Wins Either Way)
by Michael Foster, Investment Strategist
Is 2026 going to be the year the AI “bubble” finally bursts?
Maybe my use of quotes there tipped you off to my true opinion: Worries about an AI bubble are vastly overdone.
And today we’re going to grab a 10.6%-paying closed-end fund (CEF) that wins either way: If I’m wrong and there is an AI bubble (that pops), cash will flow into it. If not, that’s fine: We’ll happily collect its growing 10.6% payout.
From Silicon Valley to Wall Street
Of course, the AI CEOs agree with me that there is no AI bubble: Sam Altman, Elon Musk and the heads of Microsoft (MSFT), Meta Platforms (META), Alphabet (GOOGL) and Oracle (ORCL) are all bullish and willing to spend trillions on the tech.
But another group also agrees that AI-bubble fears are overdone: a cadre of hedge funds and institutional investors that regularly hold tech titans like Musk, Zuckerberg and friends accountable – and know the “plumbing” of the tech world even better than the billionaire set does.
You can see what I’m talking about here in the fight between Elon Musk and institutional investors over the latter group short-selling stocks like Tesla (TSLA). Musk has complained about this repeatedly, but this short selling does give companies an incentive to do better, so their stocks don’t end up shorted. A kind of accountability emerges as a result.
Coatue and the Tech Hedge Fund World
All of this brings me to Coatue Management. It’s a tech hedge fund that began during the dot-com bubble and not only survived but grew from $45 million in assets at its launch to about $70 billion today.
Over that time, Coatue has shorted many tech stocks, so it has experience in keeping corporate managers from getting tied up in indulgent behaviors that lose money for investors. Coatue also has plenty of experience with bubbles.
So when Coatue dismisses talk of an AI bubble, we should listen. And that’s exactly what it did late last month, when it posted this chart:
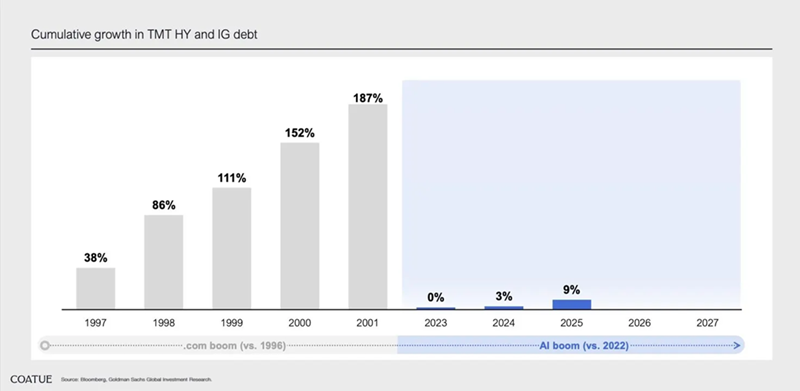
Here we see that over the last three years, there has been surprisingly little growth in the amount of money invested in corporate bonds issued to fund the tech, media and telecom sectors. (That’s the “TMT” in the title – those are the companies like Google, Microsoft, Meta and Oracle.)
The 0%, 3% and 9% gain in total debt issuances from 2023 to 2025 in these sectors suggest the bond market is not overly exposed to AI, and that there’s still a lot of room for debt to grow. Also, the comparison with the dot-com boom’s surging debt growth (on the left side of the chart) tells us the current situation is likely not a bubble – at least not yet.
To be sure, private debt and creative financing of some AI projects means a lot of AI borrowing isn’t shown on this chart. But that was also true of the dot-com era. And estimates of both again show we’re far from a bubble today.
But even if we were, the fact remains that corporate bonds are not overly exposed to AI. Moreover, bond holders tend to demand more discipline around costs.
The AI Hedge Move
If the corporate-bond market isn’t overly exposed to AI, then any volatility prompted by AI-bubble worries will likely drive cash from stocks to corporate bonds. That makes the corporate-bond market the perfect hedge for anyone worried about a selloff.
There’s just one thing: AI bubble fears are fading and have been since they peaked in November, at least according to internet search traffic.
AI Bubble Fears on the Backburner – for Now

I know what you’re thinking. “Markets are calm. AI bubble fears are fading, so why worry about this now?” The low fear means the market is not pricing in the potential of investors looking to hedge against AI in the future. That’s left corporate bonds cheaper than they should be.
In other words, we can buy into bonds now that the market isn’t hedging, wait for any stock volatility to boost demand for said bonds, then sell those bonds to investors.
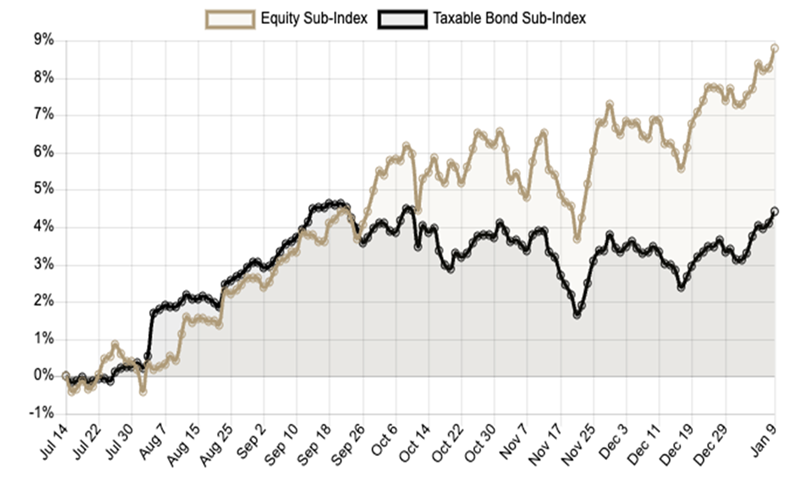
Take a look at this chart.
Bond CEF Underperformance Highlights Our Opportunity
Source: CEF Insider
I started 2025 bullish on corporate bond CEFs until September, when we sold three of these funds from our CEF Insider portfolio.
The reason is in the chart above: September was when CEF Insider‘s corporate-bond-fund subindex (in black) began lagging its equity-fund subindex (in brown). So CEF Insider focused more on equity funds, which have outperformed since.
Now that bond funds are on sale, and stand to gain on any short-term worries over an AI bubble, it’s time to cycle back to some of them. But how? Through a CEF, of course!
Buying corporate bonds individually is difficult, and bond ETFs typically underperform. But a CEF like the BlackRock Corporate High Yield Fund (HYT) is a great way to buy in, both now and over the next few weeks.
HYT Clobbers Its Benchmark
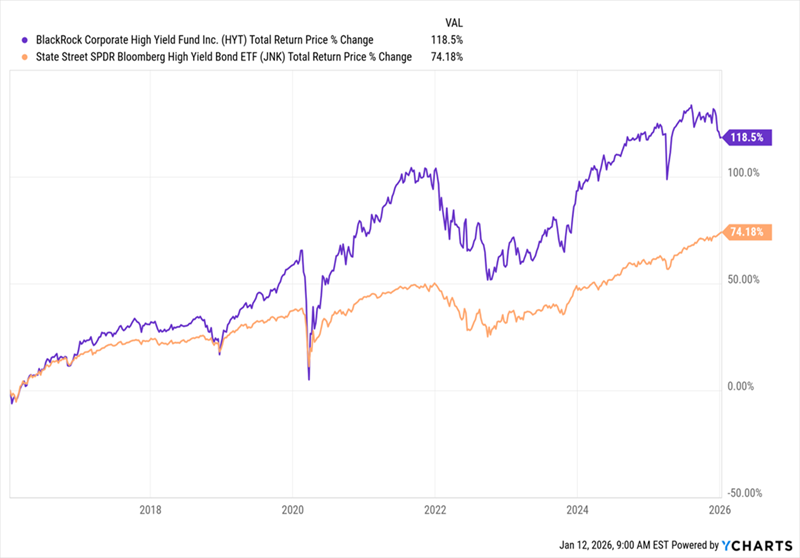
HYT yields 10.6% today and has raised its payout around 11% in the last decade. That’s in contrast to the corporate-bond benchmark SPDR Bloomberg High Yield Bond ETF (JNK), which has actually seen payouts fall a bit. Even better, HYT (in purple above) has outperformed JNK (in orange).
An even better reason to buy HYT is that today’s low bond demand means the CEF is especially cheap:
A Sudden Discount Appears
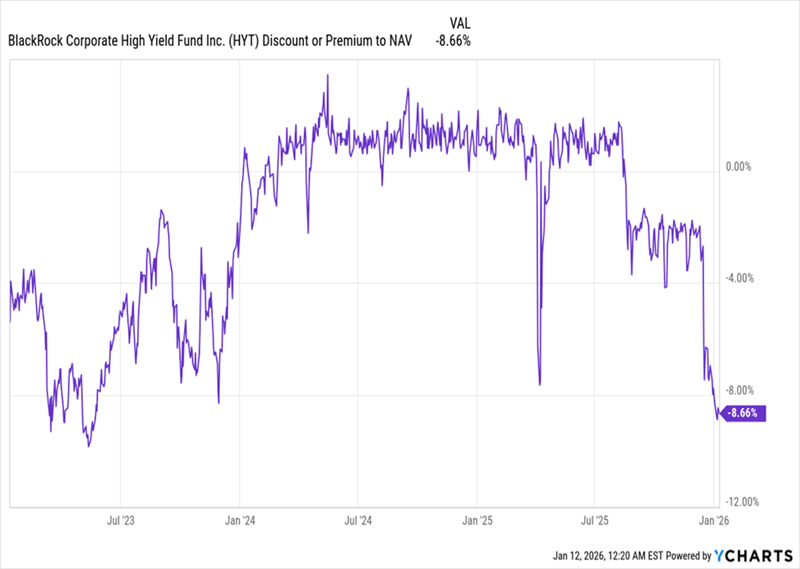
In the last six months, HYT’s discount to net asset value (NAV) has dropped to levels not seen since 2022 and 2023, after a long period of trading around par. This is an opportunity for us, putting short-term upside on the table if the fund’s discount evaporates again, like it did at the end of 2023.
With that in mind, buying HYT now is a solid value play, with demand for a hedge against an AI bubble waiting in the wings. And then, of course, there’s the 10.6% dividend.
HYT Is Just the Start. Here Are My Top “AI Bubble” Plays (Yielding up to 8.7%)
The bond market is far from the only place we’re investing to play overhyped fears of an AI bubble.
Another place? AI stocks themselves! But of course, careful contrarians we are, we’re taking two key precautions to safeguard the gains (and dividends) we get from these plays:
I know, I know. The big-name AI stocks are all pricey now, and offer low (or no) dividends. So how are we going to pull this off?
Through CEFs, of course! I’m pounding the table on 5 CEFs holding shares of companies that not only provide AI, but those that stand to gain the most by using it, too.
The time to buy these 5 high-yielding CEFs is now.

Drip-feeding money into growth and dividend shares can eventually deliver a stunning second income in retirement. Royston Wild explains how.
Posted by Royston Wild
Published 16 January

You’re reading a free article with opinions that may differ from The Motley Fool’s Premium Investing Services
Looking to build a life-changing second income? For me, the best way to chase a strong and sustained income — and one that requires considerably less effort than most popular side hustles — is to invest in the stock market.
Last year, the FTSE 100 delivered an enormous 25% total return to investors. For the S&P 500 index of US shares, the figure was 18%. Those buying stocks at the start of 2025 could have supercharged their portfolios, then, boosting their chances of eventually enjoying a large passive income.
Returns were larger than usual, sure. But even at typical rates, a small investment can generate considerable wealth over time. The FTSE All-World Index of large- and mid-cap shares has delivered an average annual return of roughly 12% over the last five years.
Here’s how investing just £100 in global stocks could eventually produce a £23,455 second income with minimal effort.
One of the simplest ways to invest in stocks is with an index tracker fund. They allow individuals to own a slice of many different companies, spreading risk and providing exposure to a broad selection of growth and income opportunities. And all at relatively little cost, too.
The Vanguard FTSE All-World ETF, for instance, tracks the performance of 3,657 stocks across regions and industries. And it has an ongoing charge of just 0.19%. If it can continue delivering the 12% annual return of recent years, a £100 monthly investment over 30 years will eventually turn into £335,074.
If then invested in 7%-yielding dividend stocks, a portfolio of this size would generate a £23,455 passive income a year.
Rather than gaining broad stock market exposure with a fund, investors can also choose to invest directly in companies. This requires a lot more effort than simply sticking your cash in an index tracker. However, it can also lead to far better results.
I think a portfolio of 15-20 stocks offers excellent diversification to spread risk and aim for big returns. Games Workshop (LSE:GAW) is one of the FTSE 100’s finest growth stocks I’ve bought for my own portfolio.
Thanks to its leading role in a rapidly growing market, the tabletop gaming specialist continues to enjoy booming profits even as the broader retail sector struggles. Last year it delivered a total return of 47%, smashing the broader FTSE index’s performance.
Further price gains in 2026 mean the average annual return over the last decade is 45%. If you’d drip fed £100 each month into Games Workshop shares since then, you’d now be sitting on a cool £218,409 (assuming dividends were reinvested).

If then invested in 7%-yielding dividend stocks, a portfolio of this size would generate a £23,455 passive income a year.
The big risk is that even if you achieve the target, there will be enough shares yielding 7% for a diversified portfolio.

The Directors of TwentyFour Income Fund Limited (“TFIF”), the FTSE 250 listed investment company targeting less liquid, higher yielding UK, European, US and Australian asset-backed securities, have declared that a dividend will be payable in respect of quarter end 31 December 2025 as follows:
Ex Dividend Date 22 January 2026
Record Date 23 January 2026
Payment Date 6 February 2026
Dividend per Share 2.00 pence per Ordinary Share (Sterling)
Ben McPoland highlights how it’s possible for a Stocks and Shares ISA portfolio to one day throw off life-enhancing sums of money.
Posted by Ben McPoland
Published 14 January

You’re reading a free article with opinions that may differ from The Motley Fool’s Premium Investing Services.
Imagine revealing that a Stocks and Shares ISA generated £100,000 every year in tax-free dividends. In some cases, people hearing that might not even believe it, as it sounds like the stuff of dreams for many.
Yet we know some investors are likely enjoying this level of passive income because the latest HMRC data showed there were over 5,000 ISA millionaires in the UK today. And the average pot among the top 25 investors was a staggering £11.3m !
Admittedly, markets bombed in April 2025 after President Trump’s tariff bombshell. So that was a lower starting point, making these figures look unusually strong for such a short space of time.
Nevertheless, there will almost certainly be more ISA millionaires now, with many of them generating sizeable second incomes.
Here’s how it’s possible to join them.
Please note that tax treatment depends on the individual circumstances of each client and may be subject to change in future. The content in this article is provided for information purposes only. It is not intended to be, neither does it constitute, any form of tax advice. Readers are responsible for carrying out their own due diligence and for obtaining professional advice before making any investment decisions.
To generate £100k a year in dividends, a 6%-yielding ISA would have to be worth approximately £1.67m. That sum may sound unobtainable at first. But as mentioned, there are thousands who have already built ISAs of this size.
Moreover, they didn’t have any unfair advantages when starting. A billionaire can’t stick £5m straight into a Stocks and Shares ISA to shield it all from tax. They’re restricted to the same £20k per year limit as everyone else.
Of course, in reality, not everyone can afford to put away £20k every year. Especially in today’s never-ending cost-of-living crisis.
For our purposes here then, I’m going to assume that someone invests half that amount. That’s the equivalent of £833 a month.
The long-term average total return of UK stocks is around 8% per year. But with careful research and savvy stock picks, it’s possible to target an average of 9%.
In this scenario, it would take approximately 32 years to reach £1.67m and £100k in passive income (excluding brokerage fees).
For someone maxing out the £20k limit at a 9% return, it would fall to 25 years. All figures assume reinvested dividends.
The UK market is home to hundreds of dividend shares, including LondonMetric Property (LSE:LMP). This is a FTSE 100 real estate investment trust (REIT) that owns distribution centres, hotels, and healthcare, entertainment and retail properties.
Yesterday (13 January), it was announced the company had snapped up a handful of Premier Inn hotels for £89m, bringing its ownership to 22.
In November, its portfolio had an impressive occupancy rate of 98.1%
As we can see above though, the stock has struggled in recent years as interest rates have soared. Higher rates have increased debt service expenses and made portfolio growth more expensive.
Moreover, as a REIT, LondonMetric has to dish out 90% of its rental profits as dividends, leaving it to rely on more expensive debt to operate. So this isn’t a risk-free investment.
However, with interest rates gradually heading lower, 2026 might mark the start of a turnaround for REITs. This one currently offers an attractive 6.6% forward-looking yield.
With its high-quality property portfolio, high yield and the possibility of a turnaround, I reckon LondonMetric stock is worth checking out at 193p.

© 2026 Passive Income Live
Theme by Anders Noren — Up ↑