The highest ‘secure’ yields in the market currently are renewables, remembering no yield is ever totally secure.
The SNOWBALL would like to add some direct investment into quoted shares, if Mr. Market co-operates.

Investment Trust Dividends
The highest ‘secure’ yields in the market currently are renewables, remembering no yield is ever totally secure.
The SNOWBALL would like to add some direct investment into quoted shares, if Mr. Market co-operates.
Mar 25, 2026
Eugenio Catone

Markets desperately would like to believe that the U.S./Israel–Iran conflict is about to end anytime soon, and President Trump’s recent statements fueled the optimism.
They’re talking to us, and they’re talking sense. It all starts with, they cannot have a nuclear weapon. They want to make a deal so badly, you have no idea how badly they want to make it. We’ve won this war.
In addition, the U.S. sent Iran a 15-point plan to end the war. President Trump also claimed that Iran sent him a present “worth a tremendous amount of money” related to energy flows through the Strait of Hormuz. We don’t know what kind of present we are talking about, but above all, the controversial fact is that we don’t know who the president is dealing with. In fact, there is no mention of any Iranian official dealing with peace talks. As of now, from Iranian officials, we have just heard words that are far from reassuring:
Has the level of your inner struggle reached the stage of you negotiating with yourself? You will see neither your investments in the region nor the former prices of energy and oil again, until you understand that stability in the region is guaranteed by the powerful hand of our armed forces.
Ebrahim Zolfaghari, spokesperson for the Khatam al-Anbiya Central Headquarters.
One of the two leaders is definitely lying, but as of now, the market has decided to support President Trump’s vision. In fact, even though Iran denies peace talks with the U.S., the market wanted to believe that we are close to the end of the conflict. While I am writing, stock market futures are up more than 1%, oil is declining by 5% (both WTI (CL1:COM) and Brent (CO1:COM)), and gold (XAUUSD:CUR) is rebounding by 2% as the U.S. Dollar (DXY) weakens.
I don’t want to ruin the party, but I am rather confident that this market enthusiasm is just short-lived. The reason why I believe we are going to test new lows is that the two parties are too far apart to even think about reaching an agreement. Here is what I am talking about.
Firstly, Israeli officials are claiming that they need several more weeks to complete all the war goals in Iran. So, if Israel continues to bomb, I don’t think it is reasonable to expect a ceasefire anytime soon. Regarding the U.S.–Iran agreement, the evidence shows us that they are asking for totally different conditions. This is what the US asks, according to WSJ:
If Iran follows these points, then it will be lifted from nuclear-related sanctions, and the domestic nuclear program will be assisted constantly by the U.S. In other words, what President Trump is asking is an unconditional surrender. Without ballistic missiles, Iran will not even be able to defend itself from future attacks, and it could no longer block the Strait to counterattack. At this point, you might think, if they end up reaching an agreement, why should Iran care about future attacks? Because both the U.S. and Israel have already attacked Iran twice during the negotiating talks.
Iran sees negotiations as a pretext for the U.S. to buy time and prepare for the next massive attack, resulting in a further escalation. Will this time be the same as in the past? Well, in my opinion, the probabilities are pretty high. While President Trump claims a potential agreement is close, the Pentagon has just sent 3,000 82nd Airborne Soldiers, and they are expected to reach the Middle East in the coming hours. In this conflict, weekends usually coincided with periods of escalation, and I am concerned about the next one. The recent market rebound might be completely wiped out in just one day following a potential escalation over the weekend. Signals are there.
Finally, to show you how distant the parties are, here is what Iran asks to end the war, according to WSJ:
As you can see, totally different peace conditions than the ones proposed by the U.S. I want to be optimistic, but recent news is really not helping. Iran has probably understood that it is more powerful than it thought by blocking the Strait of Hormuz. An important point that we should all consider is that Iran is not asking for simple peace conditions that would revert to the pre-war situation. It is not just about receiving the money to rebuild damaged infrastructures; it is about having total military and commercial control over the Middle East. They want Israel to stop any war, they oppose any sanctions, and they want the exclusive control of the Strait of Hormuz: each ship must pay a toll whenever it crosses.
So, if you are betting on a market recovery due to the end of the war, consider that both parties are asking for conditions that are almost impossible to agree on. In my opinion, this war can end only when we have a clear winner, and the loser must accept an unconditional surrender. As of now, we don’t have a clear winner.
In my opinion, investors shouldn’t downplay this conflict. The market still believes that the U.S. can easily win this war or end it whenever it wants, but the evidence shows otherwise. Both parties are quite distant, and the U.S. is sending thousands more troops to the Middle East. As long as I don’t see words of peace from Israeli/Iranian leaders, the escalation continues. Therefore, I am still bullish on oil and the U.S. dollar and short-term bearish on gold and global stock markets.
Now, a question arises: how do investors know when the escalation has reached its peak? Most people believe that it depends on oil prices, but I have a different opinion. The last phase of the escalation might be reached once the Gulf countries’ desalination plans are attacked. At that point, water would be worth more than oil.
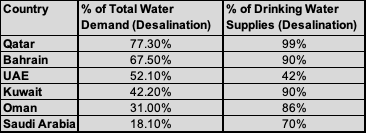
These countries can’t survive without desalination plants, and Iran threatened to attack them if its energy infrastructures are hit once again. If this happens, I believe the market will start acting in panic mode, regardless of President Trump’s statements regarding peace. This weekend is very important to understand where this war is heading, as the Pentagon sent many more troops to the Middle East.
I think there won’t be any de-escalation anytime soon, and the similar historical events support my disbelief.
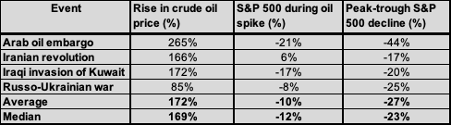
None of these events ended in a couple of weeks, and I don’t believe the recent oil crisis is less important than the Iraqi invasion or the Russo-Ukrainian war. The median oil spike during these kinds of events was +169%; now we didn’t get further than ~70% (~35% after the recent drop). In addition, the S&P 500 (SP500) peak to trough has always been at least -17%; now it has declined by just ~5%: we are likely not even halfway through.

Mar 26, 2026
Jussi Askola, CFA Investing Group Leader

My active income is very risky.
I run a small investment research business, which I know will eventually get disrupted by AI, as it breaks barriers to entry and will ultimately lead to much greater competition.
Already now, the majority of content online is AI-generated, and it likely won’t be long before this content is as good as human-generated and all over the place.
If, before AI, there were 5 articles posted each day on REITs, in the future, there will be 50 or 500, making it very hard for independent analysts to really stand out.
Knowing this, I am very conservative with how I invest my retirement funds, preparing already now for an eventual downfall of my small business.
This means that I generally stay away from risky equities like tech stocks, SaaS businesses, biotech, startups, crypto-related equities, and anything else that I think could get disrupted by AI over time. Unfortunately, as I have explained in a separate article, I fear that most businesses and their stocks will eventually suffer from this.
At the same time, since my investment horizon is multi-decade-long and I worry about inflation, I don’t invest much in fixed income either.
Even with a 4-5% yield from long-term Treasuries (IEF), there is not much left, if anything, after inflation and taxes, especially if we face a few more black swan-like events like the pandemic, requiring more money-printing down the line. The AI revolution could be that event if it leads to a difficult transition period with significant labor market disruption, as I expect.
Gold (GLD) and silver (SLV), while performing well lately, are not the solution for me either, as I will need to generate passive income to replace my active income in retirement. Precious metals have gone through very long periods of negative returns in the past, making them too unpredictable for a large allocation in retirement for me.
The answer is in infrastructure investments. I invest about 75% of my portfolio in them.
Things that our society absolutely needs, whether the economy is booming or in a recession, and AI can replace or replicate them. Yet, they generate significant income that’s consistently growing at, or ideally above, the rate of inflation.
Think here about things like:
Cell towers:

Energy pipelines:
Timberland:

Windmills:

Industrial parks:

Farmland:

Ports:

Affordable housing:

Healthcare facilities:

Airports:

All these infrastructure investments are today available on the public stock market via listed REITs, MLPs, and other listed infrastructure companies.
Just to give a few examples: Crown Castle Inc. (CCI) owns cell towers, Energy Transfer LP (ET) owns pipelines, Brookfield Renewable Partners L.P. (BEP) owns solar farms, Welltower Inc. (WELL) owns senior housing, Prologis, Inc. (PLD) owns warehouses, etc.
They share 5 characteristics that make them the ideal investment for retirement, especially for someone like me who fears AI disruption, has a long investment horizon, and needs safe and inflation-protected income.
If you buy an e-commerce warehouse at a 7% cap rate with a 15-year lease that includes annual rent escalations of the greater of either a fixed 2% or the rate of CPI, and then finance half of the purchase with a mortgage at a 4% interest rate, you get a roughly 8.5% yield on your equity that will gradually increase over time.
That’s exactly what a REIT like W. P. Carey Inc. (WPC) is doing.

Best of all, because the REIT enjoys significant economies of scale, owning billions of dollars worth of assets, its management costs are very low. The REIT also enjoys an investment-grade rating, which gives it access to cheap debt, especially in Europe.
The REIT does not, however, distribute its entire cash flow to investors. Instead, it retains about 30% of its earnings to keep reinvesting in growth, acquiring new properties, and growing its cash flow and dividend. It results in a 5.3% dividend yield today, but also strong, steady growth.
Last year, its cash flow per share again rose by 6%, and it guided for growth to continue in 2026.
The long-term results speak for themselves. It has massively outperformed the S&P 500 (SPY) all while paying a high yield:
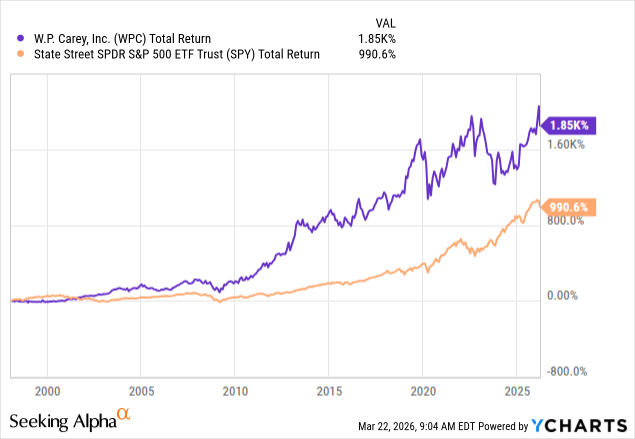
And that’s one of the main reasons why these listed infrastructure companies are such great investments for retirement.
They pay a solid yield that grows steadily. W.P. Carey did not even cut its dividend during the Great Financial Crisis or the pandemic. That’s how resilient its business model is.
Investors often see bonds as the safest investments, and that’s in big part because there is a contract that clearly determines what return investors can expect to receive in exchange for lending their capital.
These infrastructure investments are similar in that sense.
You let someone borrow something from you (your property) in exchange for regular payments (rent) and then have a contract in place (a lease) to regulate those payments, often over a long duration.
Returning to the example of W.P. Carey, its initial lease terms are typically 15 years long, and the lease even includes annual rent escalations, which will happen even if we go into a recession.
The only way for the tenant to skip those payments is if it goes bankrupt and defaults on the lease. But even in that scenario, the recovery would likely be strong, as W.P. Carey would then recoup the property, which it could simply release to another tenant, and with industrial rents rising faster than lease escalations over the past decade, it may be able to release the property at an even higher rent.

The recovery is often a lot worse in the case of a loan default, as the collateral may have already been exhausted by the borrower by the time it goes bankrupt.
The point is that these listed infrastructure companies often earn highly consistent and predictable contractual cash flows that are bond-like in nature. There is a clear contract that protects investors, and even in case of troubles, there is typically a good recovery as the real property is still there and can be released to another tenant.
Infrastructure that’s essential to our society cannot be inflated away. The government can print as much money as it wants, but it cannot print more land, timber, energy pipelines, airports, etc.
These are some of the only assets in the world that have stood the test of time, resisting monetary collapses, currency changes, world wars, and other major crises over centuries.
European capital cities are full of old buildings, often hundreds of years old, standing there, more valuable than ever before.

This reassures me as we live through periods of extreme uncertainty, with governments more indebted than ever, spending like there is no tomorrow, even as major wars are being fought in Europe and the Middle East with no end in sight.
This makes me uncomfortable investing heavily in fixed-income investments, which could significantly erode my long-term purchasing power in case of a monetary black swan.
Finally, as I noted earlier, I worry a lot about AI and how it could disrupt large fractions of the equity markets.
I think that SaaS companies were just the first domino to fall, and the market hasn’t yet recognized this. Professional service providers, education businesses, healthcare, traditional retail, logistics, car manufacturers, entertainment, etc., will all suffer greatly from AI disruption over the long run.
Very few businesses are truly immune.
Infrastructure businesses are the exception. They are the ultimate anti-AI asset class, as they own real assets that cannot be replicated or disrupted by AI.
It cannot magically create more land in popular, already built-out locations, secure highly bureaucratic construction permits, or even produce construction materials.

These will always remain barriers that will protect essential infrastructure investments from the threat of AI.
There are, of course, exceptions. Offices could suffer disruption of white-collar workers. Malls could suffer from an acceleration in e-commerce growth.
But for the most part, infrastructure-like real assets cannot be easily disrupted. A dam producing energy will only become more valuable as AI requires tons of electricity. So will a solar park, windmills, data centers, cell towers, timberland, e-commerce warehouses, and lots of other property sectors, directly benefiting from AI.

Here comes the most interesting part.
I am lucky that the listed infrastructure companies are today out of favor.
All the attention has been on Tech stocks lately, pushing their valuations to historic highs:
At the same time, the surge in interest rates led to a historic capital rotation from high-yielding equities, like these listed infrastructure companies, into fixed-income investments.
As a result, there has been little interest in these companies for years, pushing their valuations to historic lows.
REITs (VNQ), as an example, have not traded at such low valuations in decades:
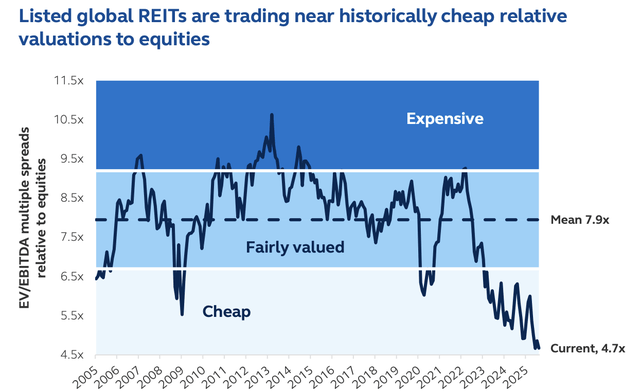
Many individual REITs now trade at steep discounts relative to the fair value of their assets. To give you an example, BSR Real Estate Investment Trust (HOM.U:CA) (BSRTF) owns affordable apartment communities in the growing Texas Triangle, and yet, it trades at a 40% discount to its net asset value, allowing investors like me to buy an equity stake in their assets at just 60 cents on the dollar—with the additional benefits of cost-efficient professional management, diversification, and liquidity.
That’s far more attractive than buying a private, concentrated, management-intensive, and illiquid asset in the private market at a higher valuation.

These low valuations provide a margin of safety, reducing potential downside risk in case of a black swan event, and they also could provide future upside potential as the narrative changes and these investments regain popularity.
I think that the AI revolution could trigger that, as it could destroy a lot of value in the tech sector and trigger a capital rotation back into these AI-resistant asset classes.
I cannot think of anything better than listed infrastructure investments for retirement for people like me who have a multi-decade time horizon, need income, and worry about inflation and the potential impact of the AI revolution on various asset classes.
That is why I invest the majority of my portfolio in High Yield Landlord in these investments. They are essential to our society, cannot be disrupted by AI, enjoy strong inflation protection, generate high income, and are historically cheap, offering a margin of safety and future upside potential.
It is hard to beat that, in my opinion.
Editor’s Note: This article discusses one or more securities that do not trade on a major U.S. exchange. Please be aware of the risks associated with these stocks.

I’ve sold the recent purchase in PHP for a tiny profit after all charges, as it’s a very dangerous market to make any new purchases and it frees up funds for a possible purchase in SUPR.


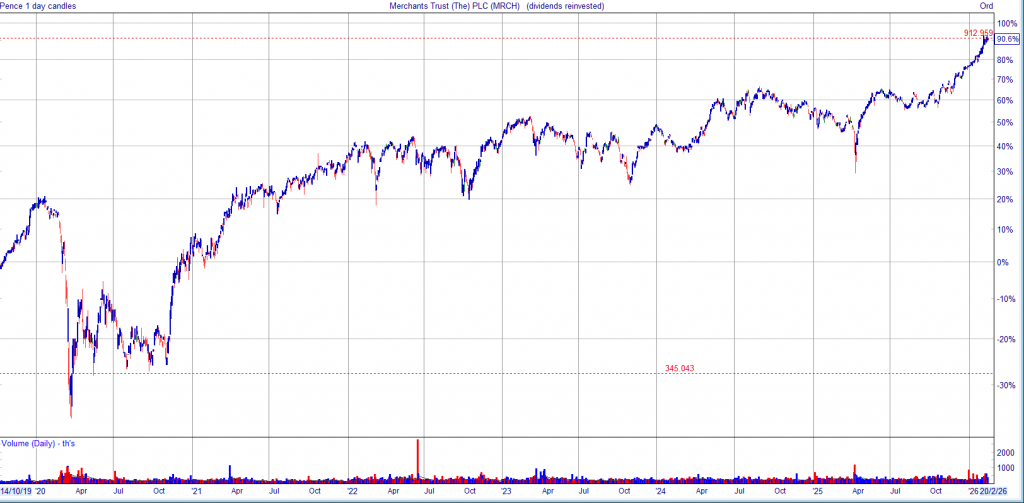
I want to add MRCH to the SNOWBALL, for the yield and an above average chance to achieve the holy grail of investing, in time.
I have posted the chart up to the end of Feb and for illustrative purposes only the dividend is re-invested, where for the SNOWBALL as the price rose and the yield fell it would have been re-invested in in a higher yielder.
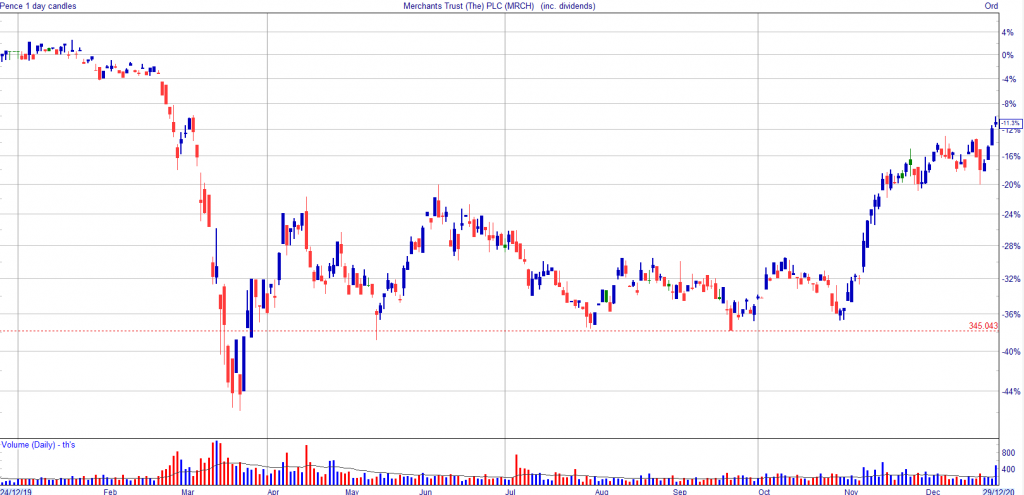
Back to the covid crash, interesting to note ‘support’ in action, where for whatever reason the share is bought when it falls to a certain level.
If you had bought it took over six months to breakout, so with the benefit of hindsight, there was no hurry to buy but a great share for re-investing the earned dividends, for the day when it does break out.

It’s always easier with hindsight, the regret would be that you never got a position and the patience needed as you wait for the price to rise. If the price continued to fall you could buy more shares with your dividends, if it went sideways, you could add more shares around your current price level. If it never went up, unlikely but you would have cash to pay your bills.
Hopefully, if the oil price stays high but not for too long, I will be able to build a position. I haven’t got anything I would like to sell at the present time because the fcasted dividends mean I will beat the fcast and dividends are always the only deciding factor.
GL
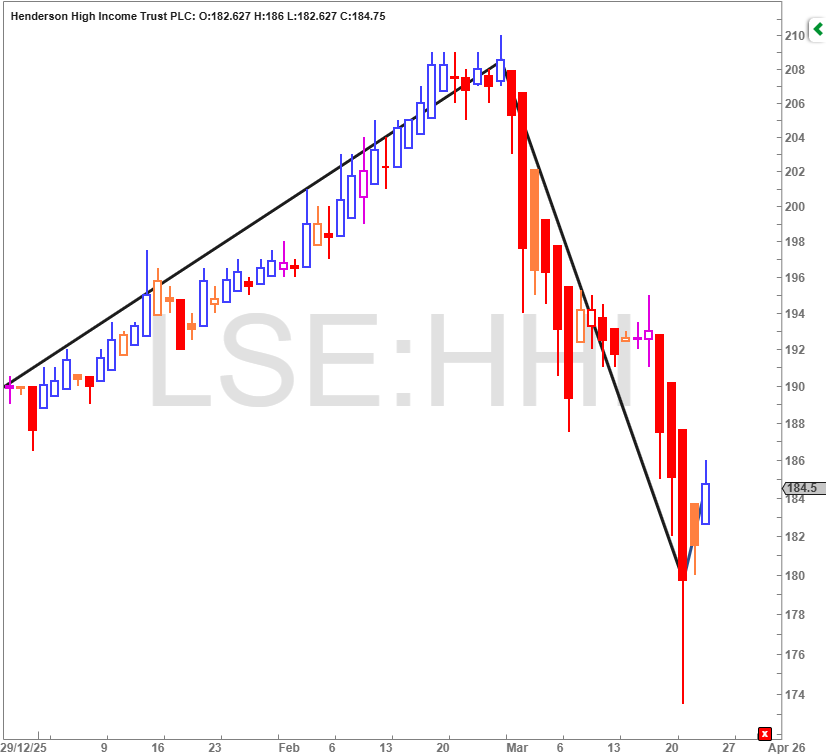
As the price falls so the yield rises, now around 6%.
CHAIRMAN’S STATEMENT
Performance.
2025 was a positive year of investment performance for Henderson High Income Trust . The Company’s Net Asset Value (NAV) total return was +20.4% which was broadly in line with the benchmark return of +20.6%. The
share price total return was a little higher at +22.6% as the discount at which the share price traded to underlying NAV narrowed a little during the year, ending the period at 5.7%.
The UK equity market was one of the best performing markets globally in 2025, helped by attractive valuations and corporate activity, although smaller and medium sized companies struggled somewhat versus larger stocks.
This strong market backdrop helped underpin equity returns despite a year characterised by ongoing volatility in financial markets, a pattern established since the arrival of President Trump in the White House. The threat of
tariffs on US trading partners and geopolitical turmoil, offset more positively by the easing of inflation provided a volatile mix but the efforts of global policy makers to start to reduce interest rates helped support equity markets
particularly. Strong ongoing corporate profitability stood in sharp contrast to pressure on government finances, especially in the UK where the corporate sector has been in the firing line of increased taxation to help fund
higher public spending.
Overall, during 2025 the Company’s investment performance was broadly in line with the benchmark return.
Gearing and asset allocation.
Wth the portfolio continuing to favour equities over bonds, were positive relative
influences but this was offset by a negative contribution from equity stock selection in the second half of the year.
Dividends
The Company’s investment objective remains the same, to provide investors with a high dividend income stream while also maintaining the prospect of capital growth. In 2025 company dividends continued to be healthy with
quoted companies delivering good levels of ongoing profitability in spite of the uncertain economic backdrop. It was again pleasing to see that the Company’s overall earnings during the year were sufficient to cover the full year dividend enabling a small amount to be added to revenue reserves.
During 2025 the Board recommended the payment of dividends totalling 10.9 pence per share, an increase of 2.8% over the payment in 2024. This was the 13th consecutive year of dividend growth from the Company.
The Board focuses carefully throughout the year on the revenue projections provided by the Fund Manager and itremains confident that the Company will be able to continue to generate a high level of income for shareholders.


25 March 2026
While volatility can feel unsettling, it is a normal part of investing.
By Jonathan Jones
Editor, Trustnet
Patience beats prediction when markets are volatile, according to experts at Vanguard, who have reminded investors that staying invested brings better results than trying to time the market.
The firm highlighted volatility last year surrounding US president Donald Trump’s ‘Liberation Day’ tariffs as an example. Had investors sold out of their investments on 8 April 2025 and returned to markets one month later, their returns would have been 10 percentage points lower today than if they had remained invested throughout (14.4% versus 4.8%).
James Norton, head of retirement & investments at Vanguard Europe, said: “Investing is a marathon not a sprint.
“While volatility can feel unsettling, it is a normal part of investing. Successful investing isn’t about trying to time when to buy or sell, but about having a clear plan, staying invested and contributing regularly. By doing so and maintaining a balanced, diversified portfolio investors give themselves the best chance of investment success and meeting their long-term goals.”
The research noted that the MSCI World index has experienced eight bear markets since 1972, each time recovering and then pushing to new heights, as the below chart shows.
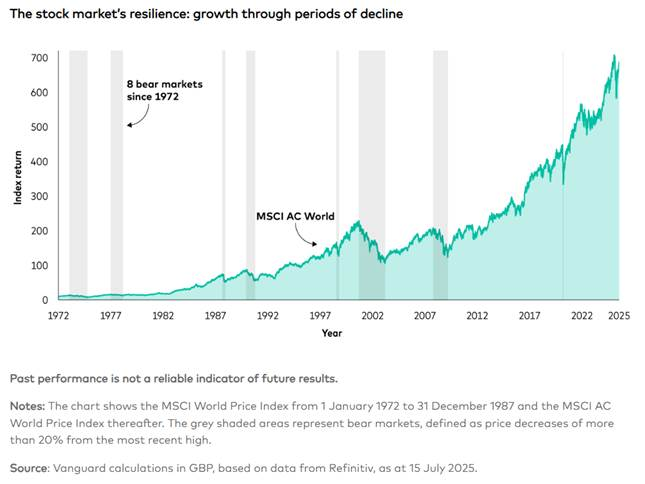
Diversification also matters, however. US tech stocks have dominated returns in recent years but in 2025 a globally diversified portfolio would have made better returns. The report noted that the UK and emerging markets were up 23% versus 11% for the S&P 500.
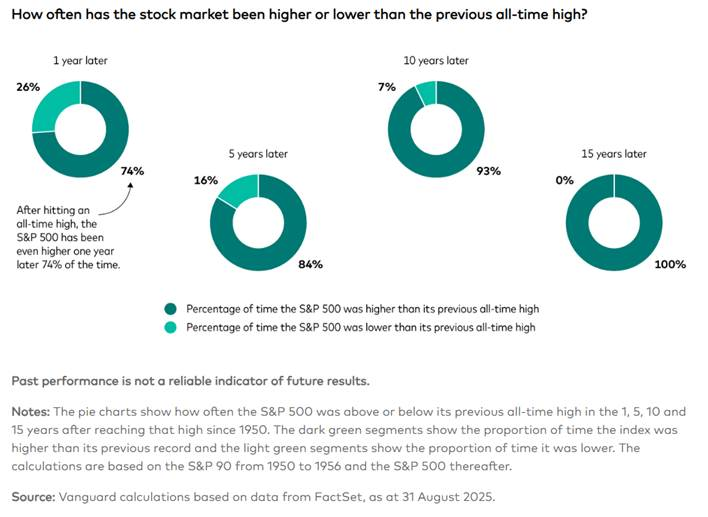
Lastly, the firm said investors should not fear market highs, noting they are often followed by new records.
“You may feel uneasy when markets are rallying but history shows that markets often go on to reach more highs,” the report found.
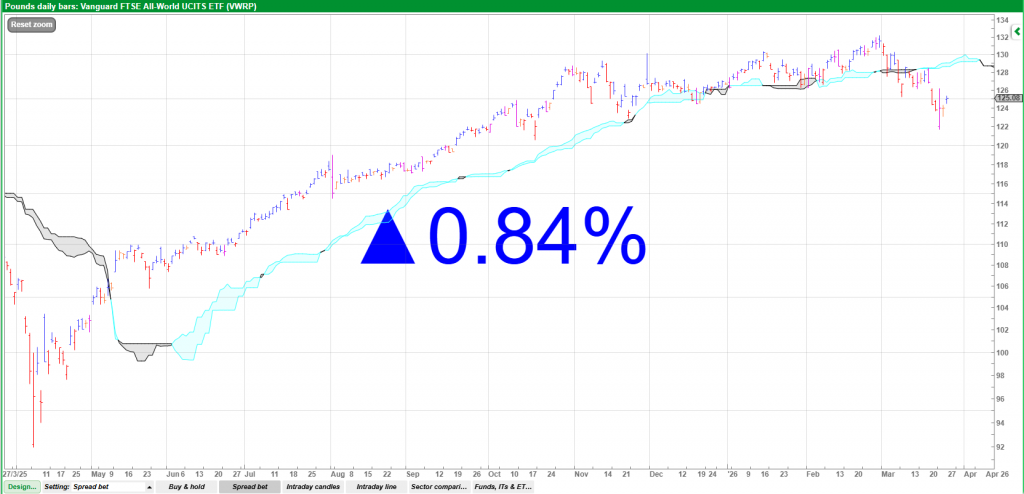
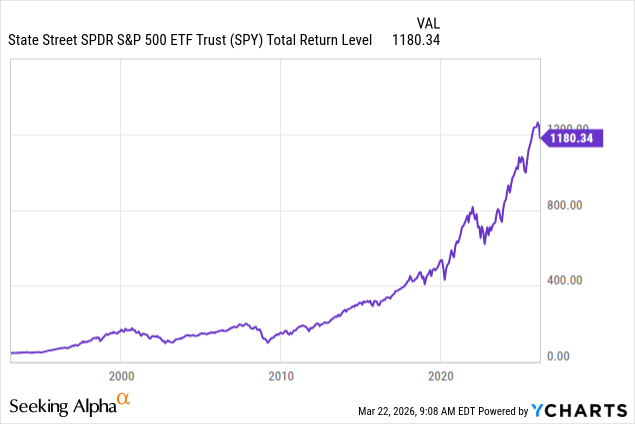
The SNOWBALL’S comparator share, hasn’t added any cash to your retirement fund in six months. Nonetheless it’s been a great period of out performance.
Mar 25, 2026

Dear reader,
As previously discussed the overall narrative for Regional REIT ticker RGL’s 2025 is one of strategic repositioning: The company aggressively sold assets to lower debt and is now shifting toward a “Capex-led” growth strategy to upgrade its remaining portfolio.
MEES is Minimum Energy Efficiency Standard regulations which forces UK landlords to meet EPC standards.
RGL’s Focus: 84.4% of RGL’s portfolio is now rated EPC C or better, with 60% at EPC B or better. This is a critical metric as net zero environmental regulations tighten for UK commercial landlords.
Is the market giving even £1 of credit to that? Nope.
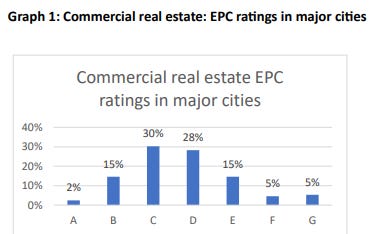
Since 2023, it has been unlawful for a landlord to continue letting a commercial property with an EPC rating of F or G. Any business (from a local law firm to a global tech giant) can technically contract an office that is EPC E, D, or C, on the understanding that one day they’ll need to move out or face a building refurb.
While this is not yet set in stone we all know the current government are determined to drive forward energy reductions so the MEES “target” whilst not legislatively set in stone and besides common sense for buyers too:
Yes, a future alternative government might overturn this legislation and Labour might delay on this but a higher EPC equals a lower cost, typically.
So yes, 53% of landlords might stump up the cash in the next 21 months to get to EPC C to avoid becoming non-compliant, but then again they might not. After all they probably face the same difficult market that RGL has faced, don’t you think?
If RGL loses 50%-80% of competition then that places it in a very strong position.
EPC D or below properties probably excludes them from increasing numbers of office renters. Haven’t you spotted how energy bills are going up in 2026? A lot.
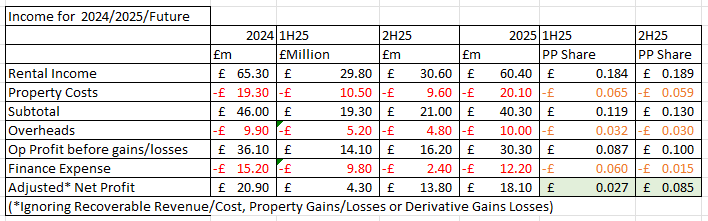
RGL tell us that “Demand for quality office space has put an upward pressure on rents, with growth of 4.8% recorded across the Big Nine regional markets in 2025. According to research from Avison Young, average headline rents are now approximately £40.72 per sq. ft.”
Wow! £40.72 is quite a bit higher than RGL’s average of £14.20 per sq. ft. isn’t it?
Interesting to see RGL’s NAV (in green) is flat over the past two years but the debt is much reduced (blue and red lines), along with a reduced property portfolio (grey). There’s zero recognition for this achievement in the share price. It is priced based on a cliff edge of debt that isn’t there today.
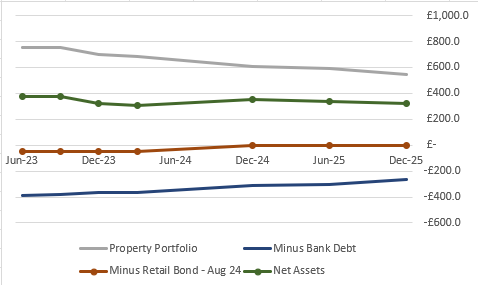

Does that mean lower rentals in 2026? Possible but not necessarily.
Interesting to see rental income accelerated in 2H25: Operating profit equated to 8.7p in 1H25 and 10p in 2H25, thanks to higher rental income, lower property costs and overheads.
This 1Q26 RICS survey shows offices in blue where demand is rising and availability is falling.
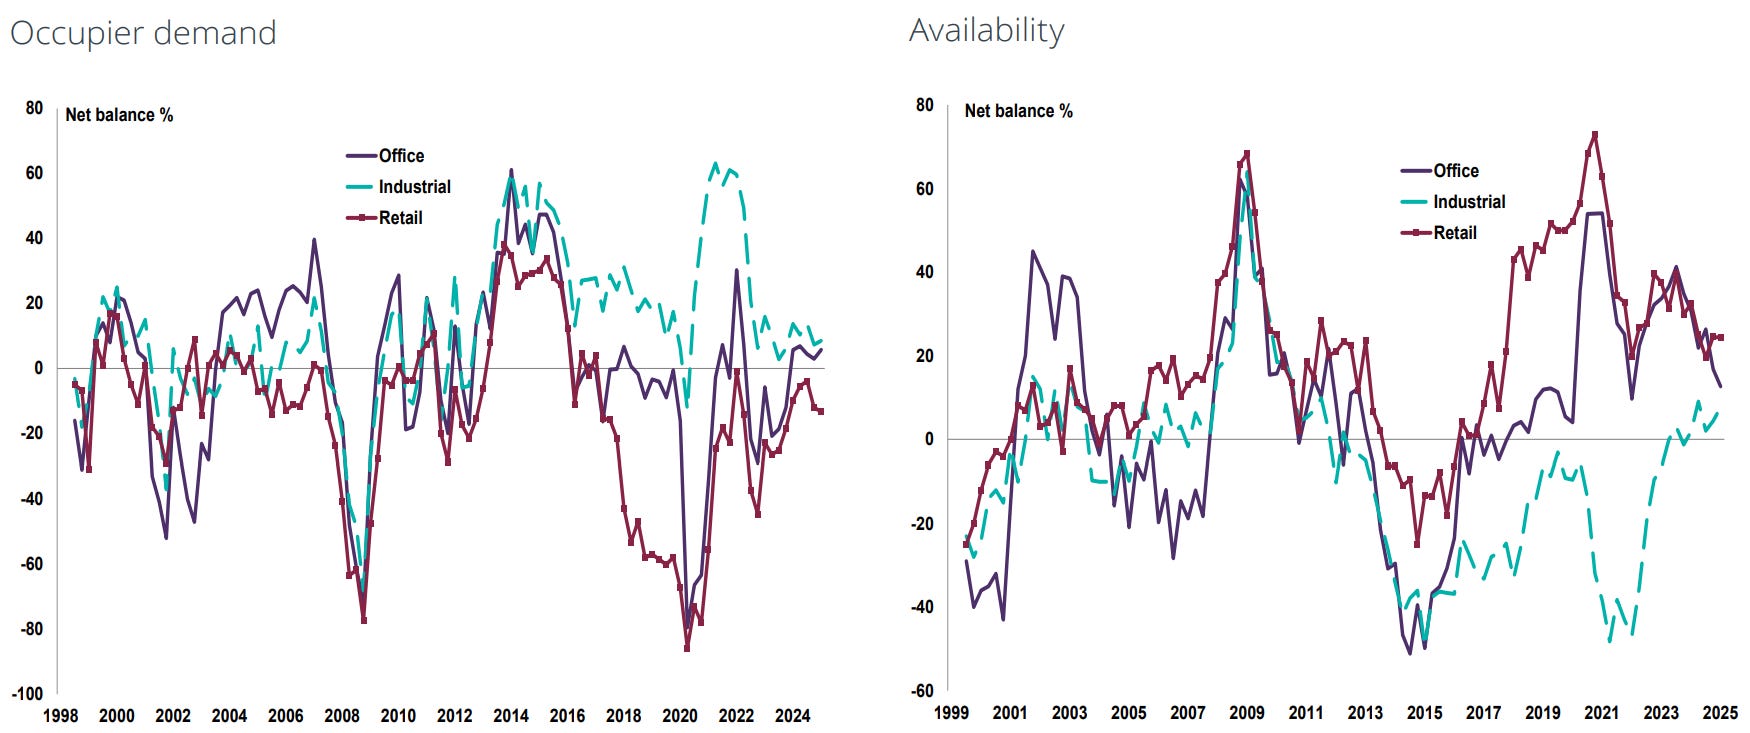
The RICS finding is mirrored when you considered the forward pipeline of new office builds is pitiful. The Building Safety Act and various onerous planning costs as well as still-high interest rates and finance costs make new builds deeply unattractive.
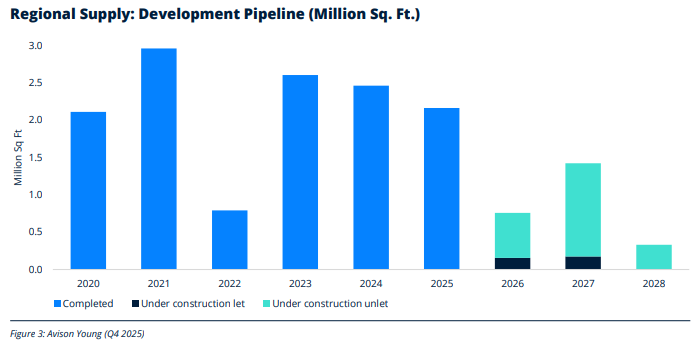
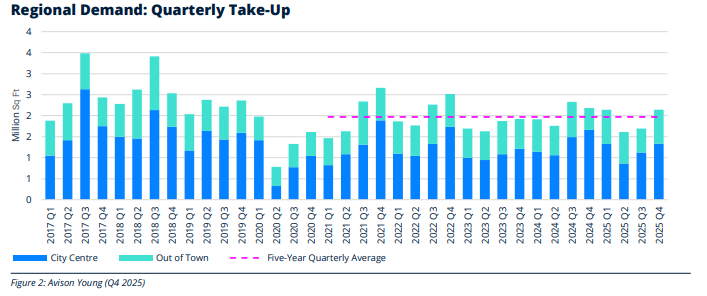
This constrained supply is smashing into a fairly steady 2m Sq.Ft of demand. Moreover the Business Rates revaluation is likely to drive more businesses outside the M25 – and into the waiting arms of RGL.
Build costs are simply too high to justify adding supply at current prices.

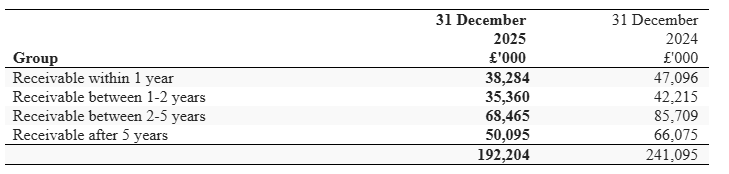
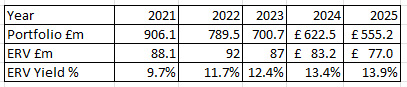
In fact what clearer evidence is there than post period lettings are averaging 17% above ERV (estimated rental value). Does that not make you slightly say Wow? Extrapolating that percentage to the £77m ERV gets you to a £90m per annum ERV. Compared with a £148m market cap?

The ERV as I’ve previously reported has been increasing and hit 13.9% in 2025. The 17% above i.e. £90m would take this to a 16.2% yield.
RGL isn’t yet achieving £77m ERV, let alone £90m, but its trajectory is inching towards there. 62.9% of the portfolio were core in 4Q25 up from 58.4% in 1H25, so while the EPRA occupancy is “static” the proportion that fall under the 86.5% occupancy is increasing.
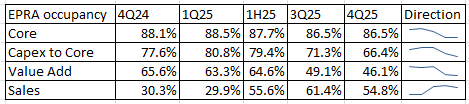
Think this in addition to the new rentals on average 17% above ERV tells you what you need to know post period: Disposals continue ABOVE book value.

There are £12.3m disposals post period, reducing debt by £7.8m so “another £50m” reduction is on target pro rata.
I didn’t really expect the annual report to throw up lots of further insights beyond those already shared in the trading update. The presentation should add further insights but even just the annual report shows RGL is well positioned in the market and probably at a low point so despite a weak share price YTD this is – in my opinion – an owner of interesting and increasingly valuable assets.
Regards
The Oak Bloke
Disclaimers:
This is not advice – you make your own investment decisions.
Micro cap and Nano cap holdings including REITs might have a higher risk and higher volatility than companies that are traditionally defined as “blue chip”.
The SNOWBALL currently has £1,963 of cash xd and £428 of cash to be re-invested, most probably depending on Mr. Market, in a new position.


The world is facing what could be yet another ‘unprecedented’ crisis. It’s hard for anyone to focus on more than one potentially catastrophic event at a time, so for the moment, investors have stopped worrying about AI and turned their eyes to the war in the Middle East.
But the appearance of a bigger problem does not necessarily make the smaller one disappear. Software stocks still risk being wiped out by AI, and investors are legitimately concerned about what that means for private debt and the trusts associated with it.
The industry has grown rapidly in recent years and has lent significant sums to software companies. Because private debt houses lend to unlisted companies, we do not have visibility on how the underlying loans are faring. What we do know is that some private debt funds had to limit redemptions because too many investors wanted to pull their money out.
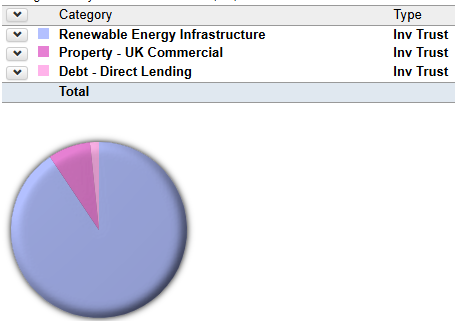
Enter, debt investment trusts. As charts suggests, investors in the sector have become somewhat jumpy. Earlier this month, both CVC Income & Growth (CVCG) and M&G Credit Income (MGCI) made announcements to quell investor worry, highlighting, among other things, that their exposure to software companies was only 3 per cent and 2 per cent, respectively.
So, nothing to worry about? Well, it depends on who you ask, and there are a lot of moving parts. There are three debt trust sectors to look at: loans & bonds (where CVC and M&G sit), direct lending, and the marvellously complicated world of structured finance.

The first comprises, as you’d expect, trusts that invest in a range of loans and bonds, with a focus on listed exposure – although this varies. CVC, for example, says that about 98 per cent of the loans and bonds in its portfolio are priced daily. Invesco Bond Income Plus (BIPS), the biggest in the sector, tends to focus on high-yield corporate bonds.
Loans in the sector tend to be floating rather than fixed-rate and thus are not as sensitive to rising interest rates. And, to return to the Middle East briefly, QuotedData’s James Carthew argues that the main concern for investors should be if prolonged war hits the global economy enough that default rates start ticking up.
He says he’s a little “wary” of CVC for this reason – the trust tends to invest in lower-quality credit, relying on the managers’ ability to spot situations where the credit profile is likely to improve. This has historically worked very well but could get tricky if there is a recession. Following a similar thought process, Killik & Co’s Mick Gilligan likes M&G Credit Income, given the bulk of its holdings are “investment grade quality”, so the risk of the “spread widening” and values falling is lower.
The direct lending trust sector makes direct and private loans, but most trusts here are winding down. Both Carthew and Gilligan like the one survivor, BioPharma Credit (BPCR), with Gilligan explaining that it makes “secured loans to life science companies with proven drugs” and so is not exposed to software and is less economically sensitive.
It’s when we get to structured finance that things get a little iffy, and specifically, a part of the asset class known as collateralised loan obligations (CLOs). These are pools of low-rated loans that investors can buy in tranches with different risk levels. Incidentally, CVC has some CLOs exposure, too.
As at the end of February, TwentyFour Income Fund (TFIF), the biggest trust in the AIC structured finance sector, had 46 per cent of its portfolio in CLOs. Gilligan says some concern is warranted because there is no visibility on what these investments actually are. He adds: “Although it is not possible to tell how much of this CLO exposure is directly related to software, I understand that several BBB CLOs have been marked down into the end of February due to spread widening, initially driven by a sell-off in software.”
Fair Oaks Income 2021 (FAIR), by far the highest-yielding trust in the sector, invests in a mix of CLOs and subordinated debt, arguably making it even more exposed to defaults. The trust has recently announced that it will cut its dividend, as it has been gradually reducing risk in the portfolio.
The impact of the war in Iran remains the main focus for investors, and rightly so. But developments in the private debt-software-AI triangle are definitely worth keeping an eye on, too.
By Val Cipriani, funds editor at Investors’ Chronicle
© 2026 Passive Income Live
Theme by Anders Noren — Up ↑