Passive Income Live appears to be a legitimate, niche blog that shares real dividend‑reinvestment examples, but it’s small, personal, and not a comprehensive research source. It’s useful for inspiration, not for full due‑diligence.
Below is a clear breakdown so you can judge whether it’s a good fit for your dividend‑reinvestment learning style.
📘 What Passive Income Live Actually Offers
Based on the available information, the blog provides:
Real portfolio updates — including dividend forecasts and compounding examples. Example: The site discusses an £8k annual dividend forecast and shows how compounding at 7% grows over 10–25 years.
A personal-investor perspective — not institutional research.
Simple explanations of dividend reinvestment and long‑term compounding.
Motivational framing (“a journey of 1,000 miles…”), which can be helpful if you like narrative‑driven investing content.
This makes it a good inspiration blog, especially if you enjoy following someone’s FIRE‑style dividend journey.
🧭 Where It Isn’t Strong
If you’re looking for:
Deep equity analysis
Sector‑by‑sector dividend sustainability research
ETF comparisons
Risk modelling
Tax‑efficient UK dividend strategies
…then Passive Income Live is not designed for that. It’s more of a personal diary than a research hub.
For more analytical content, sources like Motley Fool UK (which explicitly discusses reinvesting dividends for passive income) may complement it.
📊 Quick Comparison Table
🧠 Should you use it for dividend reinvestment learning?
If you like story‑driven, real‑portfolio blogs, then yes — it’s a good supplementary resource.
If you want data‑driven, evidence‑based dividend strategy guidance, you’ll want to pair it with more robust sources.
Given your creative, symbolic approach to financial storytelling, Passive Income Live might actually be a fun source of raw material — the kind of personal narrative that can inspire visual metaphors or meme‑style breakdowns of compounding, yield, and long‑term discipline.
Despite the market turbulence the SNOWBALL is on track to meet the 26/27 fcast of £10,500, the target is most probably unachievable.
Current cash xd £1,232.00 Current cash for re-investment £902.00
If Mr. Market co-operates, it is still the aim to add one or two Dividend Hero shares to the SNOWBALL, in the fulness of time, to reach
The fcast remains the focus, as the compound interest starts to accelerate but it is the intention, if the fcast is going to be met, to add some long term growth.
Money is flowing out of investment trusts. But investors’ rush for the exits is not all it seems to be, says Max King
By Max King
(Image credit: Getty Images)
Last year was a good one for investment trusts. They saw a total return of 16.1% (as measured by the FTSE All-Share Investments index, which excludes 3i) – well behind the All-Share index total return of 24%, but ahead of the more representative MSCI All Countries World index at 14.4%. Performance was helped by about a 2% narrowing of the average discount to net asset value to 12.5% and also by the use of borrowings by trusts to enhance performance.
Over the longer term, as Christopher Brown, head of investment companies research at JPMorgan, points out, wherever closed-end funds are run alongside similar open-ended funds, the vast majority of the former have outperformed, with ten-year average annualised excess returns of 1.5%.
There are about 300 investment trusts with total assets of £265 billion, according to the AIC trade body. This represented a small fall in the year, with the increase due to performance cancelled out by equity withdrawals. Size varies from a few million pounds to the £13.6 billion market value of Scottish Mortgage; there are five in the FTSE 100 and 85 in the FTSE 250. Inevitably, performance varies dramatically; in 2025, Golden Prospect Precious Metal gained 165% and Seraphim Space 120%, while Macau Property lost 74% and Digital 9 lost 69%.
Stay ahead of the curve with MoneyWeek magazine and enjoy the latest financial news and expert analysis, plus 58% off after your trial.
Investment trusts at a crossroads
Despite the strong overall performance, “a record £18.9 billion of net assets exited the sector”, says Brown. Share buybacks accounted for £10.2 billion and “there was a wave of managed wind-downs and liquidations”. There were also numerous mergers, usually involving a partial return of capital. Against 27 names disappearing (after 24 in 2024), there was only one new issue, that of Achilles Investment, which raised £54 million. Fundraising by existing trusts totalled £530 million.
Brown argues that “consolidation leaves behind a better-quality sector”, but it also reduces choice and competition. It may make sense to merge two competing trusts under the same management company, such as Throgmorton and BlackRock UK Smaller Companies, but a little internal rivalry can be beneficial and moving the management contract elsewhere is an alternative.
“The sector is at a pivotal crossroads, but all is not gloom,” says Brown. Regulatory hostility has diminished as a result of changes to cost-disclosure rules (after a hard-fought lobbying campaign), but listed investment companies have still been excluded from the Pension Schemes Bill as qualifying assets for defined-contribution default pension funds. Wealth managers and other professional investors dislike what they regard as the sub-contracting of their job to another fund manager, even if it results in better performance or exposure to an area of the market they do not cover.
Yet closed-end funds provide rare access to unlisted giants, such as SpaceX, as well as to property, infrastructure and other illiquid assets. The government’s preference for theoretically semi-liquid “long-term asset funds” (LTAFs) shows that the lessons of past fiascos with open-ended property funds have not been learned, or have been ignored. Brown questions whether semi-liquid funds offering redemptions of just 5% per quarter will be able to cope with market volatility and questions the practice of private-equity LTAFs buying secondary investments at a discount and then marking them up to net asset value.
Good performance has continued into 2026, with a 1.9% total return up to mid-February. The S&P 500 has been flat in sterling terms, but other markets, notably the UK, emerging markets and small and mid-caps, have continued to perform well. Yet, says Brown, £8.9 billion worth of strategic reviews, managed wind-downs and mergers are in the pipeline, not including the merger of BlackRock’s two smaller companies trusts.
The worst of times is the best of times
The reality is that investment companies are performing well, not because of net buying, but because trusts are shrinking faster than investors are selling. It’s not just trusts that investors are selling; there have been £119 billion of net outflows from UK equity-focused and UK-domiciled open-ended funds in the last ten years, of which £74 billion has been in the past four years. Some of this has gone into passive funds, such as exchange-traded funds (ETFs), and some into US/global funds, but UK-based investors are net sellers, especially of their home market. Investment trusts focused on the UK are only a modest part of the total, but all of them are UK-listed, so are caught up in the rush for the exit.
Contrarian investors will regard that as a reason to be relaxed about investing. In time and with continuing good performance, net buying will return to the investment trust sector, discounts will become much narrower or disappear, and there will be an avalanche of issuance, including of new trusts in a cycle that has been repeated multiple times in the last 50 years. At that point, but probably not before, it will be time to start battening down the hatches and preparing for tough times.
How you could bank tens of thousands of dollars in yearly dividend cash for every $500,000 invested, and …
A half-million dollars is a lot of money. Unfortunately, it won’t generate much income if you limit yourself to popular mainstream investments.
The 10-year Treasury pays around 4.1% as I write this. That’s not bad, historically speaking, but put your $500K in Treasuries and you’re only looking at $20,500 in investment income, right around the poverty level for a two-person household. Yikes.
And dividend-paying stocks don’t yield nearly enough. For example, Vanguard’s popular Dividend Appreciation ETF (VIG) pays around 1.6%. Sad.
When investment income falls short, retirees are often forced to sell their investments to supplement their income.
Of course, the problem here is that when capital is sold, the payout stream takes an immediate hit – so that more capital must be sold next time, and so on.
Avoid the Share Selling “Death Spiral”
Some financial advisors (who are not retired themselves, by the way) say that you can safely withdraw and spend, say, 4% of your retirement portfolio every year. Or whatever percentage they manipulate their spreadsheet to say.
Problem is, in reality, every few years you’re faced with a chart that looks like this.
Apple’s Dividend Was Fine – Its Stock Wasn’t
As you can see, the dividend (orange line above) is fine — growing, even — but you’re selling at a 25% loss!
In other words, you’re forced to sell more shares to supplement your income when they’re depressed.
Remember the benefits of dollar-cost averaging that built your portfolio? You bought regularly, and were able to buy more shares when prices were low?
In this case, you’re forced to sell more shares when prices are low.
When shares rebound, you need an even bigger gain just to get back to your original value.
The Only Reliable Retirement Solution
Instead of ever selling your stocks, you should instead make sure you live on dividends alone so that you never have to touch your capital.
This is easier said than done, and obviously the more money you have, the better off you are. But with yields still pretty low, even rich folks are having a tough time living off of interest today.
And you can actually live better than they can off of a (much) more modest nest egg if you know where to look for lesser-known, meaningful and secure yield.
I’m talking about annual income of 8%, 9% or even 10%+ so that you’re banking $50,000 (and potentially more) each year for every $500,000 you invest.
You and I both know an income stream like that is a very nice head start to a well-funded retirement.
And it’s totally scalable: Got more? Great!
We’ll keep building up your income stream, right along with your additional capital.
And you’ll never have to touch your nest egg capital – which means you won’t have to worry about or running out of money in retirement, or even the day-to-day ups and downs of the stock market.
The only thing you need to concern yourself with is the security of your dividends.
As long as your payouts are safe, who cares if your stock prices swing up or down on a given day?
Most investors know this is the right approach to retirement.
Problem is, they don’t know how to find 8%, and 10% yields to fund their lives.
And when they do find high yields, they’re not sure if these payouts are safe. Will the company or fund have enough cash flow to pay the dividends into the future?
And how sensitive are these payouts to the latest headline, Fed policy change or unrest on the other side of the globe?
We’ll talk specific stocks, funds and yields in a moment.
But first, a bit about myself.
I graduated cum laude with an industrial engineering degree — which is actually pretty popular with Wall Street recruiters.
But I couldn’t stand the thought of grinding it out in a cubicle for 80 hours a week. So I moved to San Francisco and got into the tech scene.
A buddy and I started up two software companies that serve more than 26,000 business users.
The result was a nice chunk of change coming in … and I had to decide what to do with my money.
I had seen plenty of young “techies” come into sudden cash and burn through their windfall in a year, ending up right back where they started.
That was NOT going to be me. I already had dreams of living off my wealth one day, decades before I retired.
I got plenty of cold calls from brokers wanting to “help” me. But I knew that nobody would care as much about my money as me.
So I went out on my own and invested my startup profits in dividend-paying stocks.
I’ve been hunting down safe, stable and generous yields ever since, growing my wealth with vehicles paying me 8%, 9%, even 10%+ dividends.
Over the past 10+ years, I’ve been writing about the methods I use to generate these high levels of income.
Today I serve as chief investment strategist for Contrarian Income Report — a publication that uncovers secure, high-yielding investments for thousands of investors.
Since inception, my subscribers have enjoyed dividends 5 times (and much more!) the S&P 500 average, plus big annualized gains!
And that brings me to a crucial piece of advice…
The ONE Thing You Must Remember
If I could leave you with just one nugget of investing wisdom today, it would be to NEVER overlook the incredible wealth-building power of dividends.
Few investors realize how important these unglamorous workhorses actually are.
Here’s a perfect example…
If you put $1,000 in the dividend-paying stocks of the S&P 500 back in 1973, you would have had $96,970 by the end of 2024, or 97x your money.
But the same $1,000 in the non-dividend payers would have grown to just $8,990 — 91% less.
That’s why I’m a dividend fan.
The stock market is a fantastic wealth-building machine, but it doesn’t always go straight up!
There have been plenty of 10-year periods where the only money investors made was in dividends.
And that’s what gives us dividend investors such an edge.
When you lock in an 8%+ yield, you’re booking an income stream that’s bigger than the stock market’s long-term average return right off the bat.
Of course you can’t just buy every ticker symbol out there with a flashy yield, or you’ll get burned pretty fast.
So let’s wipe the false promises of mainstream finance from our minds and start thinking the “No Withdrawal” way…
Step 1: Forget “Buy and Hope” Investing
Most half-million-dollar stashes are piled into “America’s ticker” SPY.
The SPDR S&P 500 ETF (SPY) is the most popular symbol in the land. For many 401(K)’s, this is all there is.
And that’s sad for two reasons.
First, SPY yields just 1.1%. That’s $5,500 per year on $500K invested… poverty level stuff.
Second, consider a hypothetical year when, say, SPY fell 20%, not at all out of the question, given the multiyear run stocks have been on. Just from that alone, your $500K would be slashed to $400K.
SPY was down nearly 20% that year. That is no bueno, because that $500K would have been reduced to $400K.
The last thing we want to do is lose the money we’re getting in dividends (or more) to losses in the share price. Which is why we must protect our capital at all costs.
Step 2: Ditch 60/40, Too
The 60/40 portfolio has been exposed as senseless.
Retirees were sold a bill of goods when promised that a 60% slice of stocks and 40% of bonds would somehow be a “safe mix” that would not drop together.
Oops.
Inflation — plus an aggressive Federal Reserve, plus a (thus far) persistently steady economy — drop-kicked equities and fixed income before they went on a serious bull run in 2023, 2024 and into 2025 (with a brief interruption for the April “tariff tantrum.”)
It just goes to show that bonds are not the haven guaranteed by the 60/40 high priests. They could easily plunge just as hard (or harder) than stocks in the next economic crisis.
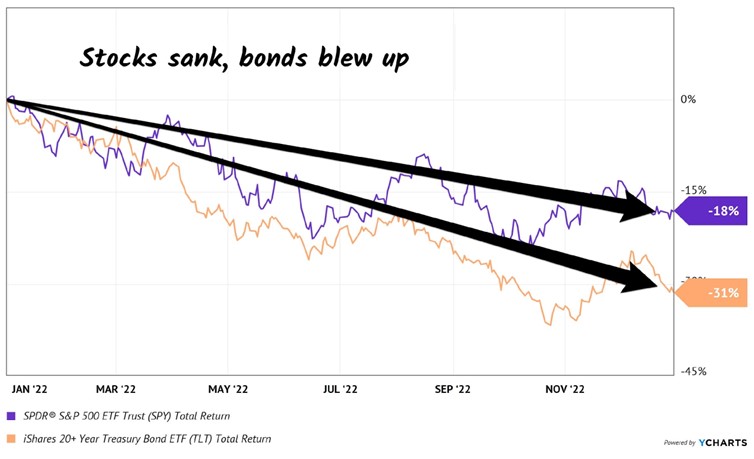
Just like they did in 2022 (sorry, we’re only going to spend one second on that disaster of a year). US Treasuries plunged, which resulted in the iShares 20+ Year Treasury Bond ETF (TLT) getting tagged.
Sure, it still paid its dividend. But even including payouts, the fund was down 31% — worse than the S&P 500. Ouch!
When stocks and bonds are dicey, where do we turn? To a better bet.
A strategy to retire on dividends alone that leaves that beautiful pile of cash untouched.
Step 3: Create a “No Withdrawal” Portfolio
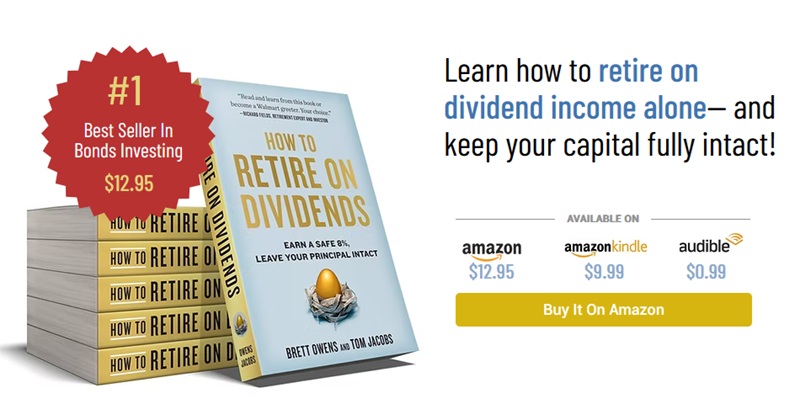
My colleague Tom Jacobs and I literally wrote the book on a dividend-powered retirement.
In How to Retire on Dividends: Earn a Safe 8%, Leave Your Principal Intact, we outline our “no withdrawal” approach to retirement:
Save a bunch of money. (“Check.”)
Buy safe dividend stocks with big yields
Enjoy the income while keeping the original principal intact.
To make that nest egg last, and our working life worthwhile, we really need yields in the 7% to 10% range. We typically don’t see these stocks touted on Bloomberg or CNBC, but they are around.
Of course, there are plenty of landmines in the high-yield space. Some of these stocks are cheap for a reason. Which is why we need to be contrarian when looking for income.
We must identify why a yield is incorrectly allowed to be so high. (In other words, we need to figure out why the stock is priced so cheaply!)
The Only Reliable Retirement Solution
Instead of ever selling your stocks, you should instead make sure you live on dividends alone so that you never have to touch your capital.
Shares climb a wall of worry and in times of market stress, sleep soundly at night knowing that when the dividends roll in you will be buying shares at a lower price and therefore a higher yield. If you buy the correct shares, you should enjoy that gently increasing yield for as long as you own the share.
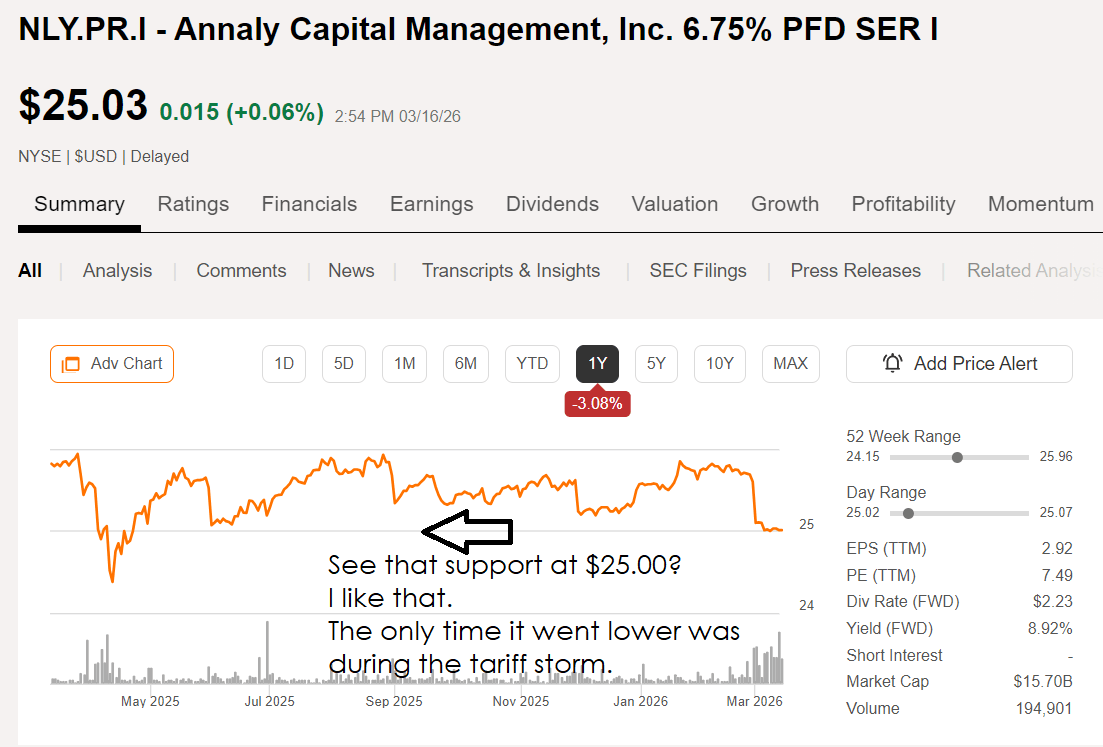
8.9% Dividend Yield Finally Enters The Buy Zone From Annaly Capital Preferred Share
Mar. 16, 2026
Colorado Wealth Management Fund
Investing Group Leader
Summary
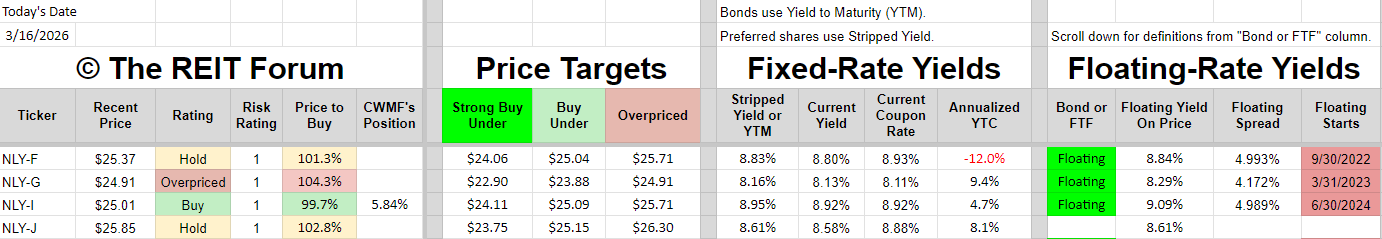
Yield near 9%. Price support from retail investors about a penny below market price. Solid yield-to-risk ratio. Modest upside.
Among Annaly Capital Management’s preferred shares, NLY-I is more attractive than NLY-F, benefiting from a favorable dividend calculation and trading at a lower price with a better yield.
I picked up 4,148 shares of NLY-I, representing over $100k.
Despite being callable, NLY-I has not been redeemed, and historical trading patterns suggest strong price support just below $25.
The REIT Forum members get exclusive access to our real-world portfolio. See all our investments here »
Capuski/E+ via Getty Images
Annaly Capital Management (NLY) has 4 series of preferred shares. I’ve traded in them from time to time. Currently, the one I’m excited about is NLY-I (NLY.PR.I).
I’ve written about shares of NLY-I several times. However, it has been rare for us to be able to post bullish ratings on them. Often the shares are just slightly above our targets for entry at The REIT Forum. That means that they are usually around 0.2% to 1.5% above our targets. Our targets adjust for dividend accrual, so they continue to increase leading up to the ex-dividend date, and then they fall by the dividend amount.
Opportunity Strikes
Recently, we have seen a little bit of weakness in shares of NLY-I. The weakness is allowing us to come out with a bullish rating. Presently, shares of NLY-I are trading at $25.01. That gives them an annualized yield to call of about 4.7%. That sounds quite pathetic. However, investors should recognize that the low yield to call would only happen if shares were called immediately. If there is any delay before the call happens, then the investors would be collecting a stripped yield of about 8.94% during that time. That is far more attractive.
Annaly Capital Management Could Have Called
Annaly Capital Management has had plenty of opportunities to call these shares already. They became callable and began floating on June 30, 2024. We are about 21 months past the date when shares became callable.
Further, shares of NLY-F (NLY.PR.F) are also floating-rate shares with a very similar spread. Those shares began floating on September 30, 2022. NLY-F has not been called despite floating for over 3 years.
Relative Value
I believe NLY-I is more attractive than NLY-F because NLY-I costs 36 cents less ($25.01 vs. $25.37) and the yield is better.
The REIT Forum
The dividend policy results in NLY-I having dividends that are a tiny bit larger. At first glance, it would appear that NLY-F would have the slightly larger dividends because the floating spread is higher by 1.4 basis points (basically a rounding error). However, NLY-I utilizes a more favorable method for calculating dividends. It uses the actual number of days in a dividend period divided by a 360-day year. That sounds complicated, but I’ll make it simple.
Take 365 days of accrual and divide by 360 days (the official number of days).
You get 1.0138889.
Round it to 101.4% because I don’t want to type that many digits again.
Therefore, NLY-I gets about 101.4% of the dividend accrual that would normally be expected for each year.
Consequently, our targets for NLY-I are slightly higher than our targets for NLY-F. However, the market has been valuing NLY-F at a higher price than NLY-I. Consequently, the annualized yield to call for NLY-F is negative, but the annualized yield to call for NLY-I is okay. Not great, but it’s okay. Remember that you only get such a low yield if the shares are called immediately after you purchase them. If the shares remain outstanding for longer, then the yield turns out quite a bit better. If they are not called at all, then you have a yield around the stripped yield of 8.95% with quarterly payouts. That’s pretty good.
Since the shares could be called on 30 days’ notice, we are coming to our estimate for annualized yield to call using that brief 30-day window. Being stuck with a return of 3% to 5% for a month is not bad. But if you get under 3%, then you really want it to be related to a brief period. This is a bit strange because, all else being equal, you typically want call protection to exist.
You won’t find call protection on the shares that are already floating, though. The floating-rate shares in this sector were all initially fixed-rate shares that switched over to a floating rate at the same time that the shares became callable. Because treasury rates increased significantly a few years ago, the floating-rate shares became significantly more attractive.
Note About NLY-G
NLY-G is almost always above our targets. I punish it for having such a thin floating spread. The market doesn’t seem to mind, but I find it as a bigger issue because it makes NLY-G even more reliant on short-term interest rates.
Setting Targets
One of my goals in setting the targets for NLY-I was that they would result in a very slightly positive yield to call. Today we have a positive yield to call and a slight discount to our target prices. Consequently, I am approaching shares with a mindset of collecting the attractive yield until we see a bump in the price. I believe we will most likely see a modest increase in the stripped price at some point. That means the share price adjusted for dividend accrual would probably increase by 0.5% to 1.5%. So the objective is to collect the dividend yield for now and then eventually collect a modest price improvement.
If we see the stripped price going up by about 1% or 1.5%, that could be a signal to me that it would be time to consider taking the gains and looking to reallocate. These are pretty steady shares, though. If the market tips lower, they probably won’t fall all that much. In that case, I might end up with mediocre performance but strong relative performance. That would still be okay, because it would allow us to reallocate at favorable ratios. Don’t let perfect be the enemy of good.
Of course, it is always possible that a share price could decline further. However, historically, we haven’t seen that much. Since NLY-I began floating, it has very rarely traded below $25. That makes sense for a few reasons. The first is that it results in a yield around 9% or even higher when the Fed funds rate was higher. The next is that there are more buyers for shares around $25 because there are many retail investors who would scan for shares that offered a high yield and traded below $25. That creates a decent level of support for the shares and explains why they have been so resistant to moving below $25 aside from the large hit to the markets around Liberation Day.
Seeking Alpha
For People Who Are New to Annaly Capital Management
Annaly Capital Management is a mortgage REIT. They own a bunch of mortgage-backed securities. The vast majority of the portfolio is in agency mortgage-backed securities. Those have very strong credit qualities because they are supported by Fannie Mae and Freddie Mac. Consequently, the mortgage REITs that focus on agency mortgages, like Annaly Capital Management, Dynex Capital, and AGNC Investment Corp., typically have a low-risk level for their preferred shares. Some investors absolutely love the business model for the agency mortgage REITs. They see a big dividend yield on the common shares and significant “earnings,” which makes the shares look very cheap on a price-to-earnings multiple.
However, many of those investors don’t understand how the earnings metric for mortgage REITs works. They may be confused with the way yields are calculated based on historical price and how hedges flow through the income statement. Consequently, for most investors, it is much better to focus on the preferred shares. We cover the common shares within our service. However, presently, the REIT forum finds NLY-I much more attractive than the common shares.
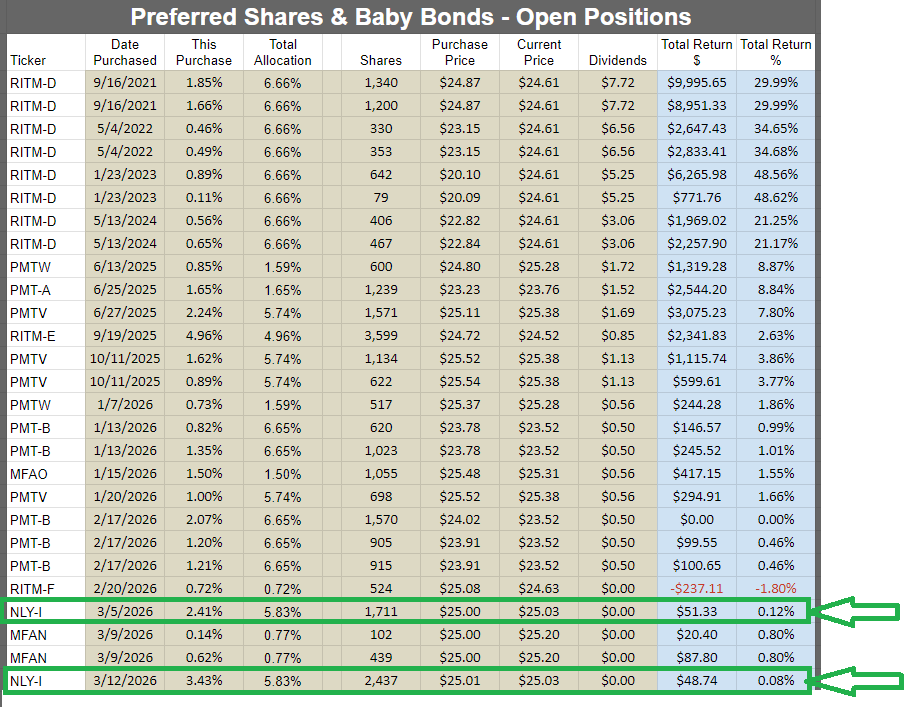
Big Position
I’ve been buying NLY-I lately. This screenshot is from our tool for subscribers that shows all our open positions. We separate the preferred shares and baby bonds from the other sectors, so this only shows the preferred shares and baby bonds:
The REIT Forum
It cuts off before showing the new positions we added on 3/16/2026, but I think that’s quite a large amount of open trades for an analyst to include in their article.
Conclusion
NLY-I offers an attractive combination of steady valuation and solid dividend yield. While it could drop further, I find it unlikely. I expect quite a bit of resistance around $25.00, as it shows up on the screening tools for more investors when it hits that price or a couple of pennies below.
Consequently, I believe the downside is relatively low while the yield is high. We have the potential for modest upside in the share price, but I would only expect around 1% to 1.5% beyond dividend accrual. Since dividend accrual is running nearly 9%, that’s not too bad.
I put over $100k into acquiring 4,148 shares of NLY-I. I eat my own cooking. Right now, it tastes like 9% with a bit of upside.
We are not rating NLY common shares in this article.
With a KISS plan to re-invest all dividends back into the share until you need to spend your dividends.
You don’t need to take high risks with your hard earned but be ready when Mr. Market gives you an opportunity and then overcome your trepidation as Mr. Market will look very bleak.
Are UK income trust yields a problem for investors?
By Val Cipriani IC
Published on March 17, 2026
It’s a basic principle of investing: when prices go up, yields go down. This applies to equity income assets as well as bonds. In the past year, UK companies have seen their share prices rise enthusiastically – even after the dip caused by the war in Iran, the FTSE All-Share is up 22.4 per cent in the year to 16 March
The flipside is that a stock market known for its income generation actually generates a lot less income than it used to, at least as a proportion of the price you pay for the assets. In December 2023, AJ Bell estimated a dividend yield for the FTSE 100 of 3.9 per cent for that year and 4.2 per cent for 2024. Fast forward two years, and the figures were 3.2 per cent for 2025 and 3.4 per cent for 2026. The drop has also partly been caused by companies sometimes prioritising buybacks over dividends.
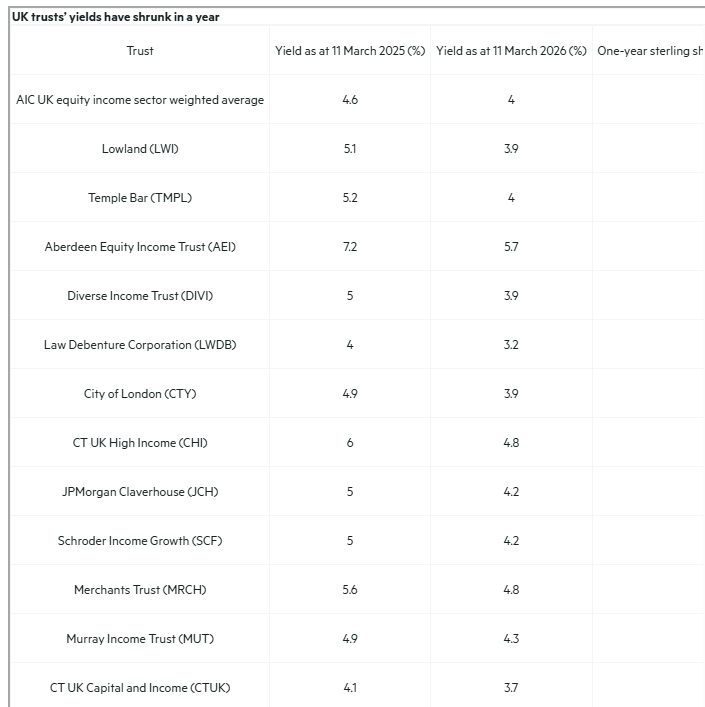
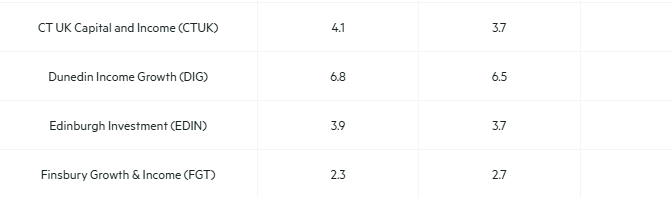
Investment trusts in the Association of Investment Companies’ UK equity income sector are also yielding less as a result. In the past year, the sector’s average yield has fallen by 0.6 percentage points. The table below shows how the trusts’ yield has changed over the course of a year, as well as their share price performance over the period.
As you’d expect, there is some correlation between those that have performed particularly well and those on lower yields. The six top performers, whose shares returned around 30 per cent or more, all saw their yields decrease by more than a percentage point. These trusts tend to take a value approach, particularly Lowland (LWI) and Temple Bar (TMPL), which now yield around 4 per cent, and traditionally invest in dividend-rich sectors, such as financials.
Then there are trusts with a quality tilt, whose performance has been less strong. Some of these have traditionally tended to have lower yields than their value counterparts, but now look more attractive on this metric – at 3.7 per cent, Edinburgh Investment Trust (EDIN) now yields nearly as much as City of London (CTY), for example. Nick Train’s Finsbury Growth & Income (FGT), the one trust in the sector that lost money this year, actually saw its yield increase as a result of this drop, albeit at 2.7 per cent it remains relatively meagre compared with peers.
For some trusts, discounts to net asset value (NAV) have also narrowed as well as yields, with the sector’s average discount dropping from 5.6 per cent on 28 February 2025 to 3.7 per cent a little more than a year later.
Of course, yields are not everything. Dunedin Income Growth (DIG) has the highest yield in the sector – 6.5 per cent – after introducing an ‘enhanced’ dividend policy that will see it pay out 6 per cent of its NAV, partly out of capital; but its performance record over the past five years looks decidedly poor.
After such a long period of lukewarm performance for the UK market, it would be ridiculous to complain about this change in fortune, regardless of whether or not it lasts. But income investors are less spoiled for choice. They may want to review their portfolio, and remember that the UK market is not the only option – for example, investment trusts in the AIC global equity income and Asia Pacific equity income sectors yield 3.8 per cent and 5 per cent, on average, respectively. That compares with a UK average that has fallen from 4.6 per cent to 4 per cent over the past year.
BUYING YIELD
It’s a win, win, because when you buy a dividend hero Trust the yield you will receive is the yield when you buy, gently increasing as long as you own the Trust
Remember as an example only if you buy PHP today you should receive 5 dividends in just over the calendar year, an enhanced yield of around 9%. of course there is a chance of a capital gain/loss but if you need to pay your grocery bill, a Trust to DYOR
RUNNING YIELD
It’s a win,win because if you buy a dividend hero as the price rises the yield falls and hopefully, you could if you
You could achieve
In that you take out your stake, when/if the Trust doubles and re-invest in another high yielder, also receiving income from a Trust that sits in your Snowball at zero, zilch cost. If the Trust you own becomes a low yielder because the price has risen, you can always re-invest the dividends back into your high yielding shares in your Snowball.
The power of the market is that if you don’t CPA, losses are limited to 100% but gains are unlimited.
My “Battleship” Plan for 8.2%+ Dividends (Paid Monthly)
Brett Owens, Chief Investment Strategist Updated: March 17, 2026
The bombs continue to fall in the Middle East. But we contrarians know something the crowd always forgets at times like this:
The world is always burning somewhere.
At times like these, our Contrarian Income Report dividend strategy shines. Our portfolio yields 8.2% on average, and those dividends roll in no matter what the world throws at us.
The result? No need to sell into a downturn to get the cash we need. And we get the chance to go on offense, too, snagging dividends on the dips and boosting our income stream (and upside potential) as we do.
Rinse and repeat.
We especially love stocks and funds that pay us monthly, for two reasons:
They line up perfectly with our bills.
They let us reinvest our dividends faster—especially when markets dip.
The problem for most investors is that they limit themselves to the fan favs of the S&P 500, and there are virtually no monthly payers there. But we know there are plenty to be found if we hunt just a little off the beaten path.
Best of all, we can get those high monthly divvies without giving up the large caps we already hold. The key is to buy them through closed-end funds (CEFs), which yield around 8% on average. Plus, most of the 400 or so CEFs out there pay dividends monthly.
Here are two that stand out now.
Monthly Dividend Pick No. 1: A Diversified Pick With an 8.2% Dividend
The BlackRock Enhanced Equity Dividend Trust (BDJ) is purpose built for a market like this. For starters, its portfolio is balanced among stock sectors—finance is the biggest slice, at 19% of assets, followed by industrials (14.5%), healthcare (14.2%) and technology (12.5%).
Then it goes further, adding in a dash of global exposure, with about 12% of assets outside the US, in stable countries like the UK, South Korea, Germany and Canada.
Let’s get to what we really want to know about here: the (monthly!) dividend, which is not only hefty but has risen a stout 32% in the last decade (not including special dividends, which BDJ has paid five times in that span):
The fund aims to hold at least 80% of its portfolio in dividend-paying stocks. Right now, its holdings include the likes of Amazon.com (AMZN) and medical-device maker Baxter International (BAX), both of which stand to gain as AI boosts their efficiency; Dollar General (DG), which is nicely set up as consumers cut costs; and BP plc (BP), a clear winner from rising oil.
BDJ further bulks up the divvie by selling options on about half of its holdings. That increases income, particularly in volatile markets.
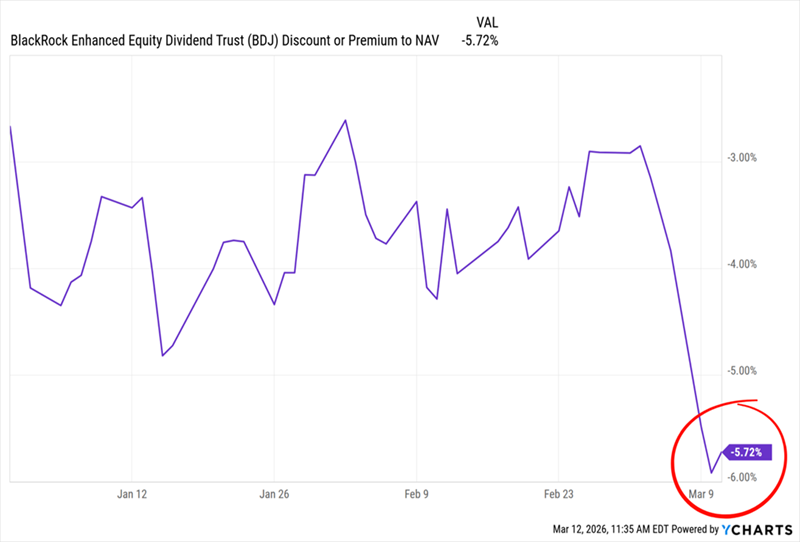
But despite these strengths, investors have unfairly tossed BDJ aside. As I write this, the fund’s discount to net asset value (NAV, or the value of its underlying portfolio) sits at 6%, having nearly doubled since hostilities broke out in Iran.
BDJ Goes On Sale—as Its Discount Looks for a Bottom
That’s a clear overreaction. And if you look at the right side of that chart, you can see that its discount is looking to form a bottom. That sets up a nice entry point for those on the hunt for a well-diversified monthly paying stock fund.
Monthly Dividend Pick No. 2: An 11.5% Payer With a “Discount in Disguise”
We’ve talked in recent days about how AI is deflationary because it caps wage growth as businesses automate more tasks. Add a cooling job market and a new Fed chair who’s likely to lean toward lower rates, and you get a strong outlook for bonds.
The PIMCO Corporate & Income Opportunity Fund (PTY) is perfectly set up for that. The fund stands out for a lot of reasons, but a key one is the long effective maturity on its credit assets: just over seven years as I write this.
That’s important because longer-duration bonds do better when rates decline, as they’re more attractive than new (and lower-yielding) debt.
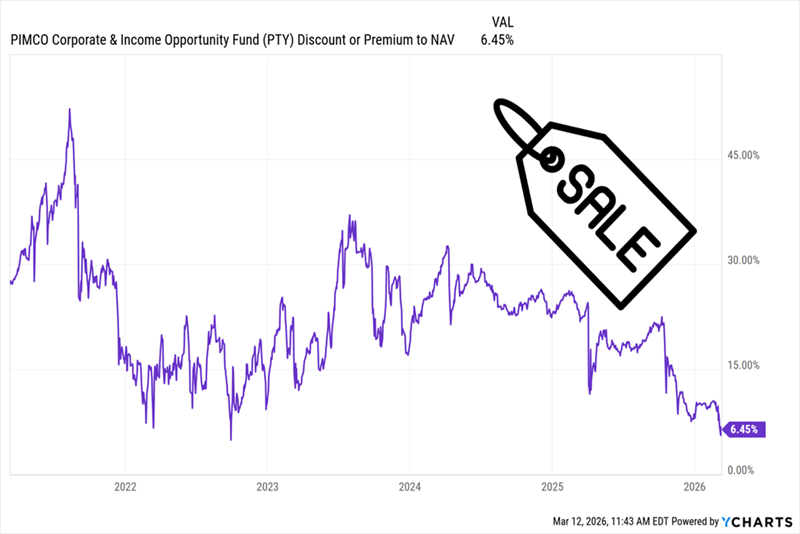
Moreover, PTY’s effective leverage-adjusted duration is 3.8 years. That’s enough to position it for gains on lower rates without taking on too much risk if rates rise. With all that in mind, it’s surprising (to me) that PTY is trading at such a bargain now.
That might sound like an odd thing to say about a fund that trades at a 6.5% premium to NAV. But with CEF discounts and premiums, context is everything. And the truth is, PTY is on sale at that level. In fact, that premium is lower than it’s been since the bond (and stock) meltdown of 2022.
PTY’s “Discount in Disguise”
The fund’s drop in valuation is overdone. And if you look at the right side of that chart, it looks like that premium is carving out a bottom, similar to what’s happening with BDJ.
But why the premium in the first place?
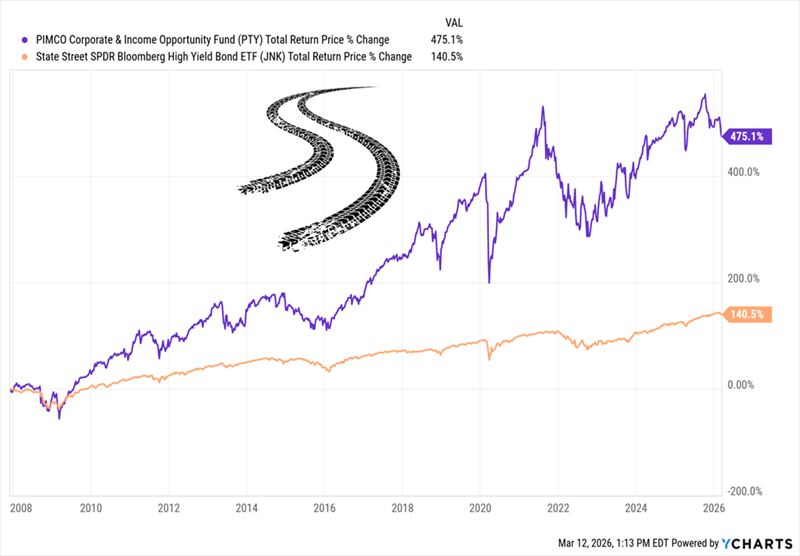
It’s simply because PIMCO, founded by legendary investor Bill Gross in the ’70s, has long had an almost superhuman mystique. That’s why most of its funds trade at premiums—many with bigger ones than PTY.
Even without the “PIMCO aura,” it’s tough to argue that PTY hasn’t earned a premium. The fund has been around since 2002, longer than the benchmark US corporate-bond ETF, the SPDR Bloomberg High Yield Bond ETF (JNK). In the years since, PTY has clobbered that benchmark.
PTY Laps JNK—Again and Again
Reinvested dividends drove that return, thanks to PTY’s huge monthly payout.
Despite a slight cut during COVID, PTY’s payout has held steady for years. And besides, its regular special dividends (the spikes and dips above) have gone a long way toward making up for that cut.
I expect that to continue as the wind shifts toward lower rates and this proven income generator reclaims the premium its track record deserves.
Cash ISA vs stocks and shares ISA: which is better for your money?
The debate over low-risk cash ISAs versus higher-returning stocks and shares ISAs overlooks the fact that both have an important role for different goals
By Laura Miller
Contributions from Dan McEvoy
(Image credit: mustafaU via Getty Images)
Deciding whether to put your money into a cash ISA or a stocks and shares ISA has always been a head-scratcher.
However new data points to a huge gap in potential gains possible, with a significant gulf between the biggest cash ISAs and stocks and shares ISAs.
The 25 highest-value ISAs in the UK now hold a combined £274.4m, up by more than £50m in just one year, making each of their owners a multi-millionaire, according to figures obtained by investment platform InvestEngine through a Freedom of Information (FOI) request to HMRC.Article continues below
Stay ahead of the curve with MoneyWeek magazine and enjoy the latest financial news and expert analysis, plus 58% off after your trial.
On average, each of these accounts is worth almost £11 million, and they are all stocks and shares ISAs. In comparison, the 25 highest value cash ISAs have a combined value of £16 million, meaning each is worth on average £10.3 million less at £640,000.
The FOI data also shows that the number of ISA millionaires in the UK has now reached 5,070. This is up by 220 in the past year and nearly ten times higher than the 570 recorded in 2016, according to HMRC. As the 25 highest value cash ISAs have an average value of just £600,000, most ISA millionaires will have reached this level of wealth through stocks and shares.
The difference between saving and investing is further highlighted by the fact that an individual who had maxed out their cash ISA allowance every year since ISAs were launched in 1999, earning interest in line with the average interest rate banks lend money to each other, would have accumulated £418,176 by February 2026.
In contrast, someone who invested their full allowance each year in a stocks and shares ISA – such as an exchange-traded fund (ETF) tracking global stock markets – would now be an ISA millionaire, with £1,357,964 in their account, more than three times higher than the equivalent in a cash ISA.
How can ISA investments make you an ISA millionaire?
As the figures show, investing is one of the most effective ways to grow long-term wealth, but factors like fees can still make a significant difference to the final gains. Two people investing £1,000 each month over 20 years, achieving the same real returns of 5% per year, could end up with a difference of more than £43,000 in today’s money purely because one paid 1% in annual fees while the other paid none, by InvestEngine’s calculations.
Andrew Prosser, head of investments at InvestEngine, said: “The proof is in the pudding: those who have consistently invested their full ISA allowance in stocks and shares since 1999 are now over three times better off than savers who have done the same using cash ISAs.
“This long-term outperformance is already translating into real-world outcomes, with the number of ISA millionaires continuing to climb and reinforcing how investing early and consistently in a diversified portfolio can make a meaningful difference to long-term, tax-free wealth as part of a broader financial plan.
“With the government increasingly encouraging people to invest rather than rely on cash for long-term saving, the widening gap between investors and cash savers is becoming hard to ignore.”
Government ISA reforms
Following ISA reforms at the 2025 Autumn Budget, the differences between cash and stocks and shares ISAs have been thrust into the spotlight.
Chancellor Rachel Reeves confirmed she would cut the annual cash ISA allowance to £12,000 from April 2027, meaning savers under the age of 65 would need to put £8,000 into stocks and shares in order to maximise their annual £20,000 allowance. Over 65s can continue using the full ISA allowance of £20,000 with cash ISAs, if they wish to.
The government has been very vocal as well about the desire for more investment in the UK, and by April 2026, the Retail Investment Campaign is expected to be launched. The initiative is intended to raise awareness of the importance of investing for people’s future financial wellbeing and highlight the value of investing to the economy.
Whether saving or investing is best for your money will depend on your financial circumstances and your goals. For instance, it’s recommended people hold an easy to access emergency savings pot which covers three to six months of essential spending, before considering locking money away, such as in investments.
Why choose between cash ISAs and stocks and shares ISAs?
Putting money into cash ISAs or savings accounts will offer security that your money will grow over time in nominal terms.
But advocates of investing often highlight that in real terms, cash holdings tend to be eroded by inflation over time, despite a recent period when the best cash ISAs typically offered above-inflation rates – around 4.47% as of November 2025, for example.
Analysis from AJ Bell shows that £1,000 deposited into the average cash ISA when ISAs were launched in 1999 would, as of December 2025, be worth £2,079. The same investment into UK stocks via a typical UK All Companies fund would be worth almost twice as much, at £3,787.
“These figures highlight the hidden cost of playing it safe,” said Laura Suter, director of personal finance at AJ Bell. “While keeping money in cash can feel comfortable, over time it’s an almost guaranteed way to lose purchasing power.”
Stocks and shares ISA returns have outpaced cash ISAs over the past 12 months, according to the latest analysis by Moneyfacts.
The average stocks and shares ISA fund experienced a growth of 11.22% over the past 12 months from February 2025 to February 2026. There have now been three consecutive years of positive growth returns for stocks and shares ISAs. In contrast, the Moneyfacts average cash ISA rate returned 3.48% over the same period. Furthermore, the average cash ISA return is down compared to the previous 12 months.
Rachel Springall, finance expert at Moneyfacts, said: “Stocks and shares ISAs have now outperformed cash ISA returns for a consecutive year. Over the past 12 months alone, investing in stocks and shares has returned three times more to savers than a cash ISA, based on average returns.
“This should be a wake-up call for those who fear investing, as cash returns have diminished. However, it is important to not rely on returns over the shorter-term when making longer-term investment decisions.”
1 February 2025 to 1 February 2026
% growth
Average stocks & shares ISA
11.22%
Best-performing stocks & shares ISA fund sector
38.24% (Latin America*)
Worst-performing stocks & shares ISA fund sector
-4.03% (Healthcare)
Average cash ISA rate
3.48%
1 February 2024 to 1 February 2025
% growth
Average stocks & shares ISA
11.86%
Best-performing stocks & shares ISA fund sector
34.74% (Financial & Financial Innovations)
Worst-performing stocks & shares ISA fund sector
-11.15% (Latin America)
Average cash ISA rate
3.80%
1 February 2023 to 1 February 2024
% growth
Average stocks & shares ISA
2.80%
Best-performing stocks & shares ISA fund sector
34.14% (Technology & Telecoms)
Worst-performing stocks & shares ISA fund sector
-32.46% (China/Greater China)
Average cash ISA rate
3.73%
1 February 2022 to 1 February 2023
% growth
Average stocks & shares ISA
-3.27%
Best-performing stocks & shares ISA fund sector
24.64% (Commodities and Natural Resources)
Worst-performing stocks & shares ISA fund sector
-32.81% (UK Index Linked Gilts)
Average cash ISA rate
1.71%
1 February 2021 to 1 February 2022
% growth
Average stocks & shares ISA
6.92%
Best-performing stocks & shares ISA fund sector
27.69% (Commodities and Natural Resources)
Worst-performing stocks & shares ISA fund sector
-21.98% (China/Greater China)
Average cash ISA rate
0.51%
Source: Moneyfacts
“Cash is considered a safe choice, but investing shows the gains that could be made over the longer-term,” said Springall. “Granted, past performance is not guaranteed to be repeated, so short-term gains should not be a decision maker in isolation. The past year alone laid bare the importance of seeking advice before taking the plunge to invest, some sectors boom one year and perform badly the next but can bounce back.”
How do regular investments compare to cash?
If you invested £1,000 into UK stocks every year since 1999, it would have been worth around £67,866 by the end of September 2025, AJ Bell analysis suggests, compared to just £36,290 if the same payments were made into a cash ISA.
The UK’s stock market has underperformed global competitors throughout that time period. £1,000 invested annually into global stocks would, over the same time, be worth £92,000, while putting it into US stocks would have seen the same investment grow to £127,887 – more than three times the size of the cash equivalent.
Header Cell – Column 0
£1,000 one-off investment
£1,000 investment every April
Average IA North America sector
£6,285
£127,887
Average IA Global sector
£5,158
£92,349
Average UK All Companies sector
£3,787
£67,866
Average cash ISA return
£2,079
£36,290
Average UK Gilts sector
£1,912
£33,931
Source: AJ Bell/Bank of England/FE. Data from 30 April 1999 to end of September 2025. Investment figures show average performance of sector including fund charges; inflation is based on CPI measure; cash ISA returns based on average interest rate available.
“Regular investing has been particularly powerful – turning steady contributions into six-figure sums thanks to the power of compounding,” said Suter. “Over that 26-year period the investment in the average North America fund would be nearly five times the total contributions.”
Is investing in stocks riskier than cash?
In the short term, stocks are more volatile than cash and, unlike cash holdings, they can potentially lose nominal value; that is the non-inflation-adjusted value of your investments can fall, whereas cash can’t.
“Markets don’t move in a straight line and there will always be periods of volatility,” said Suter. That makes stocks riskier than cash if viewed over a short time period.
But over the long term there is evidence to suggest that stocks are a safer investment in real (inflation-adjusted) terms.
Barclays Research into the real returns on cash, UK equities (stocks) and gilts since 1899 found that the longer you hold any of these assets for, the smaller the variation in your real returns. Over 20+ time periods, the minimum and maximum return on equities was higher than the equivalent for either cash or gilts.
This divergence between how stocks compare to cash over different time periods highlights the need for a balanced approach between the two, rather than either/or.
“When it comes to choosing between a cash ISA and a stocks and shares ISA, the key question is: are you saving for the short term or the long term?” said Suter. “If you’re setting money aside for an emergency fund, typically three to six months’ worth of expenses, then a cash ISA is a solid option.”
This way, any money you need at short notice or in the case of emergency is protected and easily accessible.
But for long term goals such as retirement plans or home improvements, Suter believes a stocks and shares ISA is more effective than a cash ISA.
“Markets tend to rise over time and outperform cash, despite short-term fluctuations,” she said.
How to choose between a cash ISA and a stocks and shares ISA
There is a further blow to cash savers following the Budget, as a higher rate of income tax on savings interest held outside a tax-efficient wrapper (like an ISA) will also apply from April 2027.
Despite the new cash ISA limit there is no need to “choose” between either a cash ISA or a stocks and shares ISA. The two are not mutually exclusive, and the government is expected to make further changes to help people allocate their excess funds however works best for them.
“From April 2026 a new ‘Targeted Support’ service will be available, which could equip more people to make the right financial decisions for themselves,” said Steven Cameron, pensions director at from Aegon. “This includes understanding the benefits of moving excess cash into a stocks and shares ISA, potentially benefitting from much higher returns, albeit at the expense of the ‘no loss’ security of cash savings.”