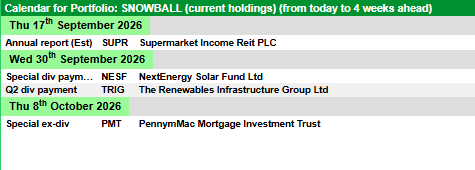
I’ve booked a ‘profit’ of £200 with TRIG to enable me to buy an opening position
in AGNC.
104 shares for 1k. The SNOWBALL is in a risk on mode so an opening position to monitor the share. Currently yielding 13%.
Company profile
AGNC Investment Corp is a real estate investment trust that invests in agency residential mortgage-backed securities. The firm’s asset portfolio is comprised of residential mortgage pass-through securities and collateralized mortgage obligations for which the principal and interest payments are guaranteed by a U.S. Government-sponsored enterprise, such as the Federal National Mortgage Association and the Federal Home Loan Mortgage Corporation, or by a U.S. Government agency, such as the Government National Mortgage Association. It also invests in other types of mortgage and mortgage-related residential and commercial mortgage-backed securities or other investments in or related to, the housing, mortgage, or real estate markets.
Regional REIT (LSE:RGL) reported a 5.1% decline in portfolio value to £526.7 million for the first half of 2026, reflecting property revaluations and £21.5 million of asset disposals.
EPRA net tangible assets declined 3% to £305.8 million, while EPRA earnings per share fell to 4.2 pence. The company reported rent collection of 99.7% during the period.
Regional REIT reduced its dividend to 4.0 pence per share for the half year and continues to target a total dividend of 8 pence per share for 2026.
Asset Disposals Reduce Loan-to-Value Ratio
The REIT continued to dispose of non-core properties as part of its strategy to reduce borrowings and reposition its portfolio.
These transactions contributed to a reduction in net loan-to-value to 38.5%, alongside a decline in gross borrowings.
Regional REIT completed 26 new lettings during the period, generating £1.9 million of annual rent at an average of 2% above estimated rental value.
The company also completed a £1.1 million letting in Nottingham, which reduced vacancy-related costs at the property.
Regional REIT Invests £1.4 Million in Portfolio Upgrades
Regional REIT invested £1.4 million in capital expenditure during the first half, with spending focused partly on improving the energy performance of its properties.
At the end of the period, 87% of the portfolio was rated EPC C or better.
The company’s repositioning strategy involves retaining and upgrading core assets while preparing non-core and value-add properties for disposal. Regional REIT said it has additional assets either under offer or in negotiations.
Management said leasing decision cycles remain extended and investment market activity subdued. The company is continuing its disposal and capital expenditure programmes while managing its regional office portfolio.
Second-Quarter Dividend Set at 2.0 Pence Per Share
Regional REIT declared a second-quarter dividend of 2.0 pence per share, payable in October 2026. The distribution will be classified entirely as a property income distribution.
Shareholders will also have the option to participate in a dividend reinvestment plan.
Management said low levels of regional office development, construction costs and government support for devolution could support demand and rental growth. These remain management’s expectations rather than established future outcomes.
More about Regional REIT Limited
Regional REIT Limited is a London-listed real estate investment trust focused primarily on commercial office properties in regional U.K. markets outside London.
The company manages a diversified portfolio of regional properties and uses asset management, capital expenditure and disposals as part of its portfolio strategy.
Its investment programme includes property upgrades intended to improve occupier appeal and energy performance, while its disposal programme is used to reduce exposure to non-core assets and manage leverage.
This article was written by the editorial team at InvestorsHub/ADVFN and is provided for informational purposes only.
CT UK Capital & Income Investment Trust PLC ex-dividend date Gore Street Energy Storage Fund PLC ex-dividend date Henderson High Income Trust PLC ex-dividend date JPMorgan Global Emerging Markets Income Trust PLC ex-dividend date
Michael Foster, Investment Strategist Updated: September 7, 2026
Look, we all know the old “truism” of investing: Want higher returns? You’d better be prepared to take on higher risk.
That’s not always true, however. In fact, sometimes markets do strange things, and a so-called “conservative” investment can turn around and deliver stunning returns. This is even more common in the world of closed-end funds (CEFs), where even stranger things can happen than in the “regular” stock world.
That’s in part because CEFs are a small market, so they tend to draw more individual investors, but fewer hedge funds and big banks. That can cause CEFs to overreact to some changes in the economy and markets and underreact to others, setting the stage for those strange moves I just mentioned.
Just such a thing has occurred at a CEF I’ve admired for many years, the 9%-yielding Virtus Equity & Convertible Income Fund (NIE). On the surface, this one sounds about as conservative as you can get.
For starters, its portfolio is stocked with established blue chips, with NVIDIA (NVDA), Apple (AAPL), Amazon.com (AMZN) and Caterpillar Inc. (CAT) among its top holdings.
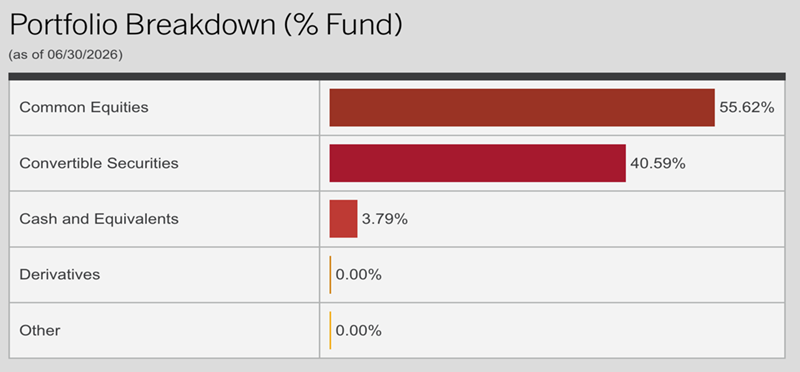
But as you can see below, only around 56% of the fund’s portfolio is in stocks. Another 40% or so is in convertible securities, with the balance in cash.
Source: Virtus Investment Partners
Those convertible securities give the fund additional income while tempering volatility. NIE holds both convertible bonds and convertible preferred stocks.
Convertible bonds are debts issued by companies that can be “converted” to equity in the right circumstances (these vary from bond to bond). That gives these assets more potential upside, in addition to a consistent income stream.
Similarly, convertible preferred stocks pay higher dividends than “regular” stocks and feature less volatility. Like convertible bonds, they can also be converted to common stocks for additional upside.
With such a large portion of the portfolio dedicated to assets like convertibles, you’d expect a fairly stodgy return from NIE. But that hasn’t been the case. At my CEF Insider advisory, we sold this fund in May for a sweet 58% total return in a little over four years.
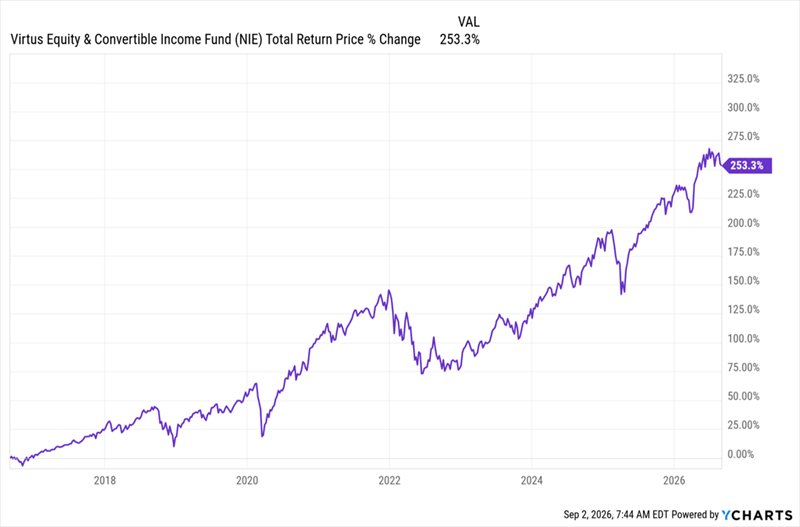
That’s a nice return for an income play like this, and we may very well swing back into this one in the future, especially when you consider that NIE has posted a 253% return in the last decade (we have, in fact, held it three times in CEF Insider over this period and banked a positive total return every time):
NIE Triples (and Then Some) in 10 Years
You can see at right, too, that the fund has largely moved sideways since our sell call in May, justifying our move and setting up the fund’s next jump, if history is any guide.
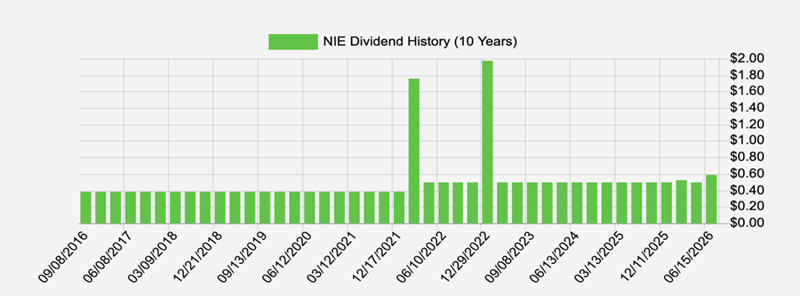
At the same time, NIE has been growing its payout, both in the form of special dividends paid earlier this decade and a growing regular dividend.
NIE’s Strong Returns Translate Into Higher Dividends Source: Income Calendar
With this in mind, it’s clear that NIE is a good way to maximize income and diversify across hundreds of companies—and multiple asset classes, too. At the same time, it delivers far better returns than you’d expect from a portfolio like this. That stands in sharp contrast to the “more risk, more return” logic most folks believe.
Let me wrap with the fund’s discount to net asset value (NAV, or the value of its underlying portfolio). As I write this, it’s around 10%, which means we can buy for around 90 cents on the dollar. That sounds great, but it’s around the fund’s five-year average discount and narrower than the roughly 12% NIE saw when we sold it in May.
So we’re not buying until NIE’s discount widens further—ideally below that 12% level from last May. Until then, though, this is a top-quality CEF to put on your watch list.
The UK income trust is performing well but has an unusual structure. We take a deep dive into its portfolio and positioning
Published on September 4, 2026
by Helen Kirrane ShareSave
UK equity income trust Law Debenture (LWDB) has had a strong 2026 so far, returning around 21 per cent – well ahead of the 12 per cent delivered by its benchmark, the FTSE All-Share.
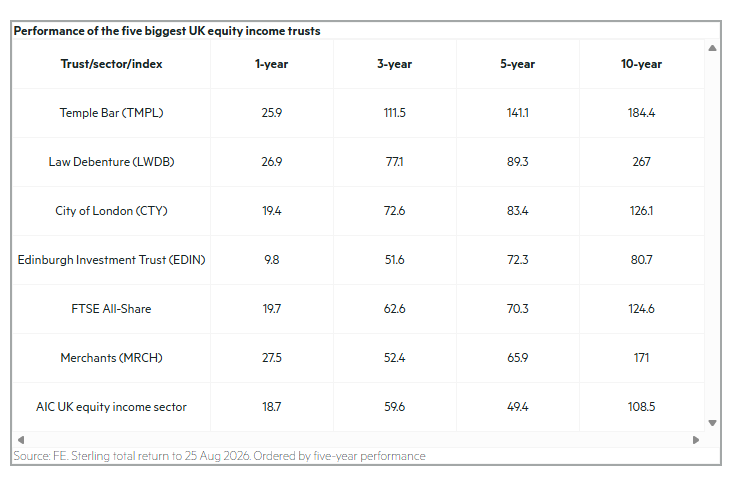
Its longer-term performance looks even more impressive: over three and five years, it is the second-best-performing trust in the 17-strong UK equity income sector and takes the top spot over a decade with returns of 267 per cent.
A consistent approach has been key to this result. James Henderson has been involved in running the trust for over 30 years and was joined by Laura Foll as joint portfolio manager in 2019.
In July, the trust announced that Henderson will be retiring next June, leaving Foll at the helm. Such a high-profile departure would typically spark concerns about style drift, but analysts seem to think it is unwarranted this time because Foll and the veteran manager have worked side-by-side for many years.
We take a deeper look at Law Debenture’s approach and speak to Foll about how the managers are positioning the portfolio.
Approach and structure
The pair adopts a moderately contrarian approach to find well-managed companies at low valuations. They seek to avoid concentration, maintaining around 140 holdings. “This is not a shortlist, high-conviction portfolio. It’s about having a long list of companies that we think are, on balance, too cheap,” Foll tells the IC.
This means they do not take big bets on individual stocks, and instead aim to invest across a broad range of assets. The top 10 holdings make up just 25.9 per cent of the portfolio. “We’re deliberately not taking too much stock-specific risk. We want [the portfolio] to be diverse rather than having big chunky holdings in any particular name,” explains Foll.
On this front, Law Debenture differs from rival Temple Bar (TMPL), which is the best-performing UK equity income trust over five years and has benefited from taking bigger contrarian bets.
Law Debenture is unique in that 15 per cent of its net asset value (NAV) comprises an independent professional services (IPS) business it owns.
This provides third-party financial services, such as pension trusteeship, and the profits it generates are redistributed as dividends to Law Debenture shareholders. Martyn King, an analyst at Edison, describes it as “a very important part of the trust’s overall performance” as the business has funded roughly a third of the dividends the trust has paid in the past 10 years.
This makes for a dependable income stream. “I basically know that at the start of any calendar year, when I turn up on day one, a third of the income is pretty much in the bag,” says Foll. This, in turn, affords the managers flexibility to invest in stocks not paying dividends that are not traditionally found in other UK equity income portfolios.
That’s not to say the trust eschews the usual UK income payers altogether. A look under the bonnet reveals HSBC (HSBA), Shell (SHEL), GSK (GSK) and Rio Tinto (RIO) among the five largest holdings.
Woman riding her old fashioned bicycle along the Beach Esplanade at Aberdeen, Scotland.
When it comes to passive income, investors often focus on chasing the highest yields available. But the real mistake is not picking the wrong yield it’s misunderstanding what actually makes income sustainable over time.
What actually makes passive income sustainable?
Sustainable passive income typically comes down to five key factors:
Earnings support
Cash flow strength
Payout discipline
Sector structure
Balance sheet resilience
At first glance, many income investors focus on the dividend yield. But each of these factors plays a more important role in determining whether that income can be maintained and potentially grown over time.
Earnings support is the foundation. Dividends are ultimately funded by profits, not share prices, and inconsistent earnings tend to lead to inconsistent income.
Cash flow strength matters just as much. Even profitable businesses can struggle to convert earnings into distributable cash, which creates hidden pressure on dividends.
Payout discipline determines flexibility. Companies that distribute too high a proportion of earnings have less room to absorb shocks when conditions deteriorate.
Sector structure also plays a role. Some industries naturally generate more stable revenue streams, while others are highly cyclical and more exposed to downturns.
Finally, balance sheet resilience provides protection when conditions weaken. High debt levels can force dividend cuts even when the underlying business remains profitable.
Taken together, these factors show that passive income is less about maximising yield, and more about identifying businesses capable of sustaining payments through different market conditions.
Importantly, the demand backdrop is also changing. Electricity networks are increasingly being shaped by structural trends such as AI-driven data centre growth, electrification of transport, and rising power demand across industrial systems. These are not cyclical drivers in the traditional sense, but longer-term shifts in energy usage.
That matters because regulated utilities typically earn returns based on the size of their invested asset base. As demand for grid capacity increases, investment tends to rise, which in turn expands that asset base over time.
In simple terms, growth in demand feeds through into more predictable earnings rather than volatility.
Of course, risks remain. Higher investment requirements can increase leverage, and rising interest rates can affect financing costs and regulated returns. There is also ongoing regulatory oversight that ultimately determines allowed earnings.
Bottom line
No income portfolio will ever tick every box all the time. Some stocks offer higher growth, others offer more stability, and very few deliver perfect consistency across all five criteria.
That’s why passive income investing is ultimately about balance rather than perfection â combining different types of businesses to create a portfolio that can hold up across different market conditions.
There are also other passive income ideas worth exploring that show how different approaches can work in practice.
The SNOWBALL has a comparator share, where if 100k of seed capital had been invested on the same date as the SNOWBALL, how much income could you take today ?
The comparator share is VWRP and the income comparison is using the 4% rule. More information on the 4% rule if you use the search box above.
The 2026 income for the SNOWBALL will be 12k, which is currently being re-invested to buy more shares that pay a dividend.
The current income for VWRP is £6,920. When the markets fall that figure will most probably fall.
When the markets fall the SNOWBALL will be able to re-invest the earned dividends at a higher yield.
Looking further ahead the income for the SNOWBALL in less than ten years should be 24k and the income from VWRP is the known unknown.
Safety in numbers.
Whilst you still may buy a clunker, inside a collective if one share cuts their dividend it makes very little difference to the paid out dividend.
Brett Owens, Chief Investment Strategist Updated: September 2, 2026
Three investors walk into a bar and start talking retirement. But just two of them volunteer their honest opinions.
The third sits there and haughtily judges them!
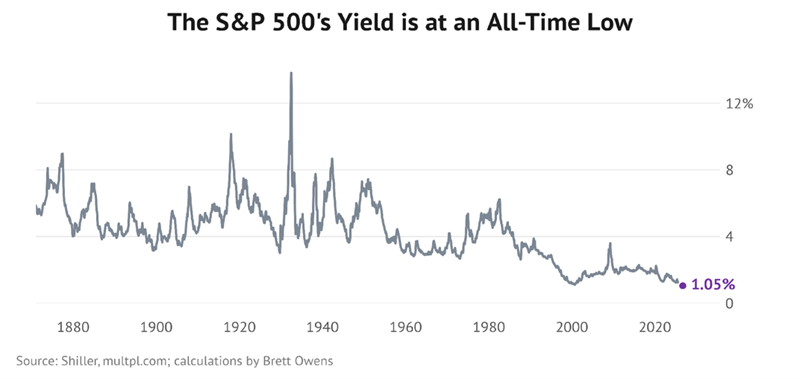
First up, a 75-year-old retiree. He looks at what the S&P 500 (America’s ticker!) offers these days. Today, it’s never paid less. Our veteran investor shrugs and gives up on dividends: “Not much you can do about these paltry yields.”
His counterpart is a 79-year-old who was told as a young man that he would care more about his dividends as he aged. Yup. (Spoiler alert! “They” were right, the man says. More from him later.)
Meanwhile, their judgy counterpart is, of course, a professor! He lacks their experience in the markets but that doesn’t stop him from casting aspersions. They’re both kidding themselves, he taunts. He even has a name for their mistake: the “free dividend fallacy!”
One correction on the story above. It wasn’t a bar—all three turned up in the same Wall Street Journal story. Yet reading it made me feel like I’d been overserved at our hypothetical dividend tavern. Let’s break down why the investors’ stories are relevant to our retirement goals.
First, the 75-year-old shrugging about low yields. Why? I suspect two reasons.
For starters, his quote smells like a roll of Benjamins. The type rich guys peel off and give to their kids. In fact, he mentions in the story that rather than reinvest his dividends, he’s handing the checks to his children instead.
Obviously not a dude who needs every dividend payment. He’s a retired doctor, and I assume his cash pile climbs plenty high.
But lots of dough, believe it or not, can be an income handicap. You receive too much vanilla financial advice. He mentions money market funds and yes, when your nest egg is sizeable enough, 3% payouts will cover the bills. And you can lament it is what it is at the country club without too much actual pain.
For you and me though, the multi-million-dollar option isn’t on the table. And that’s OK because we have available lanes on our income highway that pay 7%, 8% or even better. This yield advantage lets us generate as much passive cash flow on our $1 million as our doctor friend does on $2.5 or $3 million.
With 8% yields, we can collect $80,000 on a $1 million nest egg, without having to sell a single share. That’s 7%, or $70,000, better than America’s ticker, which yields an all-time low 1% today:
And here’s the advantage of this strategy: It makes our day-to-day way more peaceful and a lot less stressful. We don’t have to follow the market. We don’t live by whether the S&P 500 is up or down today. Yes, our account balance bounces around with everyone else’s. Our income doesn’t.
Here’s why. That $80,000 works out to $6,667 per month, hitting our account like clockwork. Now, contrast that with the withdrawal strategy—selling shares every month to raise the same $6,667. Suddenly, it matters a great deal whether the market is up or down!
A down market becomes the worst thing for us, because we must sell more shares of SPY to raise our $6,667. We find ourselves rooting for the market to rally so we sell fewer. But the market doesn’t care what we need! The market does what the market does and this market is a roller coaster. Do you want a bad month putting a dent in your retirement?
Here’s the choice. I ran the numbers on it. You can take $1 million in SPY and withdraw $6,667 every month, selling shares along the way. But if you try this during a down year like 2022, you’ll consume 36% more of your shares than selling in a calm year. And the shares are gone for good!
See, the problem is that when we sell lots of shares low, these shares never come back. Our principal has been reduced—permanently.
Our professor friend says it’s all the same. Well—how is it all the same if we sell more shares when stocks are low?
To be fair, the professor has a point. Dividends are not free money. When a company pays out a dollar, the share price drops by that dollar. He’s right about that.
He’s also right to warn people who chase a yield without verifying the income stream behind it. Market history is filled with companies that paid dividends they couldn’t afford to keep investors from selling, only to hit the wall and lose them with a dividend cut later.
We, as careful contrarians, know this. We do the math on what’s funding our dividends before we buy them. We check that a fund earns more than it pays out. When it does, the payout comes from profits—not from our principal. The fallacy only bites the folks who never check.
Where the professor loses me is at diversification. He warns that dividend investors end up un-diversified. That’s true, if you don’t know what you’re doing. Our income portfolio spreads across six independent buckets, among them Safe Muni Bonds paying 7% to 8% (federal tax-free, so we keep more of it), Energy Toll Collectors—our oil and gas pipelines—and our Dividend Lifeboats, covered-call funds paying 9% to 11%. Plus, a bond-fund lane paying up to 17% (yes, 17%). And two more buckets we’ll save for another day.
These six payout streams don’t rely on the same engine. For example, muni coupons don’t care what option premiums did this month.
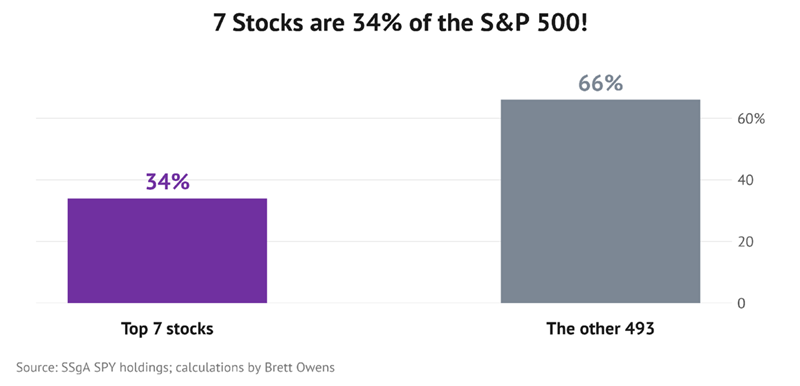
Contrast that with the S&P 500. Did you know that just seven stocks make up one-third of the index? One-third! Should be called the S&P 7:
And here’s the uncomfortable part that newbie dividend investors don’t want to hear: Dividends can disappear. UWM Holdings (UWMC) suspended its dividend and its stock plunged 35%. Papa John’s (PZZA) pulled its payout the very next day.
When we build an income portfolio, we’re not buying, holding and closing our eyes forever. We watch our payers. We make sure the businesses we own keep generating enough cash to fund their payouts. If and when the landscape or the fundamentals change, we move money between positions.
In other words, we never have to sell shares to pay the bills. When we move money between payers, that’s our choice—made on our schedule.
And hey, if we’re doing it wrong according to a judgy WSJ professor, that’s just fine with us.
Which brings me back to our 79-year-old friend at the bar. As a young man he was told he’d care more about his dividends with every year that passed. Now comfortably retired, he says, “Now I can attest to that as fact!” Smart… and our kind of guy! The professor can keep the fallacy. We’ll keep the checks.
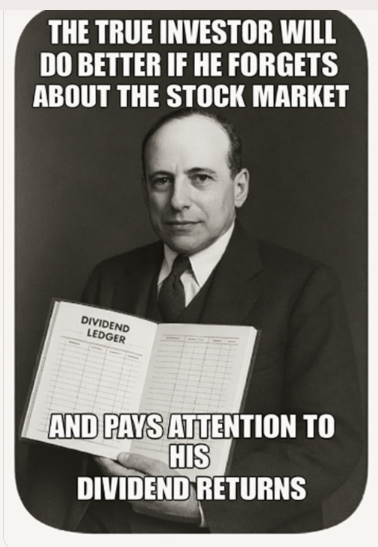
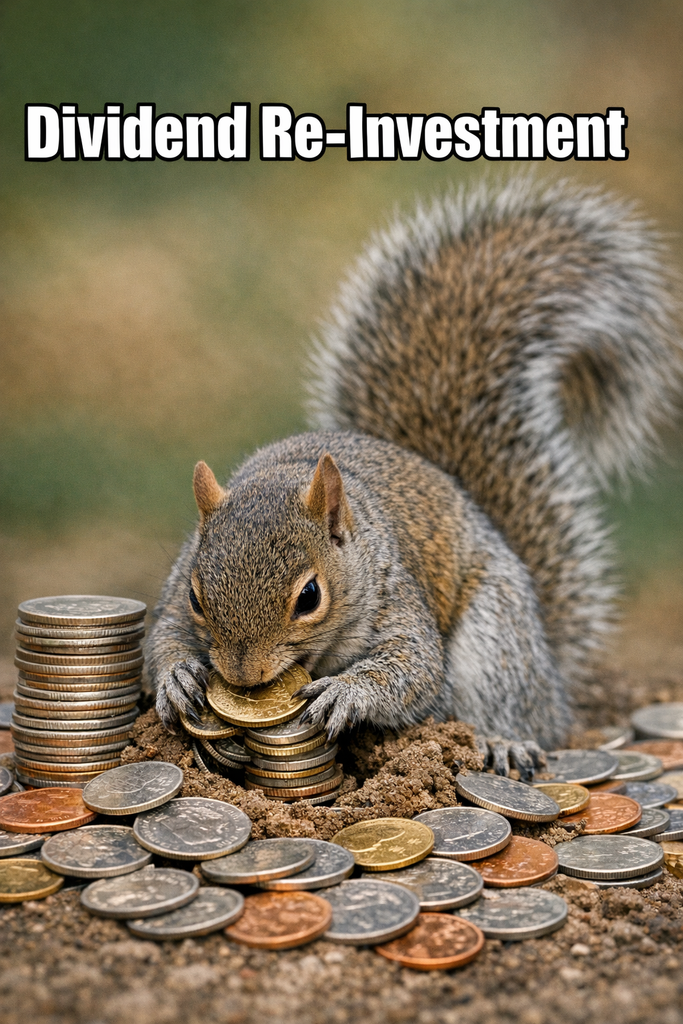
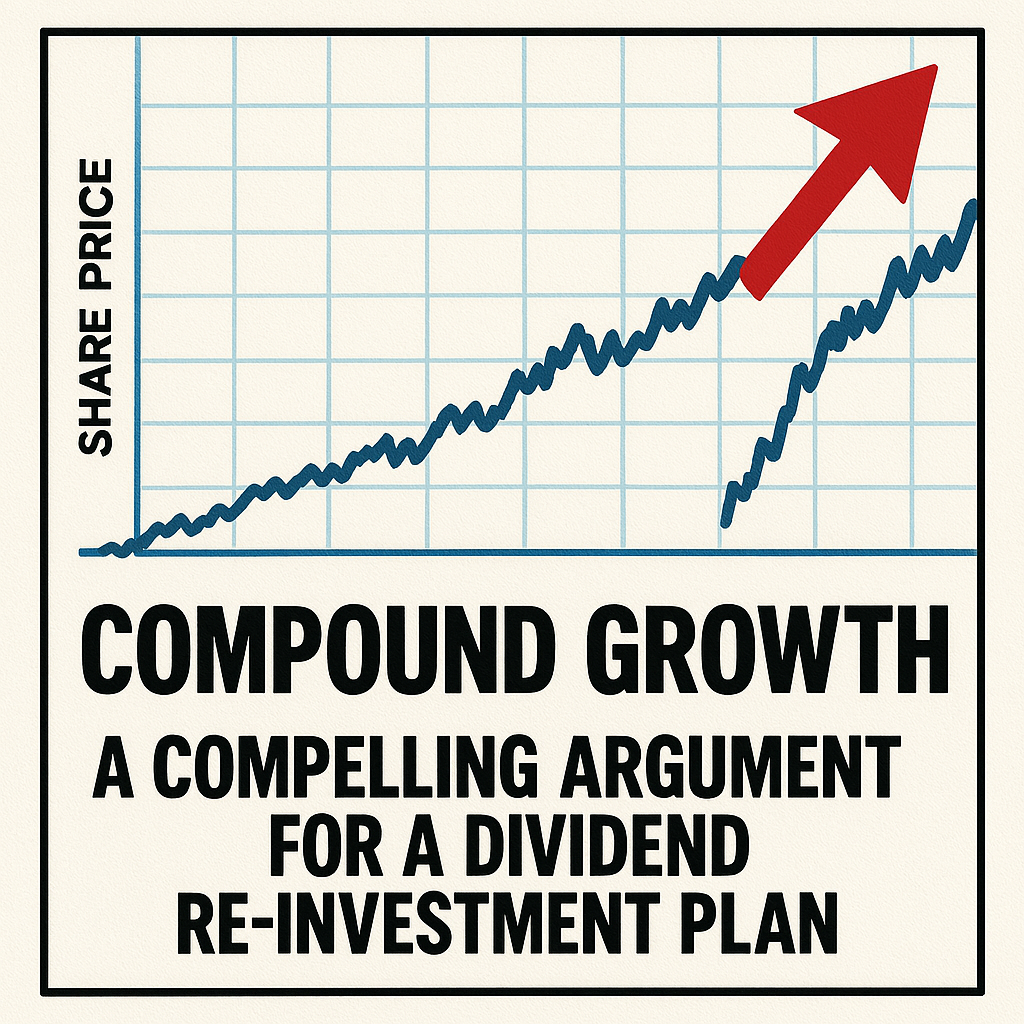
If you have your own Snowball, it will return income in the form of dividends to re-invest when markets are falling. Luckily Bear markets are much shorter than Bull markets, so when markets start to rise, not only will you receive more dividends to re-invest, you should make a capital gain on the shares bought as the market fell.