What I Wish I Knew Before Becoming A Dividend Investor
Jul. 11, 2025
ETO, EPRT, OWL, SLG, NLY, BEP, BEP.PR.A, BEP.PR.G:CA, BEP.PR.M:CA, BEP.PR.R:CA, BEP.UN:CA, BRENF, NLY.PR.F, NLY.PR.G, NLY.PR.I, SLG.PR.I31
Summary
- I have done very well over the long run.
- But I had to learn some lessons the hard way.
- Learning from my mistakes could save you thousands.
- High Yield Investor members get exclusive access to our real-world portfolio.

Written by Jussi Askola
I have now been an active dividend investor for well over a decade.
Overall, I have done quite well over time, and our portfolio at High Yield Investor has massively outperformed the broader market.
But I have made many mistakes along the way, some of which have cost me thousands.
In today’s article, I will give you the chance to learn from my mistakes so that you don’t need to suffer the same losses.
I have ranked the mistakes from the least to the most important, so make sure to read till the end:
Mistake #1: Favoring Monthly Dividend Payers
Early on, I would favor monthly dividend-paying stocks over quarterly dividend-payers, thinking that the monthly dividend would help me achieve higher returns by accelerating the compounding.
I also liked the idea of getting paid monthly, even if I didn’t need the money, and was reinvesting all the payments.
But this is a mistake.
In reality, the dividend frequency is just a capital allocation decision, and it should be just an afterthought in your investment decision-making.
There are other far more important factors to consider (fundamentals, valuation, etc.), and if you are going to chase monthly payers, you will miss out on lots of potentially better opportunities that pay quarterly.
As an example, I know many REIT investors who have bought Realty Income (O) instead of Essential Properties Realty Trust (EPRT) just because of its monthly dividend. Both REITs are similar in that they focus on net lease properties, but EPRT has been far more rewarding ever since it went public:

It offered a much higher yield when we first invested in it and has managed to grow its dividend at a far faster pace over time.
This illustrates that buying a stock based on its dividend frequency is often a mistake. The difference in compounding is minimal, and there are good reasons why most companies choose to pay quarterly rather than monthly. It gives the company more flexibility with its cash flow, and it also reduces administrative costs, which you ultimately pay for as the shareholder.
So, don’t select your stocks based on their dividend payout frequency. This should really just be an afterthought.
Mistake #2: Avoiding Foreign Stocks Due to Withholding Taxes
Early on, I was also reluctant to invest abroad, fearing that the withholding taxes on dividends would put me at a disadvantage and reduce my returns.
This led me to miss out on many great opportunities that would have earned me far higher returns, even despite the additional tax.
I was being penny-wise, pound-foolish by trying to avoid paying those taxes.
Today, a big portion of my portfolio is invested abroad, and I gladly pay those taxes to better diversify my portfolio and increase my investment universe.
In most cases, there is no impact from withholding taxes anyway. I typically get a tax credit in my home country to avoid double taxation altogether.
Mistake #3: Focusing Too Much on Payout Ratio
Another mistake that has cost me dearly is thinking that a dividend was safe simply because the payout ratio was low.
This cost me a lot of money early in my investing journey.
I still remember buying the stocks of popular high-yielding companies, thinking that they could easily sustain their well-covered dividends.
But in reality, the payout ratio often doesn’t tell you much about dividend sustainability.
Even the dividend of a company with a low 50% payout ratio can be very risky if the company is heavily leveraged and its cash flow is declining.
In fact, I would argue that the direction of the cash flow and the leverage levels are far more important in assessing the sustainability of a dividend.
Even with a high payout ratio of 90%, a dividend may be safer if the balance sheet is safe and the cash flow is growing. As an example, Blue Owl Capital (OWL) has a very high near 100% payout ratio, and yet, I think that its dividend is sustainable and set for rapid growth because of how well its business is performing. In contrast, I think that the dividend of SL Green (SLG), a popular office REIT with a low 60% payout ratio, is at high risk of being cut in the coming years.
So, don’t put so much weight on the payout ratio alone. It really doesn’t tell you that.
Mistake #4: Forgetting About Management Quality
Management quality really should be your #1 concern when investing.
A company may have the best assets and the strongest balance sheet, but none of that truly matters if the management is misaligned with shareholders and more interested in lining their own pockets than creating shareholder value.
Too often, I have forgotten this rule and invested in a company, just to get burned later because I overlooked the importance of management quality.
Therefore, I think that the first step should always be to assess the management. These days, we are lucky to have the scale and reputation, thanks to our newsletter, High Yield Investor, to gain exclusive access to management teams to conduct interviews.
But you don’t need that. To assess the management quality and alignment, I would recommend studying its track record, its past capital allocation decisions, its compensation, its insider ownership, and past insider transactions.
This matters much more than many understand.
Mistake #5: Chasing High Yield
Finally, this is arguably the biggest mistake of all, and we see it all the time here on Seeking Alpha.
Investors will get greedy and chase very high-yielding stocks, with dividend yields often exceeding 10%, not realizing that such high-yielding stocks are commonly some of the worst-performing stocks in the entire market.
The market may not be perfectly efficient, but it is not completely stupid either. If it is pricing a stock at a 10%+ dividend yield, there is typically a good reason for it. Either its management is misaligned, it is overleveraged, or its cash flow is set to decline.
Take the example of mortgage REITs. They consistently attract a lot of yield-starved investors, as many of them offer very high dividend yields. As an example, Annaly Capital Management (NLY) is currently offering a 14.4% dividend yield!
But what sounds too good to be true, typically is. Over the long run, such mREITs have typically been very poor performers, earning only a 2% average annual return:
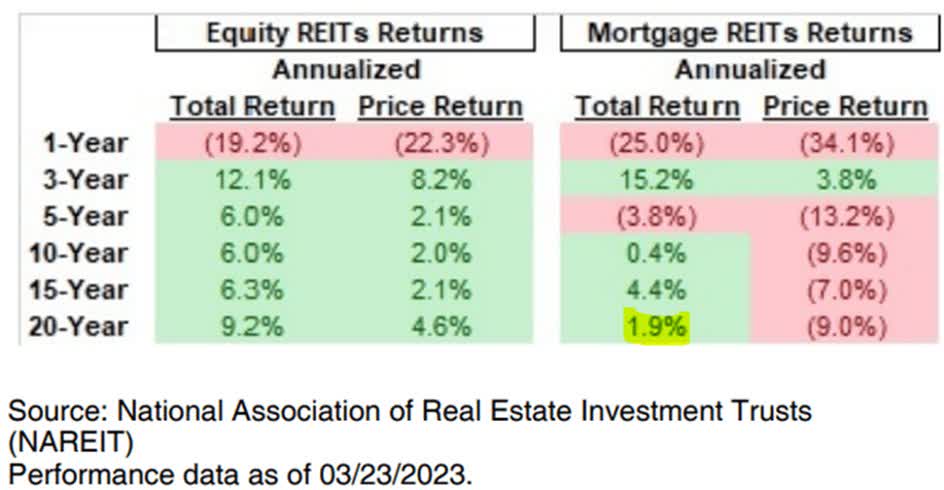
This means that the high dividends were matched with steadily declining share prices. There is no point in that, as you are not truly getting ahead. Any company can manufacture a high yield to attract investors, but if that ultimately destroys value, you are just lying to yourself by investing in those companies.
We are high-yield-seeking investors. After all, the name of our service is even “High Yield Investor”. But that does not mean that we will blindly buy 10%+ yielding companies. In fact, we very rarely do.
We look for an optimal mix of yield, growth, safety, and upside, and most often, we find that in the 6-8% yield range these days.
These are high-quality companies that can pay sustainable and growing dividends, but they are often undervalued because they are facing temporary challenges that are impacting their market sentiment. As an example, Brookfield Renewable Partners (BEP) dropped significantly following President Trump’s victory due to the perception that his administration would be less favorable to renewable energy sectors.
But in reality, we think that the headwind is minor and only temporary. The company has guided to grow its cash flow per share by 10% annually, even despite Trump’s victory, and yet, we got to buy a lot of shares with a yield in the 6-7% range. That’s very attractive coming from a BBB+ rated blue-chip company. Over the past few months, the stock has surged nearly 30% as the market recognized its mistake.
Hard to beat that in terms of its ratio of yield, growth, safety, and upside. That’s exactly what high-yield investors should target instead of focusing on the 10%+ yielding stocks, which, more often than not, are priced at such high yields for a good reason.
Editor’s Note: This article discusses one or more securities that do not trade on a major U.S. exchange. Please be aware of the risks associated with these stocks.