Investment Trust Dividends

Category: Uncategorized (Page 189 of 366)

NESF Part two

Considering the temptation of NESF

A tidy 12% yield from Next Energy Solar – is this an OB2025 idea?

The Oak Bloke


Show me the money the OB says. Read on to find out what I found.

The forward yield is a very impressive 12%. (based on a 8.43p per share dividend). A 14.4% return when you consider the 2.4% buy backs.

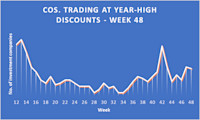
Other points of note are its sales of assets as a 14%-21.5% premium to NAV (a further programme begins in 2025). Consider that vs NESF’s 28.2% discount to NAV. If 14% is indicative of the portfolio then the true discount to NAV is actually 37%.

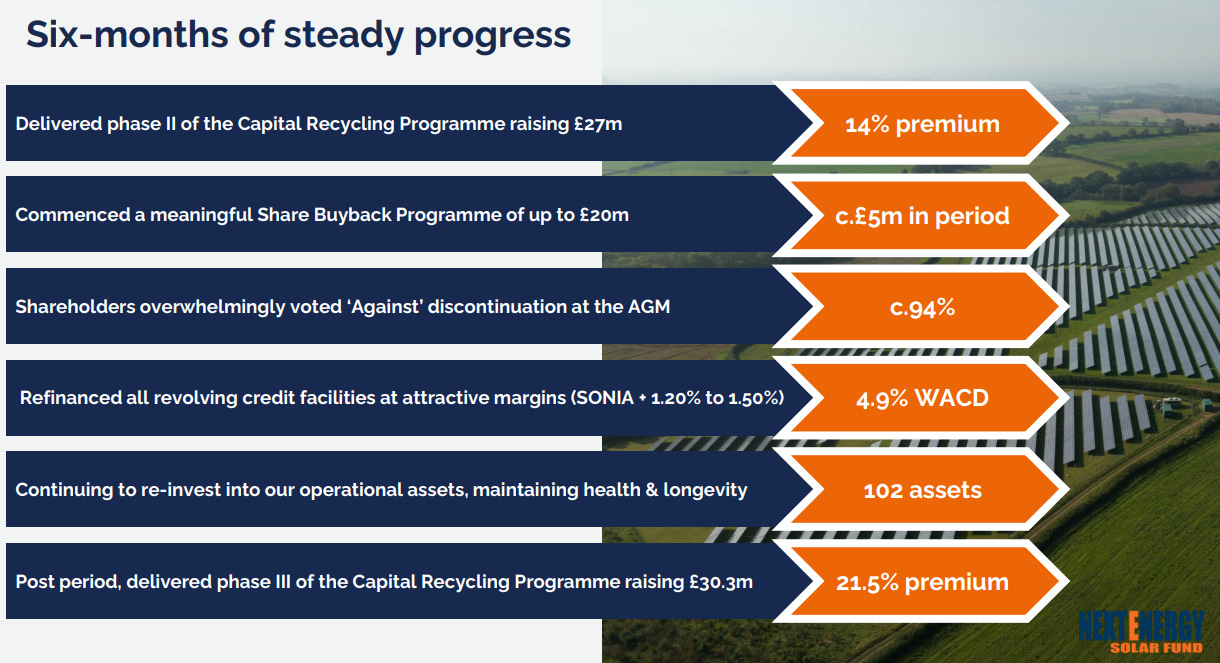
This is the operating portfolio:

Consider that electricity demand will increase by 56% over the next 10 years.

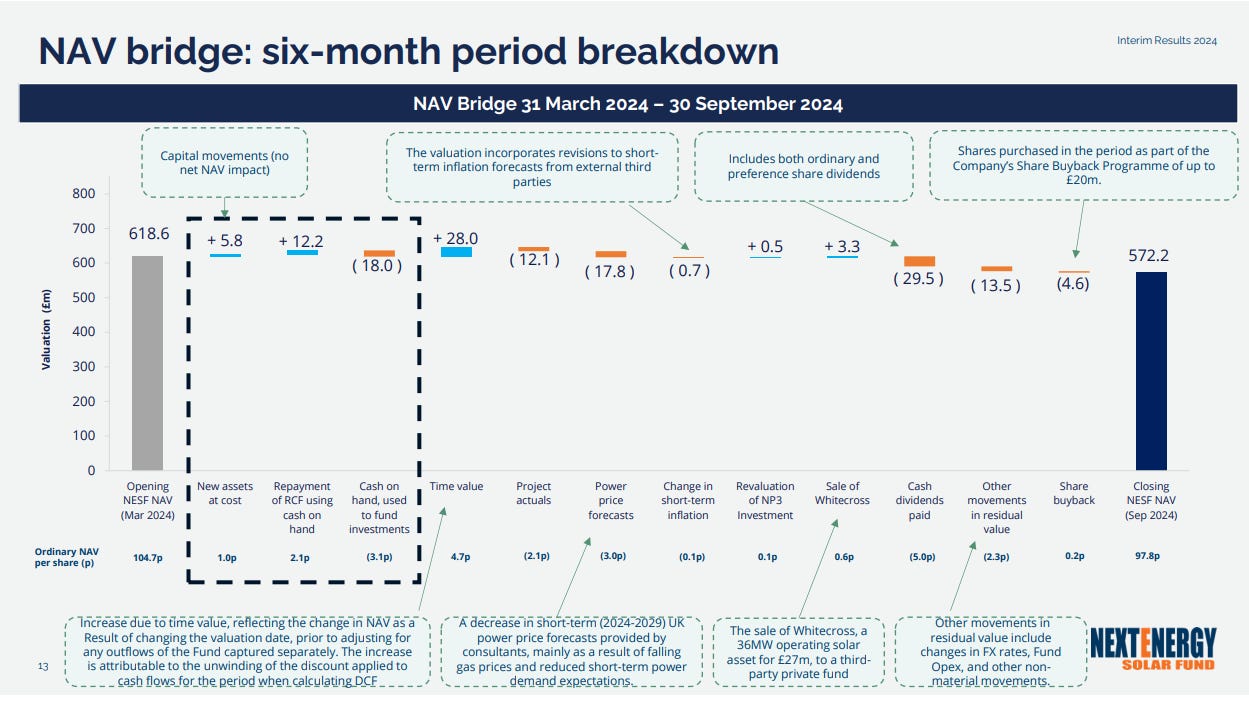
Yet we see the “experts” proclaim that the NAV should be reduced by -£17.8m due to gas prices and short-term power demand expectations.

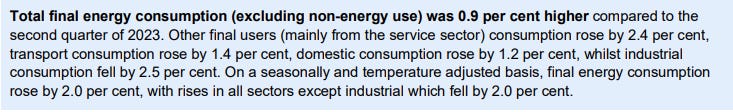
2024 consumption was higher than than 2023. Perhaps the “experts” are a little confused over what NESF sell? Solar Panels do not produce Natural Gas but power experts do appear to emit hot air.

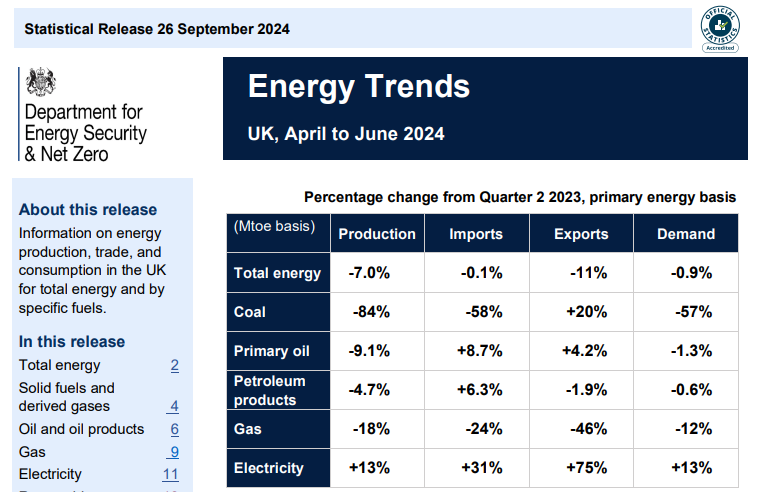
Meanwhile the Dept for Energy Security & Net Zero tell us that consumption of Electricity is up and other forms of energy are down.

Energy storage assets are a growth area for NESF. These enable NESF to capitalise on existing infrastructure including existing grid connections and inverters, meaning OPEX is optimised, but also that solar generation can be sold at optimal times (i.e. early evening). The idea being that the 92 UK sites could be retrofitted over time with energy storage. Currently 1 50MW site live, a second pre-Construction of 250MW, a smaller 6MW co-located storage 1 has planning, and 4 applications are in progress.

Interestingly, the power price forecasts include a “solar capture” discount, which reflects the discount on pricing in daylight hours versus during baseload hours. With the introduction of storage such a discount would disappear – so create a positive reversion for the NAV that not only do you add the asset to the NAV but you also remove the solar capture discount too.

Forecast Prices & Discount Rates

NESF reveals substantial drops due to discount rates increasing to 8% and short term power prices falling also.

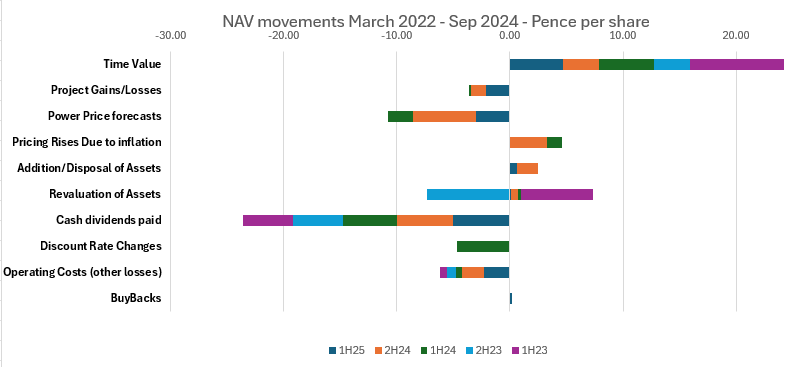
When you strip out that “noise” and focus on the real movements roughly inflation protections offsets power price forecast changes, income nearly covers dividends (and in the 25% higher irradiance in 2022 would have fully covered the dividend), while asset capital gains offset project losses and other losses.

Looking forward it appears that Power Price forecasts will eventually return to a positive, as will the discount rate. It wasn’t clear to me that the forecasts are considering the subsidies, the ROCs and the hedges that NESF employ. Much of current year is hedged and several years ahead also.

Considering the valuation beyond the “Power Price”

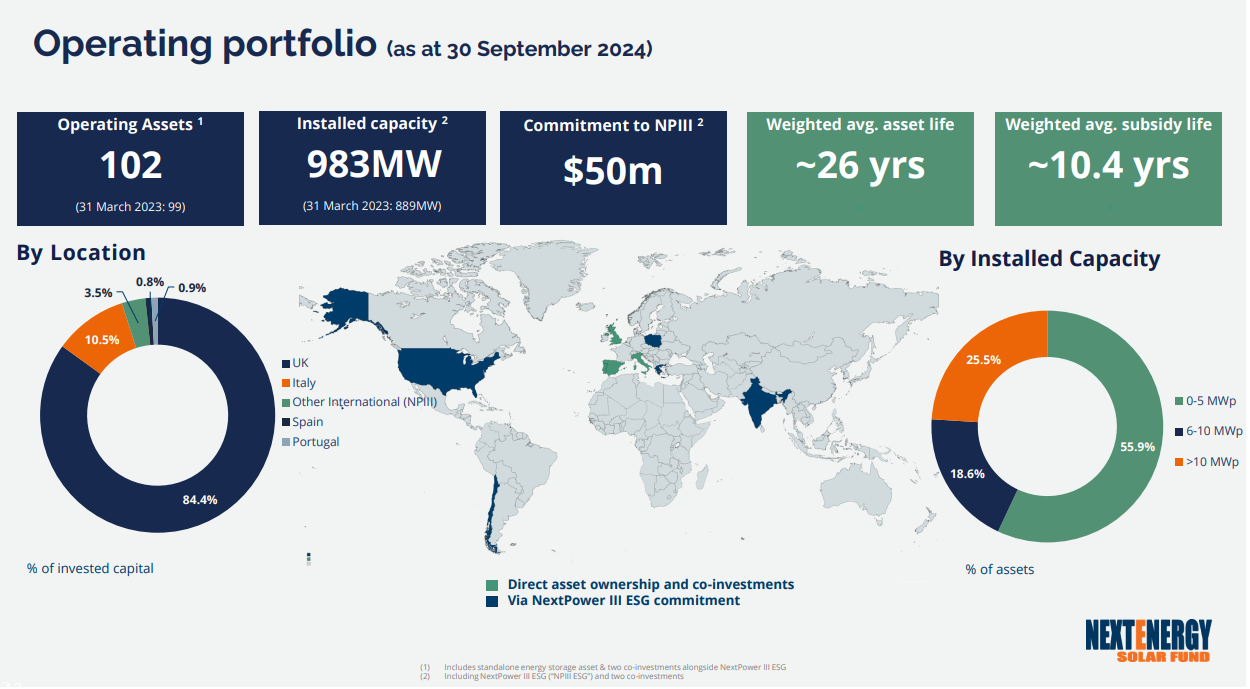
A further proof point is that the fund is selling assets at a premium is a strong proof point. But I considered simply following the money.

Now with the HoldCo and the obfuscation that goes on that’s easier said than done. But I persevered and think I managed to find some good insight.

It was at this point I decided tempting NESF was not going to be an Oak Bloke 2025 idea after all.

Why?

What was the “but” for the Oak Bloke?

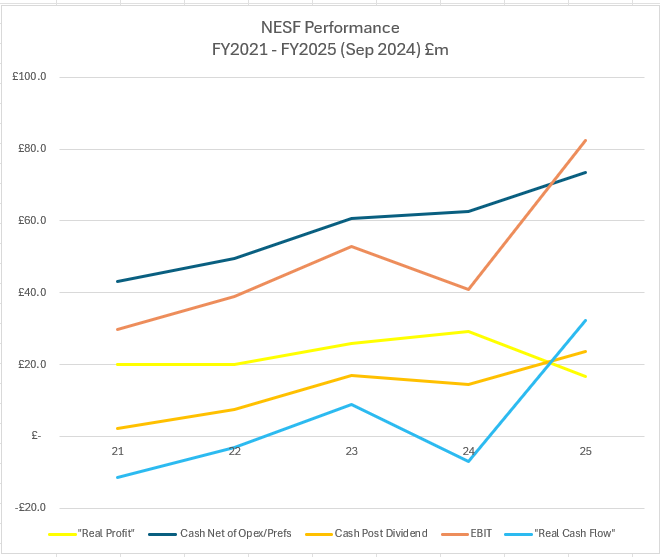
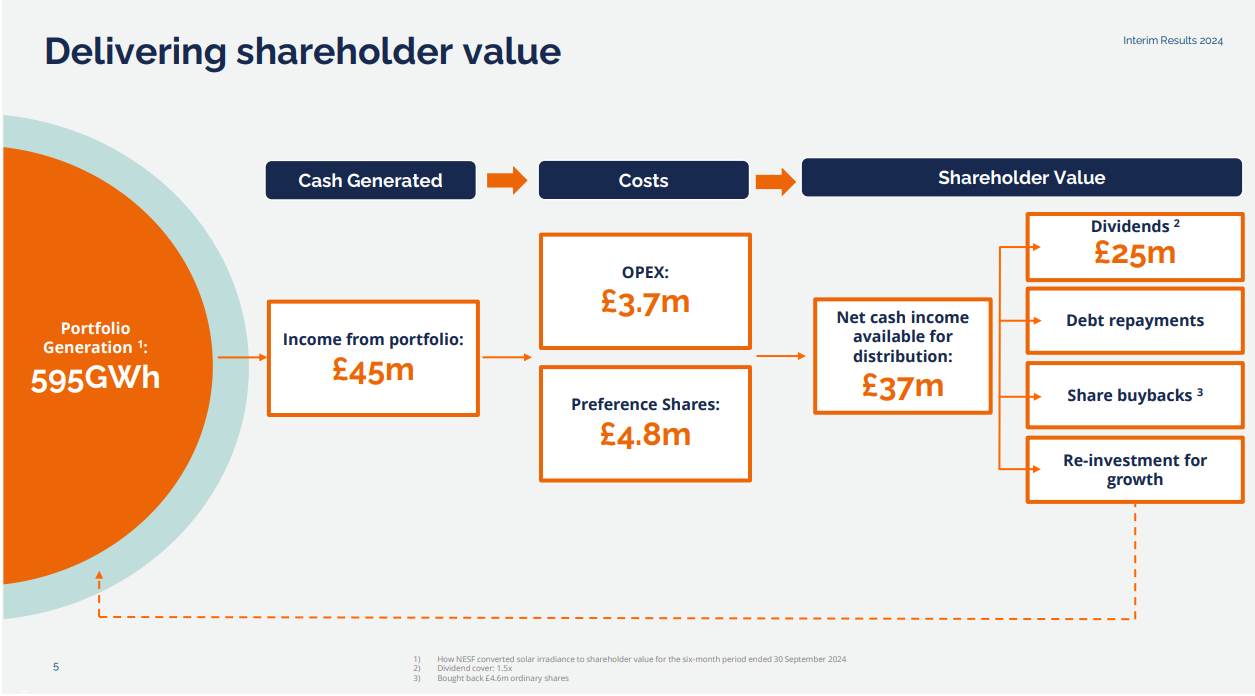
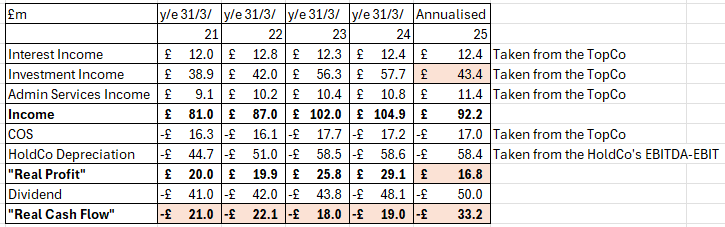
In the yellow line I took the income (I’ve doubled the numbers for 2025 because we only have the interim result) and then I deducted the overheads but also calculated the depreciation by taking the difference of the HoldCo EBITDA and EBIT.

All looks really positive doesn’t it? But what if we consider depreciation AND dividends.

Ouch.

If NESF didn’t operate the obfuscating HoldCo structure this is what I believe the real picture would look like.

The “real profit” where we hope income exceeds the replacement cost of capital. And it does. However this real profit needs to pay dividends and it doesn’t fully cover that.

Also of concern “Investment Income” is down in FY25. There is a degree of further obfuscation by NESF as to the reasons why.

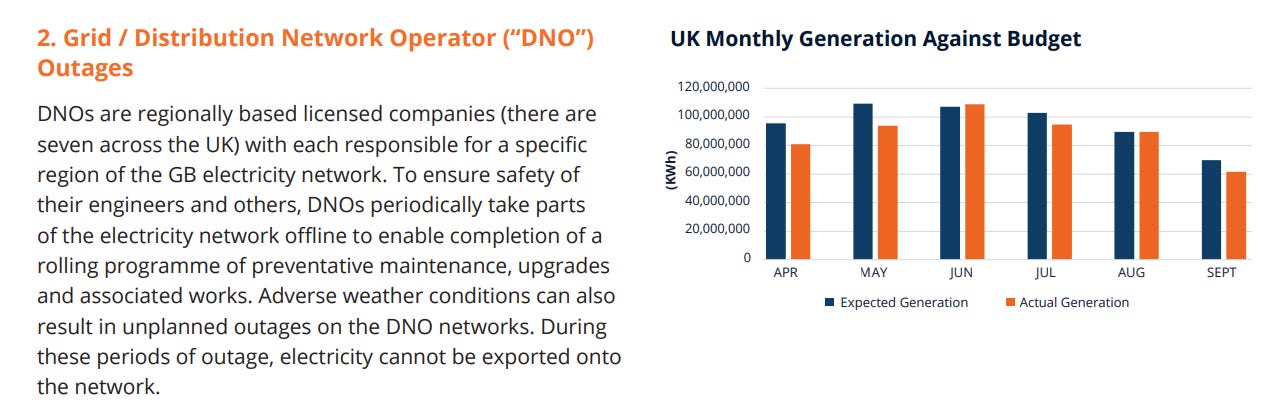
Part of the reason for this fall is the extent of the actual vs budget output.

If you look at the “expected” values in the chart below the differences add to nearly 40GWh or 7% of the budget. The report speaks to a 4.5% below budget (excluding i.e. plus factors outside NESF’s control). So 2.5% was beyond control perhaps.

Certain metrics like cash flow appear pleasing – that the assets can generate a cash return able to cover the dividend. Moreover I also observe a comment about the 25 year life of assets and the fact that there’s no reason why the assets cannot be used beyond 25 years – subject to lease agreement and also to replace defective parts. NESF do speak to doing this – and nowhere is that in the price. Given the assets are around 10 years old extending 25 year old assets to a 30 year life would drop depreciation by a third – or £15m per annum. The sale of assets at a premium could be explained by the depreciation policy simply being too aggressive.

But the problem is I just don’t know if that’s the case, or at what cost.

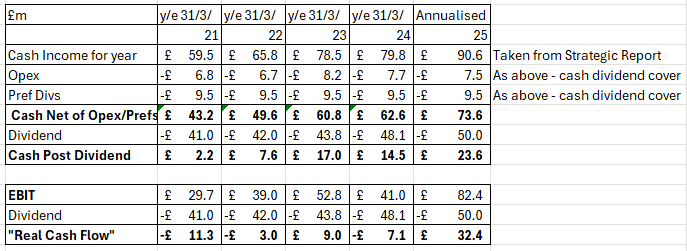
Taking the FY25 real cash flow as earnings values NESF at 12X at today’s share price.

But the EBIT of £82.4m doesn’t reconcile with the reported earnings. If I instead use the “real profit” earnings FY22-FY25 of £23m the calculation is nearly 18X the share price.

Conclusion

Whilst NESF offers a great dividend and is selling its assets at a premium I am concerned when I value this on a simple cash generation minus depreciation minus dividends basis.

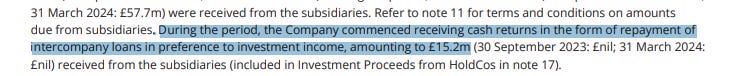
I find the numbers are not sustainable. To determine the income I’ve used the £15.2m cash returns plus £6.5m dividiends from HoldCo to TopCo.

Buried in Note 26

I’ve reviewed a lot of comments in the chattersphere. No one seems to have noticed the drop in income!

Income 85% down! Add in that £15.2m is a loan repayment… but that means income has halved year to year.

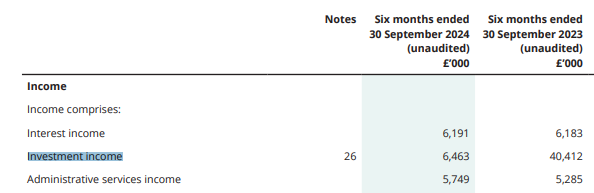
What I saw as boring and safe with upside I now see as fairly valued at the current price. The nearly 50% drop in “investment income” worries me. Arguably dropped over what is potentially the better 6 months of the year too (the summer months).

The fact that NESF don’t address this anywhere worries me. The moving of some returns to repayment of intercompany loans could be a way to hide the evidence?

The 7% fall in availability will explain part of the reason it’s sure. The lower 6.9% yield is connected and will explain part of it too. But why not just be open about that?

Perhaps the other reason for the fall in income is that power prices are falling and the UK is about to enjoy years and years of cheaper electricity after all. Labour did promise cheaper bills didn’t they? Right now we are in the midst of a colder winter for Europe in 2024 and my power prices just increased. With our new government knifing Oil & Gas in a populist tax grab of a globally leading 78% margin rate I’d be surprised if it’s the reason. Plus what about all the subsidies and PPA pricing?

But again we simply don’t know.

I conclude to say I would question the sustainability of the dividend. It is “covered” only if you ignore depreciation. In other words NESF is eating its seed corn by paying current dividends.

After coming close to including it, NESF is not one for the OB 2025 ideas, despite the alluring attractions. (the OB idea SEIT does stand up to this same scrutiny by the way)

Will this be the final episode for NESF? 8pm on Christmas day is when all’s said and done (including the incident on the boat maybe?).

Regards,

The Oak Bloke

Disclaimers:

This is not advice

This weeks xd dates

Thursday 12 December

Assura PLC ex-dividend date
Chelverton UK Dividend Trust PLC ex-dividend date
CT Global Managed Portfolio Trust PLC ex-dividend date
Henderson High Income Trust PLC ex-dividend date
JPMorgan Global Emerging Markets Income Trust PLC ex-dividend date
Keystone Positive Change Investment Trust PLC ex-dividend date
Patria Private Equity Trust PLC ex-dividend date
Personal Assets Trust PLC ex-dividend date
Polar Capital Holdings PLC ex-dividend date
SDCL Energy Efficiency Income Trust PLC ex-dividend date
Sirius Real Estate Ltd ex-dividend date
TR Property Investment Trust PLC ex-dividend date

FGEN

FORESIGHT ENVIRONMENTAL INFRASTRUCTURE LIMITED

(“FGEN” or the “Company”)

Disposal of rooftop solar portfolio

FGEN, a leading listed investment company with a diversified portfolio of environmental infrastructure assets across the UK and mainland Europe, is pleased to announce that it has completed the sale of 100% of its portfolio of operational rooftop solar assets (the “Rooftop Portfolio“) to AtmosClear Investments for a total consideration of £21.2 million (the “Disposal“). A total of £20.5 million is payable upon completion (“Initial Proceeds“), with a further £0.7 million in deferred consideration linked to the satisfaction of certain post-completion obligations (“Deferred Consideration“). The Initial Proceeds represent a modest premium to the valuation as at 30 September 2024 with the potential for further upside from the Deferred Consideration. 

The Rooftop Portfolio comprises a portfolio of over 1,000 fully operational domestic rooftop, commercial rooftop and ground-mounted solar installations distributed across England, Scotland and Wales, and was acquired by FGEN in 2015. It is FGEN’s only solar rooftop investment and considered to be non-core to the wider FGEN portfolio.

The Disposal refines the portfolio, recognises a premium to NAV, and recycles capital from a lower returning part of the portfolio into a further reduction of debt in line with the Company’s Capital Allocation policy.

The disposal crystallises an IRR of 4.2% and a multiple on invested capital (MOIC) of 1.3x. It is the Company’s second divestment this year after the sale of interests in a portfolio of anaerobic digestion assets in August 2024 (10.9% IRR, 1.7x MOIC).

Following the Disposal, FGEN’s solar exposure will consist of 11 ground-mounted solar parks across 5 investments in England and Wales which make up approximately 13% of the FGEN portfolio by value.

Ed Warner, Chair of FGEN, said:

“We are pleased with this sales agreement which has provided us with substantial funds from a non-core, low yielding asset. Capital allocation remains a key priority for the Board and proceeds will be used to strengthen our balance sheet through a further reduction in debt.”

To Annuity or not to Annuity

If u buy a joint life annuity with 100k, u could currently receive around 7k p.a., less if you want the pension to rise by 3%. You have to surrender your 100k to the annuity provider.

If you used your cash to buy a gilt u would receive an income £4,700 a year, best if held within a tax wrapper, you could take out your 25% tax free amount if held within a SIPP to supplement your income and retain control of the remaining 75%.

SEIT

Remember, it’s always easier using the rear view mirror.

If you bought SEIT, it could be prudent to take some profit off the table.

If the price continues to rise, you will make more profit and if the share falls back, you may be able to buyback the shares you sold at a lower price.

SEIT still yields 10.7% and trades at a discount of 37%, so still a hold for the portfolio.

NESF, yield 11.8% trading at a discount of 28% but still waiting for the share to form a bottom.

Comments

You can please some of the people, all of the time, some of the people some of the time and none of the people all of the time.

It takes two opposing views to form a market, so that’s just as it should be. Note: I cannot with the best will in the world approve any comments I cannot read. GL

Today’s quest

tax deductions business
imageprointernational.com/blogs/imaginews/maximiz…
Chilcoat63350@gmail.com
93.157.28.55

Good post. I be taught something more difficult on completely different blogs everyday. It is going to always be stimulating to learn content material from different writers and observe a little bit something from their store. I’d want to make use of some with the content on my weblog whether you don’t mind. Natually I’ll give you a link on your net blog. Thanks for sharing.

£££££££££££

Yep, no problem.

Doceo Weekly Gainers

Weekly Gainers

JPMorgan Emerging Europe, Middle East & Africa (JEMA) tops Winterflood’s highest monthly movers, despite its gains shrinking to a lowly +46.1%. Notable risers include Baillie Gifford US Growth (USA) at +26.2%, while Seraphim Space (SSIT) rounds out the top five with +23.4%. The US election’s impact on growth and small-cap stocks remains a dominant theme.

By Frank Buhagiar•02 Dec

The Top Five

A case of as you were with the top-three funds on Winterflood’s list of highest monthly movers in the investment company space. JPMorgan Emerging Europe, Middle East & Africa’s (JEMA) still top despite seeing yet another big drop in its monthly share price gain, this time to ‘just’ +46.1%. That’s down on last week’s +69.7% which itself was a big climbdown from the +123.7% monthly share price gain seen in the days following Donald Trump’s US election win – the thinking is Trump’s victory may increase JEMA’s chances of recovering value from its legacy Russian holdings. Or does it? For having reached a high of 244p on 15 November, the share price has since dropped back to 164p-ish. Still way above the 105p level seen in October but a few more reverses like the above and it won’t be long before the shares are back to square one.

NB Distressed Debt Investment Fund (NBDX) stays in second spot thanks to a monthly share price gain of +32.1%, exactly what it was seven days earlier. Shares have been in demand ever since the company announced a US$5.5m capital distribution on 8 November. Might not seem much, but it is when you consider total assets stand at less than US$40m. It’s all relative.

Baillie Gifford US Growth (USA) saw its monthly gain increase to +26.2% from +19.9% previously. The shares are now up to 270p. That compares to 220p on the day of the US election – Trump’s victory seen as good for all those growth stocks USA holds and in particular for those run by prominent Trump backer and recently appointed Efficiency Tsar Elon Musk – the fund holds both Space X and Tesla although not as much as it used to. As at end of July, USA had 3.8% of its assets invested in Space X and 3.2% in Tesla. Fast forward to 30 September and the Space X position is down to 2.2% of total assets and Tesla to 3.3%.

JPMorgan US Smaller Cos (JUSC) returns to the list after a two-week absence. Share price is up +23.9% and, like USA above, all of the gains can be traced back to the date of the US election. JUSC’s small-cap focus clearly paying dividends as smaller companies arguably stand to benefit more than most from Trump’s promises of tax cuts, lower regulations and tariffs on overseas companies. This can be seen in the performance of the Russell 2000 over the past month. The US small-cap index is up +9.88% on the month, easily Trumping the S&P 500’s +3.2% and the Nasdaq’s +2.8%.

Seraphim Space (SSIT) completes the top five thanks to a +23.4% share price gain. That’s despite the release of a quarterly update showing a -2.3% NAV per share decline to 93.7p during Q3, primarily due to foreign exchange movements which had a -3.8p impact. Q3, of course, fell before the US election and a post-Trump victory bounce in the dollar. According to broker Liberum “Taking account of post-period USD strengthening, the impact on portfolio valuation from using the GBP/USD rate on 22 November would have been +4.13p.” Expect a stronger Q4 NAV figure then, assuming everything else stays the same.

Scottish Mortgage

Scottish Mortgage’s (SMT) share price finished the week ended Friday 29 November 2024 up +8.9% on the month, meaning it held on to almost all the +9.0% gain seen seven days earlier. NAV moved in the opposite direction, up +6.5% compared to +5.8% previously. The wider global sector meanwhile saw its monthly gain fall a tad to +3.9% from +4.4%. All three still outperformed the Nasdaq which is up +3.4% over the month.

Doceo Discounts

Discount Watch

Seventeen investment companies traded at 52-week high discounts to net asset values last week, highlighting the continued impact of elevated bond yields on alternative funds and a noticeable rise in UK-focused funds making the list. With UK interest rates potentially staying higher for longer, the dynamics for equity income and small-cap funds could face new challenges.

By Frank Buhagiar

We estimate there to be 17 investment companies which saw their share prices trade at 52-week high discounts to net assets over the course of the week ended Friday 29 November 2024 – one less than the previous week’s 18.

For the third week in a row, eight alternative funds make it onto the latest Discount Watch – five renewables, two debt funds and one property investor. As previously noted, higher bond yields likely playing their part here – government spending and borrowing concerns have seen 10-year gilt yields spike up to as high as 4.5% from the 3.75% seen in September. Higher yields can lead to higher discount rates. Higher discount rates are used to value alternative assets and these can lead to lower fund valuations. As long as yields stay at these levels, expect alternative funds to continue to feature prominently on the Discount Watch.

But could there be another theme emerging? For there’s been a jump in the number of UK-focused funds on the Discount Watch to five from one previously – Aurora (ARR) from UK All CompaniesJPMorgan Claverhouse (JCH) and Murray Income (MUT) from UK Equity Income and BlackRock Throgmorton THRG and Marwyn Value Investors (MVI) from UK Smaller Companies. ARR’s appearance can be explained by the issue of new shares as part of its acquisition of Artemis Alpha.

As for the other four, two are UK equity income funds and two come from the UK small-cap sector. Could this be down to the growing narrative that UK interest rates might not be coming down as quickly as hoped? Higher interest rates make it hard for funds to compete with risk-free rates on a yield basis – a headwind for UK equity income funds perhaps. And UK rates coming down more slowly than expected could be holding back the two small-caps funds too – smaller companies typically benefit more from lower interest rates. Be interesting to see if more UK funds make it onto the list, particularly if the Bank of England decides against a rate cut at its last meeting of the year on 19 December.

The top five

FundDiscountSector
HydrogenOne Capital Growth HGEN-76.44%Renewables
Ceiba Investments CBA-74.43%Property
Marwyn Value Investors MVI-54.87%UK Smaller Cos
Gore Street Energy Storage GSF-53.24%Renewables
VPC Specialty Lending Investments VSL-50.01%Debt

The full list

FundDiscountSector
Invesco Bond Income Plus BIPS-2.93%Debt
VPC Specialty Lending Investments VSL-50.01%Debt
Impax Environmental Markets IEM-17.21%Environmental
JPMorgan European Discovery JEDT-12.53%Europe
Lindsell Train LTI-27.13%Global
Worldwide HealthCare Trust WWH-15.81%Healthcare
Ceiba Investments CBA-74.43%Property
Aquila Energy Efficiency AEET-45.05%Renewables
Foresight Environmental Infrastructure FGEN-33.90%Renewables
HydrogenOne Capital Growth HGEN-76.44%Renewables
Gore Street Energy Storage GSF-53.24%Renewables
SDCL Energy Efficiency SEIT-45.65%Renewables
Aurora ARR-13.25%UK All Cos
JPM Claverhouse JCH-7.18%UK Equity Inc
Murray Income MUT-12.97%UK Equity Inc
BlackRock Throgmorton THRG-13.75%UK Smaller Cos
Marwyn Value Investors MVI-54.87%UK Smaller Cos

« Older posts Newer posts »

© 2026 Passive Income Live

Theme by Anders NorenUp ↑