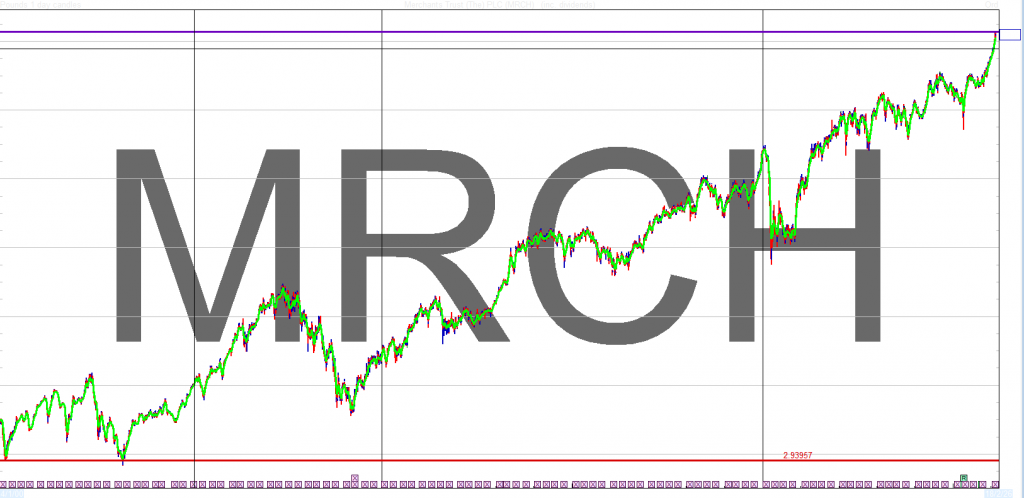
A twenty-year perspective It is always valuable to place any single year’s performance in a longer-term context. Our investment manager at Allianz Global Investors, Simon Gergel, this year celebrates his twentieth as the lead manager of The Merchants Trust. A shareholder who invested at the beginning of his tenure in January 2006 would have seen significant share price appreciation and consistently growing dividends, which when combined, exceeded the value of their initial investment. In other words, Merchants shareholders today who have held their initial shares for twenty years effectively now have this shareholding for free !
Including dividends £3 > £12. Interesting to note how despite all the market blips, the share price recovers. You need to allow for inflation in the returns.
Revenue earnings per share for the year were 30.6p, compared to 29.4p in the previous year. The Board is proposing a final dividend of 7.5p per share, payable on 27 May 2026 to shareholders on the register on 17 April 2026. The ex-dividend date is 16 April 2026 and the last date for election for the Dividend Reinvestment Plan (DRIP) will be 5 May 2026. This final dividend, together with the interim dividends already paid, will bring the total dividend for the year to 29.5p per share. This represents an increase of 1.4% on the previous year and marks the 44th consecutive year of dividend growth for Merchants, which therefore also retains its place in the AIC’s prestigious list of ‘Dividend Heroes’ – those investment trusts which have consistently delivered a rising dividend stream to shareholders for over twenty years. The total dividend for the year is fully covered by revenue earnings, allowing reserves to be further rebuilt. At the end of the financial year, revenue reserves stood at 20.3p per ordinary share.
If the worse case scenario plays out for the oil price, those reserves may be needed. This is a very scary market and most probably the best action is to just watch and wait.
The ongoing Iran-Israel-US war, Strait of Hormuz closure, and global economic risks. James Kostohryz explains why disruptions could persist for months.
Equities face material downside: 30% S&P 500 decline possible if the conflict lasts 6–8 more weeks.
Energy, especially non-North American E&P stocks and oil ETFs like BNO, could offer significant upside if oil remains elevated.
Defensive positioning is warranted: raise cash, avoid long-duration bonds and industrial commodities. Monitor real yields and TIPS for tactical entry.
J Studios/DigitalVision via Getty Images
Transcript
Rena Sherbill: Happy to welcome back to Investing Experts, James Kostohryz, who runs Successful Portfolio Strategy on Seeking Alpha.
We’ve been fortunate enough to have James on a few times, most notably talking about the Iran War and its likelihood of it being protracted is a matter of when and not if.
And that has proven to be the case. He was also discussing the likelihood of the Strait of Hormuz being closed. Also something that has come to pass.
And it seems that every day brings more and more depressing, devastating news out of that region and also how it’s stretched into various regions in the globe as we’ve all seen. So happy to bring back James to get some context and to ground us in this moment and to get more insight and edification on how he sees the war going and what that means for us as investors.
So James, welcome back to the show and happy for you to just reintroduce yourself for those that haven’t been fortunate enough to hear your previous episodes and then lay out the picture as you see it as we’re heading into April 2026, how you see the next few days, few weeks, few months going.
James A. Kostohryz: Thank you for having me again, Rena. I appreciate it. Yes, as you’ve pointed out, for quite a while, going back even a couple of years, I’ve been saying that a major war between Iran and Israel was likely, and that in the course of this war, it’s likely that Iran would be likely to resort to blocking the Strait of Hormuz, which would turn this conflict into something of global interest and would have global economic and financial repercussions.
And here we are. People, a lot of people probably hadn’t even heard of the Strait of Hormuz and most people hadn’t been aware of the fact that blocking commercial traffic through the Strait of Hormuz could actually practically strangle the global economy.
And that’s a very real risk that we’re dealing with right now. We’re a little over four weeks, a little over a month into this war now. And so I think that the important thing to focus on is how long is this war likely to last? For how much longer is it likely to last?
And what are going to be the repercussions of that under various different scenarios in terms of the duration of the remainder of this conflict. And then we’re also going to talk a little bit about various sectors and stocks, asset classes that might do well or poorly given the different scenarios.
So to start this off, think the very first thing that’s important to understand is that thinking about when and how this conflict is going to end really goes back to why it got started in the first place.
In other words, if you understand why it was almost inevitable that this war was going to happen, that’s going to go a long way towards understanding what it’s going to take for the war to end. Now, in terms of focusing on the timing of the end of this war, there’s really two very distinct parts that it’s absolutely crucial that people separate these two parts.
The first part has to do with the very reason that the war was initiated in the first place on the part of Israel and the United States. The second part of it has to do with what’s going to happen in the aftermath of those objectives, those war objectives being accomplished.
Specifically, what’s going to happen to the Strait of Hormuz? Will Iran continue to block the Strait of Hormuz even after the United States and Israel have obtained their military objectives or not.
So let’s focus on the first part first. The two most critical goals, there were several other goals, but in terms of absolutely non-negotiable musts for the Israelis and their American allies was that number one, the threat of Iran being able to acquire a nuclear weapon be completely eliminated.
The second, existential requirement as far as Israel was concerned was that Iran’s stockpile of long range missiles that are able to reach Israel and because of the numbers of them essentially overwhelmed their defenses, that these stockpiles and their ability to launch be either eliminated or extremely severely reduced and that their ability to produce these sorts of weapons in the future would also be pretty much wiped out.
Now, both of these objectives can be accomplished through negotiation. In other words, the US in, for example, the recent 15 points that it submitted to the Iranians for consideration, those two points are in there.
The first one was, hand us your enriched uranium that you have there that’s it rich to 60 % for civilian nuclear energy purposes you only needed about 3 % they had basically brought themselves to the threshold of being able to produce 11 nuclear weapons with the amount of material they had and if they had the technology to actually what’s called weaponized this uranium that would have taken them only maybe three weeks or something like that.
So they really were on the verge of being able to do this provided that they had the weaponization technology, but nobody knew knows exactly when they were going to acquire that. They could have acquired that a week from now, or they could have acquired a year from now.
But, and nobody would know there was no way that intelligence could actually determine what exactly it is that they were working on there. They knew that they would eventually acquire this, but they wouldn’t be at ever know for sure. What they didn’t know for sure is that they possessed the enriched uranium, which is the most difficult part to actually acquire.
It takes years and years and billions in investment to actually get to the point where the uranium’s got. And so that’s really the critical component. So Trump in the 15 points laid out, we need you to completely give away this uranium, either give it to us or give it to the IAEA, the International Atomic Energy Association, and thereby forego any ambitions to build a nuclear weapon in the future.
And secondly, we need to decommission all your nuclear plants that would allow you to like rebuild this program. So that would have fulfilled the first of the two objectives in terms of the most existential objectives of the war. And then the second objective was that they agree to limitations on the range of their ballistic missiles.
And the Iranians, of course, have said that that wasn’t something they would even consider negotiating. But it’s among the list of things that both Israel and the United States consider to be absolutely crucial. The Iranians currently are believed to have missiles that can be accurate up to 2000 kilometers. That’s what was believed until recently, but recently they actually shot off and fired off a missile to Diego Garcia in the Indian Ocean, which is almost 4,000 kilometers away, which shows that they’re actually currently able to get their missiles to penetrate deep into Europe and even all the way to Great Britain.
So this has become something of a security threat to the entirety of Europe. It also shows how advanced the Iranians had become in their missile technology. They’re essentially only a small step away from having their missiles being able to reach the United States.
The United States and Israel need for this capability of the Iranians to either be negotiated away or destroyed. Those are the two biggest reasons they entered this war in the first place.
And that will also give you the answer of when they’re gonna be willing to exit. They’re gonna be willing to exit when they accomplish the objectives that they set out from the beginning, which was to make sure that Iran is not able to get its hands on this nuclear material because as long as that nuclear material remains in Iran and the Iranians are able to access it, they will always be on that breakout verge of being able to produce a nuclear weapon in let’s say three or four weeks.
We’ll be hearing about this three or four weeks until Iran becomes nuclear forever. And basically the United States in years will want to put an end to this whole fear that the Iranians may actually do this and in fact they probably have even greater reason to fear now because if the Iranians did get their hands on this uranium it’s actually more likely under this current set of circumstances that they would actually really do everything possible to go ahead and be able to produce that nuclear weapon.
It becomes even more existential now that they be able to get their hands on this uranium whether it be through negotiation or whether it be militarily. The second point has to do with their missile stockpile and their missile capabilities, that has clearly been degraded. It’s thought that about a third of their stockpile has been destroyed or permanently damaged.
Another third of their stockpile is believed to be damaged but possibly salvageable. And then there’s a whole other third that’s been untouched. The key to this issue is that Iran has enormous underground, what they call underground cities.
These are facilities that both assemble the missiles and where the missiles are stored and where they’re actually deployed using a very sophisticated rail networks and then trucks that come out of there and essentially deploy these missiles by use of mobile launchers.
There’s somewhere between 15 and 20 of these sites that are scattered all throughout Iran. The United States has managed to already hit a few of them with some of the United States most powerful bunker buster bombs.
But the Iranians have actually been very smart in building these underground cities in places that are so deep underground or that are so buried so deeply underneath mountains that these bunker busters actually can’t get to them.
So really what it’s gonna come down to now is that unless the Uranians are willing to negotiate away these two things, both their missiles and the nuclear material, the United States and Israel are gonna be forced into a situation in which they will have to actually execute ground operations to either recover or destroy the uranium on the one hand, and also execute demolition activities on these deep underground cities.
These missions would be extremely dangerous, extremely complex, and they would likely take a number of weeks, if not months, under the best set of assumptions. In other words, it would be pretty optimistic that over the course of let’s say four to six weeks, you would actually be able to accomplish these objectives if you actually had to go and do it militarily.
And it could actually take a lot more time than that. So that’s really kind of in terms of a timeline, this is the first set of, we’ll call it deadlines that we’re facing in terms of the market. We’re looking at a situation where the United States and Iran may be forced into making a decision to try to go in with ground troops, probably assisted by their allies in the Persian Gulf, to try to accomplish both of these objectives.
Under a best case scenario, it would probably take weeks to accomplish these objectives. Plus, they’re not actually quite ready to do that because they want to continue to degrade the Iranian defenses even further than they are right now.
So the US and Israel probably won’t actually be in a position to actually perform these types of ground operations for another two to four weeks. Now at the end of those two to four weeks, if they actually go ahead with these planned operations, we’re talking about several more weeks to several more months to get these particular objectives accomplished. So that’s the kind of timeframe we’re looking at.
Roughly speaking, we’re talking about if the United States and Israel can’t know, attain these objectives through negotiations, we’re talking about starting ground operations anywhere between two to four weeks from now.
And then we’re probably looking at another four weeks minimum after that to accomplish those objectives. So in a best case scenario, we’re probably looking at six to eight weeks out before these two objectives are accomplished. And that would be pretty optimistic case scenario.
Then there’s an entirely other dimension to this conflict now that goes beyond what the initial objectives of the war were, which is that since Iran elected to block the Strait of Hormuz, now you have to actually try to get the Strait of Hormuz unblocked.
But the type of military operation that would be required to actually do that is enormous. would probably take, certainly take tens of thousands, probably hundreds of thousands of ground troops and essentially would involve taking over the entire country in order to be able to get traffic through the Strait of Hormuz back to its normal levels.
So again, unless the Iranians are willing to negotiate an opening of the Strait of Hormuz, then it’ll have to be done by force, most likely through a multinational force. Here we’re probably talking about dozens of countries involved in a very, very large operation that would take probably several months before they could actually have any success.
And that’s if they’re able to have success at all, because it’ll be very, very difficult to accomplish this particular objective. I won’t actually get into the military weeds here of why this is so difficult and why this would take so long, unless you’re actually specifically interested in that.
But I do think that this is something that even under very rosy optimistic scenarios would take several months and that’s above and beyond the point where they’ve attained the other two objectives which as I mentioned We’re probably at least six to eight weeks away from occurring.
All in all we’re talking about two stages one stage, is probably six to eight weeks and another stage Which is likely to take months. Now, of course there’s always the possibility that one or two things could happen.
Either the the Iranians negotiate and so the the actual accomplishment of these objectives doesn’t have to be by military force, but through diplomacy. I think the likelihood of that is extremely low, particularly in terms of the first phase. I think it’s quite unlikely.
And I also think it’s also pretty unlikely that the Iranians are going to unblock the Strait of Hormuz and go back to the situation like it was before the war, where there was free transit through the Strait of Hormuz.
They’ve already said they’re not gonna do that. They’re in fact getting ready to pass legislation in their Congress where they are declaring sovereignty over the whole area and they’re going to essentially collect tolls and raise revenue by selectively allowing transit through the Strait.
And so we’re really looking at a situation that if there is no negotiations, we’re talking about this whole disruption that’s happened to global markets could last for many, many months beyond this initial, say, six to eight week period that I’ve mentioned, which would enable the United States and Israel to achieve their initial, let’s say, military objectives.
Rena Sherbill: And if I might add, as we’ve seen, one of the devastating things about war is that there are so many unknowns and unpredictable things that happen as a result of initial actions and catalysts. You’ve been talking about this since 2024, since April 2024, I think.
And as we’ve seen, there’s been a lot of stops and starts. Even as you say, even if America and Israel are as successful as they want to be, there are still unforeseen consequences of this. And I know that there’s many more things to get into policy-wise and militarily speaking, for that matter. All of the things that you’ve pointed to, by the way, previously, in terms of ground troops coming in, in terms of the blockages, in terms of this coming to pass at all, you’ve been extremely prescient in that.
I would ask if I may, some people would call that prescience a sort of bearishness and then, okay, at some point, you’re going to be right about the bearishness. What would you say to the notion that this is going to mean a bear market and for much longer. What would you say to investors wondering about not pricing in what this means exactly?
James A. Kostohryz: Absolutely, yeah, that was definitely gonna be the second point that I wanted to go over in detail.
Because if I’m correct about this type of timeline that I’m talking about, then we are facing either the likelihood of either a run of the mill recession in the event that the war only lasts for let’s say six to eight weeks and that for some almost miraculous reason, the Iranians decide to open up Hormuz after they’ve, the US and Israel have attained their military objectives and they, the US and Israel basically cease military operations, will the Iranians then say, okay, we’re done with Hormuz and we can all get back to normal.
So in that situation, which would be highly optimistic, we’re still probably talking about the likelihood of a business cycle recession, but it would probably be, let’s say, a one of the mill type of business cycle recession. And I’ll kind of talk about this scenario a little bit more.
But in the second scenario, where we’re talking that the Iranians don’t actually open up Hormuz after this initial period, and that we’re talking about many, many months before the Strait of Hormuz is normalized again, and the possibility of a much, much larger ground war, multinational forces and so forth, there we’re probably talking about a pretty deep global recession. historically, virtually every single time, basically since the 1950s, every single time there’s been a business cycle recession in the United States, there’s been a bear market decline of 20 % or more.
There’s absolutely no reason to think that in this instance, if we end up doing getting a business cycle recession that we won’t actually also have a bear market decline of at least 20%. All the ingredients are there.
The market was actually quite pricey. Some would say overvalued, certainly overvalued historically, but the reality is that the market was certainly in the 90th percentile and above in terms of valuations and therefore is vulnerable to a decline anyway.
And in the context of there being a recession, it would be almost a best case scenario if the market only declined by let’s say 20 to 25%, which would be a pretty, let’s say, benign bear market in the context of bear markets that happened in the context of recession.
Probably in the case of a run of the mill recession, we probably could anticipate something like a 30 some odd percent decline.
Interestingly, that sort of a decline would put us exactly where we were at the bottom of the tariff tantrum, you right after the quote unquote liberation day when the market declined by about 19%. But if you actually trace that decline from the peak of the market down to where that particular line of support is, it gives you a decline of a little over 30%.
If a person thinks, 30%, that’s too much, that’s a big decline. If you think about, we were there at that 30 % only one year ago. In other words, the market would only be retracing about where it was one year ago. In most bear market declines, the market retraces well below its 52-week low. So in this case, if we only went back to our 52-week low, we’d go back to the lows that we got after the tariff tantrum.
And that would actually be a pretty optimistic case scenario. So yes, 30 % decline, I think, would be very realistic if we get into this situation where the war goes on for another six to eight weeks.
One of the things we have to realize is if this war goes on for another six to eight weeks, we’re probably looking at any oil getting up to above $150. If we go to that six to eight week point, oil will probably be closer to $200 by that point.
That would be a tremendous, tremendous shock to the global economy, not just the US economy. The US economy would be suffering not just from the impacts that this would have on the US, but would also, the United States would be suffering from the global impacts of this. It would also be suffering from the recession, excuse me, from the inflation that this is likely to kick off in the United States.
And this in the context of an economy that is somewhat vulnerable right now for various reasons. So I think that in the scenario that we’re talking about, which is let’s say a moderately bearish scenario, one where the world goes on for another 68 weeks, we’re probably looking at about a 30 % decline in the S&P (SP500).
Now, if we go beyond that, if the straight of home is still blocked after that 68 week period, then I think we’re looking at oil prices significantly in excess of $200 probably then moving towards $300 mark, which it could get to if the conflict persists, let’s say two, three months beyond that point.
And then we’re talking about $300 oil. And then we’re talking about really much more of a severe global recession because at that point it’s really not just about oil anymore. It’s going to be a lot of other things that are gonna be coming together.
Because as you know, it’s not just oil that transits through the Strait of Hormuz. It’s a big share of the world’s fertilizers. It’s a big share of the world’s helium. A lot of industrial materials come through the Strait of Hormuz and basically a lot of industries are gonna be completely paralyzed and suffering shortages as a result of this blockage if it goes on.
And so, here we’re talking about a much more severe type of global recession, much more similar to what, for example, the world went through in 1973, 74, when the second biggest disruption in oil history happened, that was the Arab oil embargo.
And I say it was the second most important because this is actually the greatest. This is actually the greatest disruption in the oil market, in the history of the oil market.
What happened when you had the second greatest disruption is that the US went through a bear market decline of about 49%, essentially 50%, and a very brutal recession that lasted for about a year and a half, and a bear market that lasted for about a year and a half.
So I think those are broadly speaking the two scenarios that we’re dealing with, unless we are really surprised and like, know, a rabbit gets pulled out of the hat in next few days.
But again, I’m talking about the more likely scenarios, which are the scenario of a six to eight week period. If, if, if that’s all it’s going to be, then I’m thinking bear market about 30 % down in the S&P.
If we go significantly beyond that and the conflict extends for several more months as a result of a multinational invasion of Iran in order to open the Strait of Hormuz, then we’re going to be talking about more of a 50 % decline in the S&P and a very brutal business cycle and recession in the United States and in the rest of the world.
Rena Sherbill: So I think a moment of pause is good to reflect on everything that you’ve said and also the meaning behind it and the emotion and the feeling behind it for so many, if not directly involved. And as humans, just watching this all unfold, I think it’s all deserving of a moment before we get to the investment side.
Rena Sherbill: So I think a moment of pause is good to reflect on everything that you’ve said and also the meaning behind it and the emotion and the feeling behind it for so many, if not directly involved. And as humans, just watching this all unfold, I think it’s all deserving of a moment before we get to the investment side.
Having said that, there is an investment side. What does this mean for investors’ portfolios? What does this mean? Like, do you see oil majors continuing to do well into the near future because of all these factors? What else would you say portfolio-wise as it pertains to investors?
James A. Kostohryz: That very much depends on which of these two scenarios we’re discussing. I’m not gonna really discuss the scenario where the war is concluded very quickly and the straight of war moves gets back to normal in the next couple of weeks. That’s obviously possible, but I don’t think it’s likely.
So I’m really gonna focus on the two scenarios that I laid out earlier. The type of scenarios where we have either a 30 % bear market or a 50 % bear market.
Now, you mentioned oil stocks. So here, for example, we have some of the majors and then we have some of the more E&P producing stocks. These stocks will do very well in either of these scenarios, but certainly much better in the second scenario because the value of any stock has to do with the cash flows going out into the far future.
And the longer that this disruption lasts, the harder it is going to be to bring back production in the future back to the level that it once was. And it also means that global inventories are going to get so run down that what’s going to happen is that after the war, the strategic reserves and the commercial reserves are going to have to get built up back to normal.
So not only will you have the normal amount of let’s say global demand that will need to be supplied by a oil infrastructure that’s going to be damaged. In other words, it’s not going to be possible to get oil production in the Middle East back up to where it was a month ago right away.
It’s probably going to take at least six months to get it back to where it was if the war ended right now. But as this drags on, if this lasts another four weeks, we’re looking at the prospect that oil production really won’t get back to where it was until sometime in 2027, excuse me, sometime at the end of 2027.
And the projection for, and that’s just to get it back to where it is right now. And of course demand will continue to grow. So likely in this type of a scenario, we’re talking about oil in excess of a hundred dollars beyond 2027, right?
And right now, if you look at the futures market, December 2027 futures for WTI are only pricing in like $71 oil. Okay, and it’s only pricing about $77 oil for December of 2026. So there’s a very, very optimistic set of assumptions that are currently built into the futures curve in the oil market, but that is very, very quickly gonna change unless this conflict is actually resolved very soon.
And so if we start seeing the prospect of prices at 90 or $100 out to 2027, then all stocks are still gonna, even though they’ve gone up a lot, still gonna be some of the best investments in the market. If the war would be over today, I would say that most of these stocks are probably about fairly valued right now aside from the fact that they would probably actually go down in price just as a reaction.
But fundamentally speaking, they’re probably about fairly priced right now given what the futures market is indicating in terms of future oil prices.
But if I’m correct in my scenarios, then it means that the futures market is gonna have to reflect much higher oil prices. And in that case, the upside is really high, especially in the E&P sector. think that if we’re looking at 90 to 100 dollar oil at the end of 2027 and beyond, a lot of these stocks can really double from here.
And there’s quite a few stocks that could actually triple, quadruple, quintuple in price. But there you’re starting to get into individual stock picking and understanding specific stocks and the ones that could do better in these scenarios. So I won’t go into necessarily that here.
But I am saying that in the E&P sector, if you have the more bearish scenario where you think that the war is going to last a bit longer and that oil price and that therefore oil prices are likely to be in the 90 to 100 or even beyond $100 after 2027, then that’s a very, very attractive sector for people to be looking at.
Now, again, if you’re more optimistic about when the war is going to end, let’s say in the next week or so, then you should probably take your profits right now in all your oil companies and sell them.
If you believe in my intermediate scenario to four to six weeks out, I still think that the stocks still have significant upside. Here we’re probably talking about 30 to 50 % upside in that type of scenario for some of the, let’s say, some of the major oil stocks and some of the major E&Ps.
But in the case of some of the other international E&P stocks, if we’re still in that scenario of four to six weeks and this war is over six weeks from now, we probably have a double in a lot of those stocks. In other words, upside of a hundred percent in some of those stocks.
Because in a scenario like that, oil prices are still gonna be significantly high in the future because of the difficulty of bringing production back due to the damages that’ll be done in the next six weeks. So that’s definitely one of the sectors to try to really understand.
But to understand these different scenarios that I laid out and depending on which scenario you believe in, that’s how you should act in your portfolio relative to those sectors and the weightings and so forth. We are aggressively positioned in E&P.
We’re especially aggressively positioned in non-North American E&P stocks, E&P stocks that have their assets outside of North America, also stocks that don’t have their production anywhere in the Middle East that could be impacted by this situation.
And so we see a lot of potential there. Another area that I think there’s a lot of potential, and again, it’s going to depend on how much damage is actually done from where we’re at right now, is natural gas producing stocks that are involved in the LNG market.
Those stocks, I think, can do extremely well, particularly if there’s any more damage done to LNG export capacity out of the Middle East. we have some more damages than what we’ve had already, then a lot of these stocks could do extremely well because that damage is long term.
And not only is it long term in terms of production facilities, a lot of people, a lot of international clients, rather than buying oil in the Middle East that has to come through the street of Hormuz, they’re just going to say, you know what, it’s not worth that kind of risk. We’d rather buy this from American companies in the United States.
And so that means that a lot of these companies in United States are going to have a lot of really profitable future growth to look forward to. I would say that there’s some optionality involved for some of the stocks in the US that are involved in the LNG sector, producing LNG, processing it, and that have capacity export. Let’s talk about a few other sectors here.
Rena Sherbill: Can I ask you, before you get into other sectors, can I ask you, you were talking about (BNO) last time you were on. What would make you get out of BNO?
James A. Kostohryz: Well, that one’s gonna be extremely sort of news driven, right? So if there were an announcement that an agreement was either had occurred or likely to occur that led to a ceasefire and the war sort of winding to a close and no more blockage of Strait of Hormuz, which seems almost ridiculous at this point, but let’s just assume that happened tomorrow or that I was sniffing and I thought, you know what, this might happen in the next few days.
I would definitely get out of BNO because I think crude will definitely crash. It’ll probably crash down. It’ll probably overreact.
I think crude (CL1:COM) at this point is a good bet that it’s going to stay average over $80 probably for the next couple of years, even if the war is over tomorrow. But I think it could definitely crash below $80 really quick if there were some sort of announcement.
Right now I have what I’d call a core position. I trimmed that core position as soon as WTI hit around $100. And the reason is that I think that the administration is going to do everything it can to try to keep WTI below that $100 threshold just because it’s psychologically, I think, very important. But they can’t really hold this down for very long. So I think I still have a core position.
And I think that, as I said before, we’re likely to start moving up towards the $150 to $200 barrel in my, let’s say scenario where this war is gonna last another four to six weeks. And we’re kind of gonna know that probably in the next week or so, right?
Because President Trump essentially gave the Iranians a deadline. He’s already extended it a couple of times, but it’s getting to the point where if they don’t come to an agreement, as I mentioned before, they’re gonna have to face the likelihood of having to perform ground operations.
And those ground operations are gonna last a while, right? So that means that we’re again gonna be four to six, you know, we’re gonna be six to eight weeks away. And during that period of time, the shortages are gonna become so acute in the global economy that Brent (CO1:COM), which is today I’m just going to look at what price Brent closed at. I think it was about a hundred. Let me just take a quick look here.
So WTI right now is at about 105. This is the front month future contract and Brent at about 108. you know, Brent can easily go, which is, you specifically mentioned BNO, which is based off of the Brent benchmark. And I actually do recommend that benchmark more than I do WTI.
It can easily get to $150 and beyond. So I still think that the risk reward there is pretty attractive because again, if we get good news, we probably crash down to $80 and a little bit below. But let’s say a person could stop out probably before it got below $80. So you’re looking at 15 to $20 downside, but you’re looking at more than a $50 upside.
So the reward to risk profile there even though this is a very risky investment, I still say it’s very good. And I have a significant core position there and I’m actually willing to add to it. If we don’t see having signs of progress during the course of this next week, I think I’m to probably double my exposure to crude oil through BNO and some other potential instruments there because I just think that the scarcities are very real.
The oil market has a speculative component to it, but it also has a pure supply demand component. And at some point you get into marginal demand bidding where people that just need oil, if there’s a shortage, they’ll pay whatever price in order to get that oil.
And we haven’t reached that point of crazy pricing yet because most places in the world still have some strategic reserves, but those strategic reserves are starting to run really, really low in a lot of places in Asia already.
They’re going to start running low in certain places in Europe. And as we go further and further, we’re going to start getting to that crazy bidding by marginal players, marginal demand players that just require oil at almost any price.
So to answer your question, I still like BNO in a core position, although I think it might be susceptible to a pullback here on some good news about negotiations or job owning or whatever you want to call it.
But then once we look out, if we’re still involved in this war, you know, a week or two from now, I think we’re heading to 120 and well on our way to 150 or above in my scenario of 68 weeks more of fighting before the objectives are accomplished.
Rena Sherbill: I appreciate that. Happy for you to get into other sectors.
James A. Kostohryz: One of the other sectors that I think we should all talk about here, very important is bonds.
Even if you don’t invest in bonds, it’s a very important to understand what’s going on in the bond market.
Because one of the most dangerous things that’s happening, and a lot of investors are probably not paying enough attention to it, is that bond yields have been rising. The 30-year Treasury yield has risen, is getting uncomfortably close to 5%.
And just above 5% is as high as the 30-year treasury yield has been in something like 20-some odd years. If you start getting that 30-year yield to 5% and above, it starts choking off the US economy.
And so it’s very important that people actually start really following that yield on their screens if they aren’t already. And I suspect that most of your readers probably aren’t necessarily following that, but very, very important to do that.
Now, it’s very important to understand what’s going on here and separate the bond yield between what’s called the real yield and the inflation expectations component of the yield. The inflation expectations component of the yield is what it of sounds like.
It’s how much inflation investors are implicitly pricing in will occur over the course of the next 30 years. Let’s say if it’s a 30 year bond yield or if we’re dealing with a 10 year bond yield, it would be for the next 10 years.
Those inflation expectations, interestingly, are actually still very low. other words, investors are right now are thinking inflation is going to shoot up in the next year, but then inflation is just going to head back down to 2%. And therefore the very long term prospects for inflation are still very bullish and the market is actually very calm about those long-term inflation expectations.
Those long-term inflation expectations haven’t really gone up very much. What’s actually very concerning, Rena, is that the real yield component of bond yields has actually risen to record levels from the last 25 years.
And that is actually a huge problem. Because it’s the real yield that’s actually more important for economic growth than any other yield and any nominal yield it’s really the yield that tells you about the tightness in the financial system and it’s the one that poses the greatest risk to the economy that real yield has risen to dangerously high levels and one of the things that’s going on there is that if this war continues it’s going to put a big fiscal strain on an already very fiscally strained United States, let’s say fiscal and debt situation.
As you know, the United States is carrying a very large debt and it’s also carrying a very large fiscal deficit. If we have a recession and at the same time we’re trying to pay for a war, the deficit is going to explode to record levels and the debt is also going to explode upward.
And that kind of a concern is actually being reflected in the real yield. In other words, investors are demanding return above and beyond their inflation expectations, which is really, really high compared to what they’ve been demanding in the last 20 to 25 years.
And if that real yield continues to go higher, it’s really, really bad news for the economy. And I encourage people to watch that closely. If we start getting the real yield yesterday got up to like 279, it was down a bit today. If that gets up to 3%, that’s a big alarm level right there.
And to either look at as potential resistance to potentially try to take advantage of that and buy some bonds, or think, you know what, if you don’t think it’s going to stop there and go beyond that, that’s a time to really, really then start hitting the, I would say, sell buttons because then the economy is going to be in really big trouble.
The main instrument that investors or that I like to use to focus on the real yield is tips. Now there’s various instruments in the market that track tips and that track tips of different duration.
One of the products that I use in my service for holding long-term tips of duration of 25 years and more is a product called (LTPZ). And it’s something that it’s actually worked well for me in the future, excuse me, in the past. I sold that out of my portfolio a few weeks ago, but I think that if we get a real yield up to, let’s say, 3 % range, I’m gonna very, very seriously consider buying a big chunk of LTPZ at that point.
The reason is this, if you can get a 3% real yield plus whatever inflation happens to be, in other words, if inflation is 3%, 5%, even 10%, the TIPS are gonna pay you that inflation rate plus the real yield of 3%. So you get 3% plus whatever inflation is, you’re completely protected in terms of what inflation is gonna be in the future.
That’s actually a very attractive return even compared to stocks at that point. In other words, if you get a 3% real yield plus inflation protected return of let’s say another 3%, you’re talking about a 6 % return, it’s hard to find stocks that are going to return 6% between dividends and capital appreciation over the course of the next couple of years.
So I think that TIPS (TIP) and basically you’re taking virtually there no risk here because you don’t have any inflation risk and you don’t have any repayment risk in in TIPS.
Now you do have a capital appreciation risk and that’s the second part I’m to mention here which is that if real yields went higher you might be suffering an unrealized capital loss there but the flip side of it is this if the real yield goes from % down to about 2% which is where it was before all this, you’re looking at a potential capital gain there in the order of about 20%.
And if we end up having a serious recession and TIPS behave as they have in the past where the real yield and the recession generally goes down to about 1% or below. Let’s just say it went down to 1%. We’re talking about a gain of 40 to 50 % in terms of a capital gain on these long-term TIPS plus your real yield plus your inflation protection there you have, basically what you have there is almost a dividend stock where you’re gonna be paid possibly 5% dividend yield, maybe 6% dividend yield between the real yield and inflation, right? Five to 6 % yield.
And then you have a potential capital gain, as I said, of somewhere between 20 and 50%. I mean, it’s hard to beat that in terms of relative attractiveness, especially considering that it’s far less risky than stocks. So I wouldn’t be a buyer of long-term tips here, but I’d definitely be on the lookout for them.
if we hit that real yield of 3%. In terms of more nominal bonds, still think that treasuries might look, they might look attractive at if we have real yields of say 3 % and let’s say the nominal bond yield might be up to 5.5 % or even a little higher.
But I just think the tips are safer because we could get an inflation scare and if you get an inflation scare and you’re holding nominal treasuries, you’re going to get brutally beaten up.
Whereas if you’re holding TIPS, you’re not, because TIPS are by definition inflation protected. So that’s what I would say in terms of bonds.
I wouldn’t touch corporate bonds here pretty much with a 10 foot pole, because not only do you have all the risks that you have in treasuries, you have a risk that spreads are going to blow out here. So I would definitely not hold any corporate bonds in my portfolio whatsoever unless it just happens to be very special type of situation.
Let’s move on, talk a little bit about gold (GLD). Perhaps this is an asset that I think a lot of people always think about in terms of when there’s some sort of a crisis going on economic crisis they’re wondering whether they should own more gold, whether they should buy gold, etc.
I think that anybody who purchased gold has been extremely disappointed in the last few months because gold has actually gone down significantly in price since the war started, which is probably opposite of what a lot of people were expecting.
But it’s nonetheless something that I’ve warned about on this show of yours in the past that I felt that gold was extremely overvalued and therefore vulnerable to a decline. And in particular, there’s a couple of reasons why I think gold has sort of crashed here in the last few weeks.
The first simply has to do that a lot of people hold their savings in gold and if they need access to liquidity, and that’s happened obviously in a lot of places in the Middle East, people that need access to liquidity, if they have some of their savings in gold, one of the first things they’re gonna sell is that gold because it’s what, they’re able to sell that.
If they try to sell, for example, stocks or bonds that are extremely depreciated, or let’s say if you’re somebody that owns apartments in Dubai and those apartments are down 30 % in value and you can’t even sell them right now because the market’s a liquid, you’re going to sell whatever you can that you can and gold is a very liquid market.
So you have some people that have been liquidating gold for that reason. Central banks have been liquidating gold because a lot of central banks are all of a dealing with the fact that they’re going to have major trade deficits because the price of oil, if you’re an oil importing country, all of a sudden your oil bill is going to be a lot higher and you’re going to need hard currency in order to purchase that oil.
So that’s putting pressure on some several different global central banks that are actually sellers of gold. As you know, one of the main reasons that gold has been rising is that global central banks were net buyers in a big way in the last few years, but that has turned around pretty dramatically where you now have several global central banks that are selling into this really high gold price, taking advantage of the strength of the last couple of years and basically dumping their coal because they know they need to have cash on hand to essentially protect the currency.
Because again, if you’re an oil importing country or if you’re importing any of the materials that are going to become scarce, your currency is going to be in trouble and you’re going to need that liquidity. So they’re kind of dumping gold and that’s one of the other factors that’s impacting gold here.
Again, whether you want to invest in gold going forward, it depends a little bit on which scenarios that you’re dealing with here. If you’re dealing with the scenario of let’s say, particularly the scenario of let’s say six to eight weeks, I would say that there’s going to be continued pressure on gold because there’s going to be liquidation both by individuals and central banks.
I think the price of gold will continue to be pressured in that case and we’re probably going to see lower lows in gold.
In the event that we have the more severe scenario where we’re looking at multiple months and gold prices going up above $200, I think that’s a more bullish scenario for gold in the long term, but gold will probably again, it’ll probably dip well below its more recent lows. I believe it’ll dip down well below $4,000 before it might actually start to rise again based on long-term inflation expectations.
In other words, as I mentioned a little earlier, long-term inflation expectations right now are quite tame. But once we start getting into the prospect of a war that might go beyond this six to eight month period, and we’re talking about several months now, then we’re talking about the risk of long-term inflation being a lot higher.
In that type of a scenario, gold, should actually perform better because it’s a hedge against long-term inflation. In fact, gold generally trades as a function of long-term inflation expectations as opposed to short-term inflation expectations.
And by the way, I forgot to mention, but the number one thing that tends to move oil in the short-term is real interest rates. And one thing that I think a lot of people didn’t notice is that real interest rates rose and when that happens, gold generally goes down.
So one of the factors that’s actually caused gold to go down is that real interest rates have gone up. That’s something that I talked about when I talked about bonds.
And that could continue to happen, as I said, as a result of the fact that if the United States is in a situation where it’s gonna be having to pay for a longer war, and it’s also gonna have a recession where revenues are gonna go down, deficit and the debt are going to explode and that’s going to put pressure on long-term interest rates and that could also put pressure, downward pressure on gold on the price of gold.
I personally wouldn’t touch gold at a price of much more than let’s say thirty five hundred dollars or so. I think that gold is overvalued even at four thousand dollars, I think it’s likely to go below four thousand.
But once it goes below four thousand, I think it’s at least viable to start looking at it, particularly if you are thinking about the more bearish scenario that I mentioned of a multi-month war.
So that’s where I would say with gold, obviously, everything I said right now with respect to gold would apply to gold miners. There’s no reason to own gold miners unless you think gold is going up, really. There’s no reason to own gold miners if you think that gold or gold prices are gonna go down, you shouldn’t own them.
If you think they’re gonna go up, then you should own them. It’s just that gold miners are generally a high beta play on gold. When gold goes up by a percent, gold miners generally go up by about a percent and a half. And when gold miners go down by a percent, gold miners actually go down by 2%. So it’s actually an asymmetric bet with some downside bias there.
But certainly if you’re really bullish on gold, then you want to be involved with miners because you’re probably going to get a one and half times return, whatever the price of gold kind of goes up. As I said, I wouldn’t be touching that either gold or gold miners right now because I still think the gold price is overvalued at this particular point in time.
Rena Sherbill: I was going to ask about the US dollar.
James A. Kostohryz: The US dollar (DXY). I mean, this one is also this one’s a tough one, right? Because even though the US is going to be facing a bad situation in terms of its debts and deficits, everybody else is too, right?
So when we’re talking about the dollar, we’re talking about pricing the dollar relative to other currencies. And the United States, after all, is a net oil exporter. So from a current account perspective, the United States current account will actually improve from that point of view.
And also in a recession, we know that the US current account improves. So the US dollar could actually strengthen pretty significantly if this crisis drags on.
And that would also obviously be a negative for gold.
So again, I would say bullish US dollar if you’re more bearish on the war situation. If you’re less bearish on the war situation, you think it’s going to be over soon, then I think the prospects are that US dollar might come in a bit and have a nice little pullback.
Some other things to maybe think about would be industrial commodities. If we’re talking about the prospect of a global recession, watch out. I think a lot of people are getting excited about the shortages that might start appearing in some materials like aluminum.
We heard about the fact that an aluminum plant got bombed the other day and that could crimp global supply. In addition, all the aluminum coming out of that part of the world is currently backed up because it can’t get through the Strait of Hormuz.
Copper mining depends on materials that actually come out of the Middle East. And so it can actually impact the volumes there. I think that all that’s kind of missing the point, which is that if we have a global recession, we’re going to have a big decline in demand for industrial commodities.
Therefore, I think that the prospect for a lot of the industrial commodities, particularly aluminum, steel, copper, and so forth is actually quite negative. And the more bearish you are about this war scenario, the more negative the scenario is gonna be for those commodities.
And certainly for the producers of those commodities, because not only is the price of their commodity gonna go down, their input prices are gonna go up, especially the price of fuel. And these are very fuel intensive industries.
So when the price of fuel goes up, their margins are going to get hugely squeezed because at the same time, the price that they’re getting for the product is going to fall.
So I will be very cautious about buying mining stocks in the industrial metals space, like aluminum and copper and some of the other ones, iron ore and so forth. I’d be very, very wary of having stocks in those particular sectors.
Agricultural commodities, I think there’s prospects, as you’ve probably heard. The spring planting season looks like it might come and go and there’s not gonna be enough fertilizer in certain parts of the world.
So the yields on crops and just the sheer volume of product that’s going to be produced in certain crop categories like wheat, it’s likely to be severely curtailed.
And so I think there’s going to be some speculation in those markets and we could have some boom type pricing in a couple of these markets in the event that we actually have this big decline in yields and even just decline in acreage planted.
So that’s an area where people who are specialists and people that have knowledge of this particular area can look into for retail investors. There’s not really a great place to really play this because even though there’s some ETFs that hold agricultural commodities, I don’t necessarily recommend messing with those because the contango that you have to deal with in those particular products is something that causes them to have a big decay in value over time, even if the price doesn’t move at all.
The contenders are only gonna get worse here because it’s the future price that’s actually gonna rise rather than the short-term price. And so the decay is actually gonna be even worse.
So I would definitely not recommend that investors mess with some of these products that invest in near-term, agricultural commodities futures like wheat (WEAT), or corn (CORN).
Some of these, there’s several of these products of this particular nature. I wouldn’t mess with it. If you’re actually somebody who knows about agricultural commodities, how to invest in that space, you probably wouldn’t be buying that anyway. You’re gonna be investing in the futures. And so that’s not something I think I’d recommend most people sort of mess with.
There’s some other ways to play the agriculture. There’s John Deere (DE), but again, they have a lot of industrial demand, so they’re going to get hurt as a result of this. So it’s not clear that they’re going to be a net winner, even if agricultural commodities prices go up.
There’s a stock that I’ve owned over the years that I like a lot. It’s an agricultural commodities trader that has the symbol (BG), it’s Bunge Group. They might do well in this particular environment. And again, if you know enough about the sector, it’s a stock to at least look at.
There’s some stocks that there are going to be some big issues going on in terms of the world of agriculture, but it’s not something that’s necessarily super easy for a retail investor to take advantage of because there’s just not that many stocks or let’s say investment alternatives that are available to retail investors to really sort of capitalize on this properly.
I guess the final thing that I would just mention because we’re probably way over my allotted time here would be tech because a lot of people have exposure to tech.
Tech overall, over 40% of the S&P 500. So hugely important sector. How’s it gonna do in this environment? Well, again, there’s no such thing as tech in terms of a monolith. There’s obviously gonna be some stocks that might have some serious problems if they, for example, are relying on helium, some of the semiconductor producers, you need to really understand where your company is sourcing its inputs to understand how it might be impacted here.
And that’s literally a stock by stock investigation. So if you are an owner of these stocks individually, I really recommend that you figure out how those specific individual stocks, because some of them may not have their inputs impacted very much at all, in terms of because of where they’ve sourced them and maybe if they’ve also hedged them in advance and so forth using the futures market and other ones are going to be very severely impacted.
So that’s something to kind of look at. More generally, I think that if we’re dealing with a recessionary scenario, all these companies are going to have less cash flow and they’re going to end up having to cut back on AI investments.
A lot of the projected capital expenditures on AI are probably going to tick back. And that’s of course going to affect the whole sector because a lot of valuations in the tech sector are dependent on rosy projections about growth, AI driven growth in the future.
But that growth won’t necessarily be there if everybody’s forced to cut back on CapEx. The other issue here is that it might just be harder for some of these folks to get credit. think that conditions, liquidity conditions are going to be far more constrained for reasons that I mentioned earlier and interest rates are going to be higher.
So we’re already seeing examples of this in the private markets where it’s harder and harder for some of these companies to actually fund their projects, particularly projects that are gonna be really cashflow negative for a couple of years. I think it’s just gonna be a lot harder for people to fund.
And as a result, the expected growth rates of a lot of stocks that are heavily dependent on prospects for AI driven growth in the future, I think that is gonna get impacted pretty significantly by this crisis if we get into the more bearish scenario of war lasting more than let’s say eight weeks and having these global disruptions for eight weeks. If it only lasts six to eight weeks more, I think everything is going to get hit.
But I think that tech will actually do fairly well on a relative basis because really one of the things that I think you know and your readers know is that tech actually hasn’t been performing all that well in the last few months. In fact, most tech stocks are actually down over 20%.
Certainly the median major tech stock, the MAG-7 and so forth, they’re down more than 20 % on average and in terms of median. Whereas the market is only down about, I think, 7% at this point.
So these stocks have actually already come down quite a bit. Whereas there was a big outperformance of cyclical and value stocks right before the crisis. So I think those stocks are actually more vulnerable.
I think we’re going to have bigger declines in cyclical sectors, economically sensitive sectors, and therefore value-oriented sectors, because a lot of these cyclical oriented sectors also happen to be value stocks.
That’s not always the case, it tends to be the case that value indexes are very heavily weighted towards cyclicals. So I think that you have to be careful because value can mean a lot of different things.
But if your value is cyclical, then I think that’s gonna potentially do very poorly, particularly if you’re bearish regards to the war. And I think tech will actually outperform those stocks, even though I think everything is coming down if this war, as I said, lasts the six to eight week period that I’ve mentioned, and certainly if it goes beyond that.
I think obviously sectors that a person might want to look at are the more defensive sectors. But a lot of those sectors are not really very attractively priced at this point. So it’s a matter of saying, well, if you go into those sectors, it’s just gonna go down less than everything else, but why do that?
In other words, if you have the flexibility, you’re better off holding cash rather than just buying something that’s gonna go down 15 % rather than 25%. So that’s what I would say. Now, a lot of people that like to remain fully invested and don’t like to hold cash, they can do that type of rotation, but I’m definitely not a fan of that.
I think that if you have conviction, if you actually think that this war is going to last for at least another six to eight weeks as I do, you should aggressively move to cash.
You should aggressively potentially move to some of the sectors that I’ve highlighted could do well here, but definitely move out of pretty much every sector of the market outside of energy.
There’s some other stocks, there’s some engineering and construction stocks that are going to get a lot of work in the rebuilding efforts, if they happen to be positioned correctly, their businesses are positioned correctly for the post-war environment.
I think there’s some stock picking that can go there, people that can benefit. But for the most part, we’re looking at a situation where the market is probably gonna be going down 12% from where we are today, at least if this war outlasts another six to eight weeks and it could go down another 40% or more from here if this war goes multi-months.
So my thing is I would say really be thinking about being defensive for most people. And if you’re more like what we’re doing in my successful portfolio management, we’re way up for the year. We’re up well over 40 % for the year so far.
And we’re going to continue to go up if my predictions go true. But that’s because we’re aggressively investing in crude. We’re investing in E&P stocks, particularly ones that I mentioned that are international.
And we expect our portfolios will actually go up a lot. I mean, we’re talking about a lot if my scenario actually plays out. But if you’re just defensive and you’re just worried about the situation, you don’t want to take risks, then he best thing you can do right now is raise cash.
Don’t go into long term bond funds that have high duration bonds, because those, as I mentioned earlier in the bond segment that we discussed, I mean, those can get hit. So if you’re going to go into a bond fund, it needs to be very, very short term bonds.
But for the amount of yield you’re getting, you’re better off just doing a money market fund where you can get it yield similar to what you’re going to get into any kind of a short-term bond fund.
So just go into cash and when I say cash, I mean money market fund, a high yield savings account, and look for some opportunities that might arise.
If you happen to agree with me about the timeline of this war, you’re going to be seeing a lot of stocks that are a lot cheaper that you’re going to be able to buy 15, 20, 25% lower in the first of my scenarios and in the second scenario you’re going to be able to buy stocks 40% cheaper than they are right now.
Rena Sherbill: James, I appreciate it, appreciate you always being so generous with your time and your thoughts with us. Your investing group is Successful Portfolio Strategy for those that are interested and feel compelled, which I believe you would be after listening to James’s episodes and reading his articles, check out Successful Portfolio Strategy on Seeking Alpha. James, thanks again for the conversation. Talk to you soon.
Fear Just Hit “Extreme.” Here’s the Dividend Grower to Buy.
Brett Owens, Chief Investment Strategist Updated: April 1, 2026
Half of individual investors think the stock market will be lower six months from now. That’s a level of bearishness that intrigues contrarians like us!
The weekly AAII Sentiment Survey reports 49.8% bears. The historical average is just 31%:
Most investors, at any given time, think the stock market is heading higher. And at any given time, they are likely to be right! We all know that over long time periods the path for the market is up.
However, it does so in fits and starts. Bull markets stroll the stairs on the way up but bear moves take the elevator lower. This is scary and tricks vanilla investors into “moving to cash” with the notion they can time the bottom and “buy back in” at the lows—or when “it’s safe again.” Ha!
This is generally a losing strategy because markets rebound so quickly off lows that the cash hoarders miss the best gains! Too bad for them but helpful for thoughtful investors like us who are not afraid to buy bargains when the near-term looks bleak. Because, well, that’s when the best deals are had!
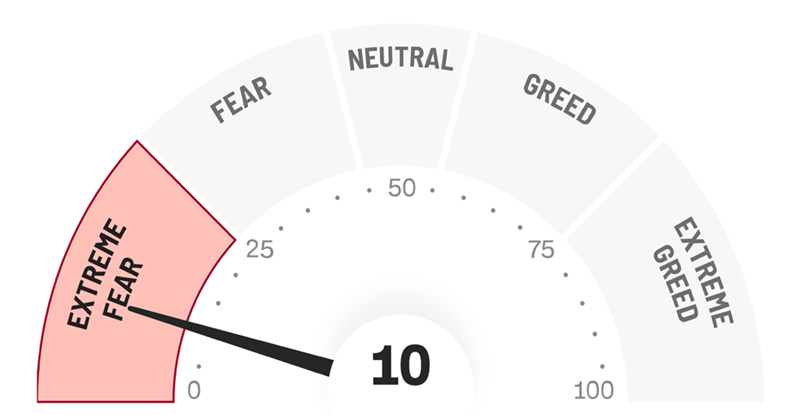
And oh boy, do things look bleak. The so-called pros are running too. CNN’s Fear and Greed Index—which mashes together seven market indicators into a single “mood ring” for Wall Street—just hit “Extreme Fear”:
Fund managers are hoarding cash at the fastest clip since March 2020. That was the COVID crash—and it turned out to be one of the best buying opportunities in a generation!
I’ve seen this movie before. We saw it again in late 2022, when everyone was convinced the Fed had broken the economy. And in April 2025, when the Fear and Greed Index hit single digits—and the S&P 500 ripped higher for the rest of the year!
Every single time, the investors who sold into fear looked back six months later and wished they hadn’t. So what should we dividend investors do instead? The opposite, of course. We should be buying dividend growers on sale.
The Dividend Magnet: Our Fear-Proof Strategy
I’ve spent over a decade developing what I call the “Dividend Magnet” strategy. The idea is simple but powerful: when a company raises its dividend year after year, its stock price follows the payout higher, like a magnet pulling iron filings.
It works in bull markets. It works in bear markets. And it works especially well when we buy during moments like now—when fear pushes stock prices down while the dividends keep marching higher.
Think about it. When a stock’s price drops but its dividend keeps growing, what happens to the yield? It goes up! We lock in a bigger income stream at a lower price. And then, when the fear passes (it always does), the dividend magnet pulls the stock price back up to where it belongs.
We contrarians love fear. Let me give you a real example. Aflac (AFL)—the supplemental insurance company with the duck commercials—is a textbook dividend magnet.
AFL has hiked its dividend for 43 consecutive years. Over the past decade, the payout has grown by an average of 11% per year. And AFL just hiked it 16% last year! The total increase over the past 10 years? A near-triple, 197% to be exact.
AFL’s Decade-Long Dividend Triple
And management doesn’t stop there. Over that same decade, Aflac’s buybacks have shrunk its share count by nearly 40%. So each remaining share commands a bigger slice of a growing profit pie. It doesn’t get more shareholder-friendly than this!
Here’s what I love about AFL in this fearful market: the stock trades around $108, down about 10% from its 52-week high. Vanilla investors see a falling stock and run. I see a dividend magnet on sale.
AFL yields about 2.2% today—not jaw-dropping at first glance. But remember, this isn’t a stagnant 2.2%. It’s a 2.2% that grows by double digits per year. Buy AFL today and that yield-on-cost balloons over time. (Investors who bought Aflac a decade ago now earn substantially more on their original investment. That’s the magic of accelerating dividends.)
Plus, AFL’s payout ratio is just 33%. That means the company pays out only a third of its earnings as dividends—leaving enormous room for future hikes. The dividend is about as safe as they come, backed by an A.M. Best A+ financial strength rating.
And here’s the kicker: Aflac is actually benefiting from AI. The company uses AI-powered systems to process insurance claims in minutes rather than weeks. Industry benchmarks show AI-driven fraud detection reduces suspicious payouts by 20% to 30%—and Aflac is deploying these tools aggressively. Faster claims, lower costs, happier customers—all flowing straight to the bottom line and fueling future dividend raises!
This is the kind of “boring” stock we contrarians love. Broader fear gives us a buying opportunity to get rich safely. And AFL is just one of several dividend growers on sale today. I’ve built an entire portfolio of dividend magnets in my Hidden Yields service—companies with accelerating payouts that pull their stock prices higher year after year.
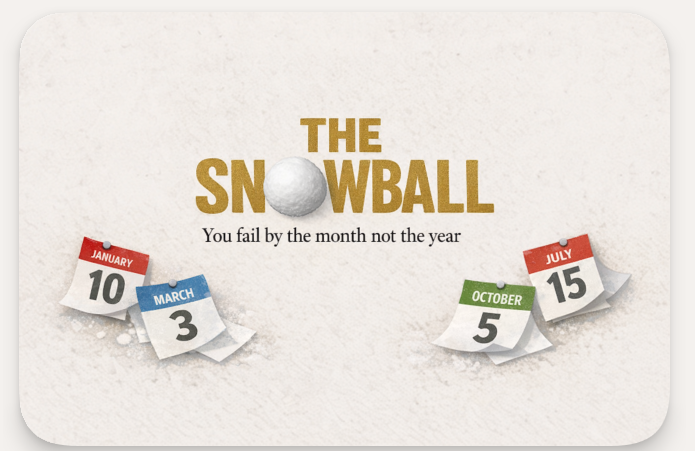
Markets will be closed over the long weekend, so the end of the financial year for the SNOWBALL is today, as we start our journey again with nothing in the 26/27 pot.
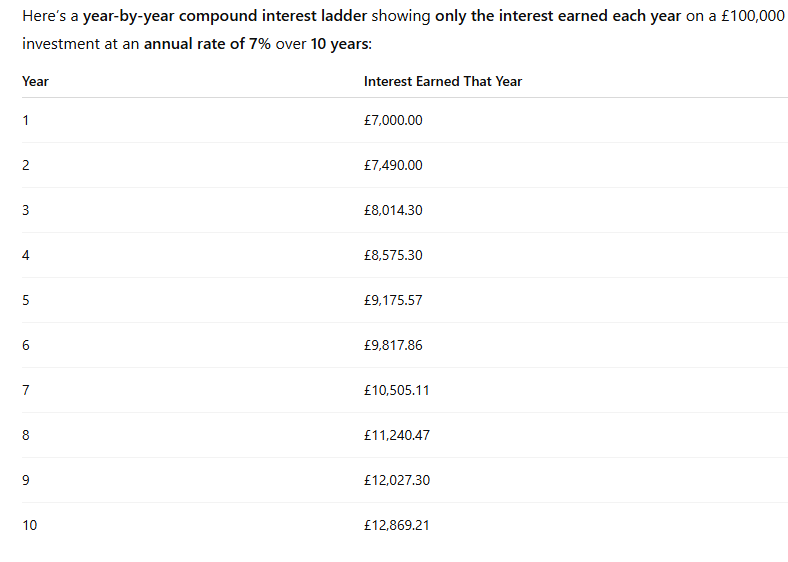
Income for the current year is £13,450.29, this includes some special dividends so the current fcast is still £10,500.
The current plan is
Over the weekend the when markets are closed the SNOWBALL will earn £115.00.
I have bought for the SNOWBALL 1313 shares in TMPL for 5k.
Combined with the purchase of MRCH the blended yield is 4%, which equates to a loss of income for the Snowball of around £400. MRCH/TMPL would have to go up by 40% and then the profit crystallized and re-invested at 10% to equal the loss of income.
Whilst the loss of income will not alter the fcast of £10,500 it will make the target more difficult to achieve.
You’re reading a free article with opinions that may differ from The Motley Fool’s Premium Investing Services.
Image source: Getty Images
Some investors take a very clear approach when it comes to investing their Self-Invested Personal Pension (SIPP). They focus on high-yield dividend shares and try to build substantial income streams, compounding the dividends along the way.
This approach can have both pros and cons. Here is a trio of things to think about when deciding whether it might make sense for your own SIPP.
Growth and income can both help you build wealth
Seeing dividends pile up can feel good, partly because they are not subject to tax while inside the SIPP wrapper.
Please note that tax treatment depends on the individual circumstances of each client and may be subject to change in future. The content in this article is provided for information purposes only. It is not intended to be, neither does it constitute, any form of tax advice. Readers are responsible for carrying out their own due diligence and for obtaining professional advice before making any investment decisions.
By contrast, putting money into a growth share and holding it potentially for decades without receiving a single dividend may seem less exciting. But growth shares can help build wealth, if they end up being sold at a higher price.
Dividend shares and growth shares typically offer different routes to trying to increase a SIPP’s value. In fact, it is possible for both to do so.
High yield can a red flag, but isn’t always
As a general rule, I think it makes sense to invest by finding good companies and then assessing whether their share price is attractive. In practice, a juicy dividend can sometimes distract investors who aim to do that.
They start by finding a high-yield share. They look at whether the payout is covered by earnings. Then, they try to convince themselves that the risks (such as the dividend being cancelled) are manageable.
Sometimes, though, a high yield can be a red flag that the City has doubts about whether a firm will be able to maintain its dividend.
Such dividends are sometimes cut or even cancelled. Others stay the same or grow – and investors can earn chunky passive income streams.
So I think it is important as an investor to be honest about the risks of a given share, not just the potential rewards.
Staying diversified always matters
Often, high-yield shares cluster together in certain stock market sectors.
Right now, for example, three of the FTSE 100’s five highest-yielding shares are financial services firms. The other two are property companies.
The FTSE 250 shows a different bias but the same pattern. All five of its highest-yielding shares are linked to renewable energy.
It is always important to manage investment risk by diversifying. With high-yield shares clustering in certain sectors, that can take a concerted effort.
By nature, a SIPP is a long-term investment vehicle. Its lifetime will likely involve periods when cyclical shares are at different points in the economic cycle. That could mean depressed share prices, dividend cuts, or both.
I did not own any renewable energy shares in my portfolio recently, so I took the chance to add Greencoat UK Wind (LSE: UKW).
The company owns stakes in a number of wind energy projects. That has helped it grow its dividends annually in recent years. The current dividend yield is 10.7%.
The share also sells for a substantial discount to its net asset value, suggesting it could be a bargain.
Still, as the past year’s share price performance and high yield suggest, some investors are nervous about the prospects for energy funds, including this one. Changing attitudes on energy policy combined with current energy price volatility could hurt profitability.
I reckon those fears are more than factored into the current share price, though, so I happily bought the share for its passive income potential.
2 “Defensive” Dividends Growing Fast (Thanks to AI)
Brett Owens, Chief Investment Strategist Updated: March 31, 2026
Fear is up, markets are down—and we contrarians know that times like these are when we go shopping.
Yes, stocks are wobbling. And yes, those hoped-for rate cuts have dried up. Even one may be a stretch this year. But as worrisome as the situation in the Middle East is, as investors, we need to look beyond it.
Truth is, in the long run, AI will cap wage growth (it already is). That will take a bite out of inflation, and rates, while boosting profits—and our dividends along with them.
Fading Short-Term Fears
At times like this, we come back to our “Dividend Magnet” plays: Stocks growing payouts fast—and pulling up their share prices as they do. In the last few weeks, Middle East tensions have knocked many of these stocks behind their dividend-growth pace. That’s our cue.
Below are two examples. Both have pulled back, even though neither has anything to do with the Middle East. Plus, both are “stealth” AI plays that aren’t getting their due.
WM: More Trash, More (Dividend) Cash
Waste Management (WM) does two things we love:
Raises its dividend and …
Grows its free cash flow (and its share price along with it!).
Geopolitics doesn’t touch this business: It just goes on quietly collecting trash.
Not just that: It actually controls the entire waste, er, management cycle: as of year-end 2025, WM owned 257 landfills, 482 transfer stations, 162 recycling depots and 17 medical-waste incinerators. All that trash has been rocket fuel for WM’s dividend:
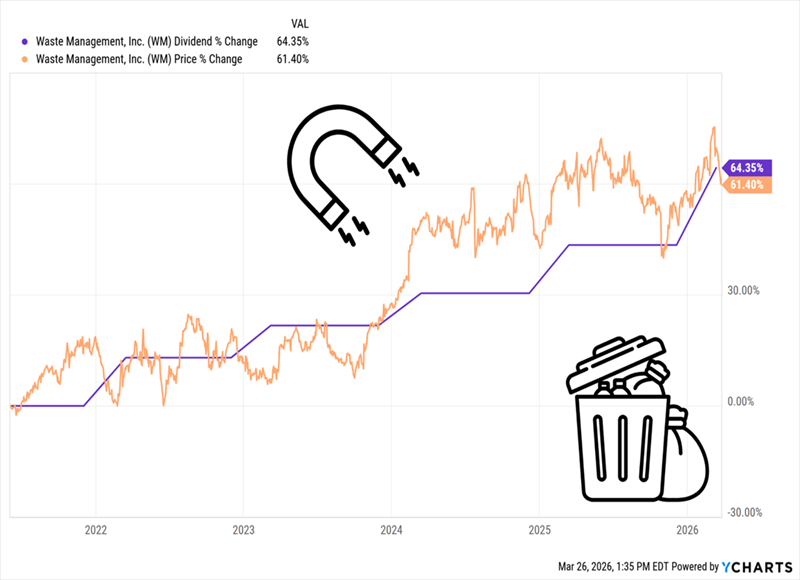
A Trash-Powered Dividend Magnet
Impressive as those numbers are, they’re first-level stuff—known by anyone who takes a glance at the company. Our second-level analysis kicks in with the dividend. With a yield of just 1.5%, most folks dismiss WM.
Here’s what they’re missing: As you can see above, this payout isn’t just growing, it’s accelerating. The latest hike, declared March 2, was 14.5%. This is WM’s 23rd straight year of increases.
That fast growth clip grows an investor’s yield on cost in a hurry. Anyone who bought just 10 years ago, for example, would be yielding around 6.6% on that buy now.
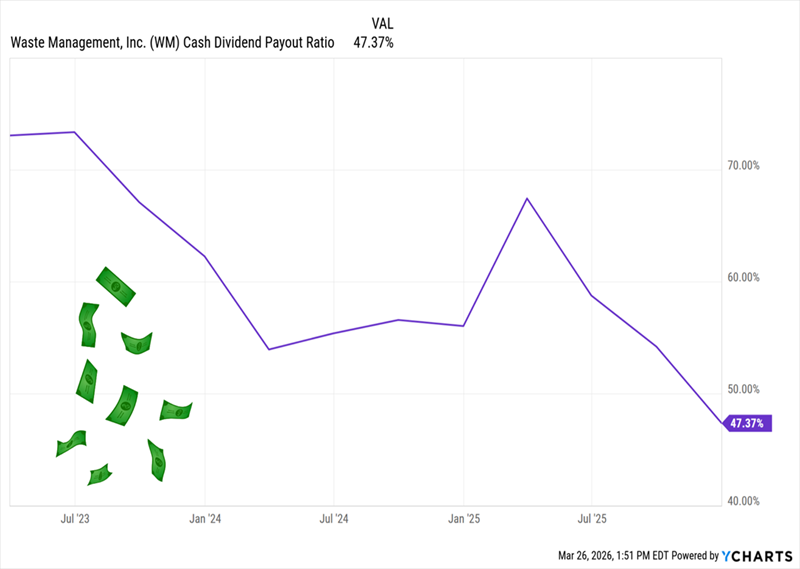
Cash Pile Grows Faster Than Management Can Give It Away
Here’s something else few first-level investors realize: Even with its fast payout hikes, WM’s payout ratio (as a percentage of free cash flow) has been falling for years.
Dividend Surges—and Gets Safer
I expect that to continue, especially with CEO Jim Fish stating in the company’s latest earnings report that he sees FCF growing 30% this year.
That’s in part because WM is investing in AI—and it’s paying off. Management has earmarked $1.4 billion between 2022 and 2026 for automation, including robots that—thanks to machine learning and top-flight imaging tech—can identify and pluck up to 1,000 items an hour from the waste stream. That’s more than 10 times “human speed.”
WM is never “cheap” (its P/E ratio is 34), and it’s gained 3% this year, as of this writing, beating the market. But since Middle East hostilities broke out, the stock has dropped 6%. That’s a solid deal on this top-notch dividend grower.
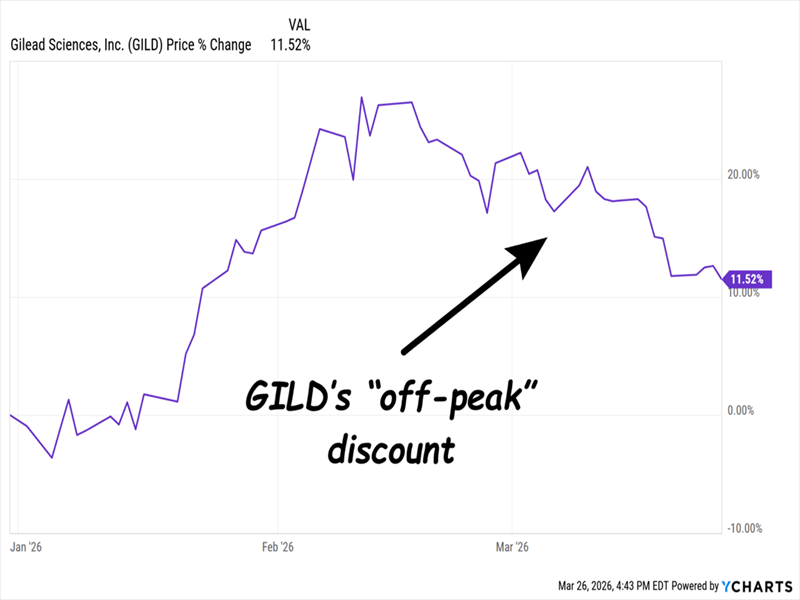
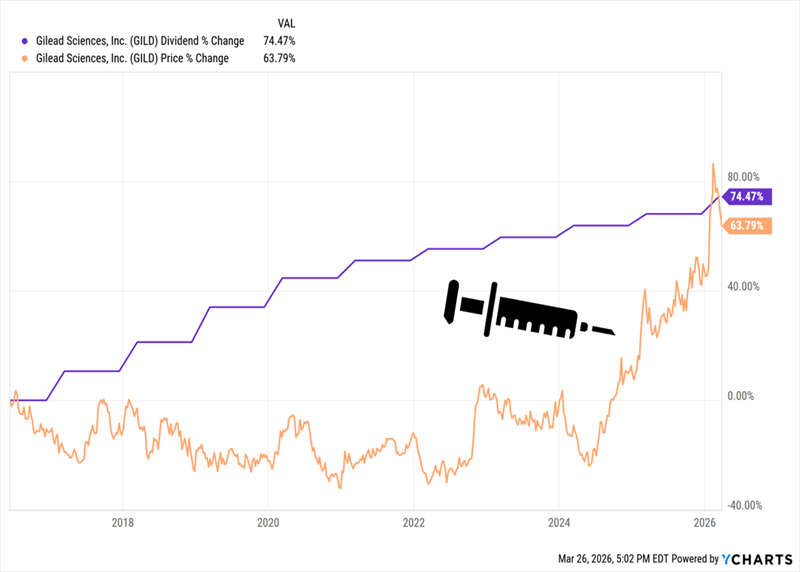
GILD: Another “Stealth” AI Play
Gilead is just as insulated from the Middle East as WM, and its AI connection is stronger.
That’s because AI is poised to shave a lot of time off of drug development—as much as six years, according to some studies.
That’s a lot more time for companies to profit off a drug before generics move in. Companies can also use AI to game out new treatments in computer simulations, letting any potential failures happen there, not in the middle of a pricey FDA trial.
How do we play this shift? We look for drugmakers with strong pipelines. This sector is also a great place to bargain-hunt because it was hammered last year, first by worries about RFK, Jr. at HHS and then by tariff fears.
My take? AI gains are going to way more than offset these worries.
Which brings me to Gilead Sciences (GILD), which we last discussed a month or so ago. It was a good deal then, and it looks better now. That’s because, like Waste Management, GILD has gained this year, while pulling back since the start of hostilities, to the tune of around 7% as of this writing.
Middle East Situation Tees Up Another Shot at GILD
That’s overdone: Gilead focuses on oncology and HIV treatments that generate predictable revenue, and its pipeline is loaded: 25 treatments in Phase 1 trials, 13 in Phase 2 and 15 in Phase 3.
GILD isn’t afraid to put its cash on the line, either: Last year, it spent $5.7 billion, or almost 20% of revenue, on R&D. With AI, it’ll be able to further “de-risk” that spend, while giving itself more treatments to test (and potentially push through to market).
No doubt Gilead’s efforts will be quarterbacked from the new 180,000-square foot AI-enabled research center it started building at its California HQ late last year.
Which brings me to the dividend: Like Waste Management, Gilead shares look uninspiring from a current-yield standpoint, at around 2.7%. But there’s something interesting happening under the hood here:
GILD’s Dividend Magnet Gets a Shot in the Arm
As you can see above, after lagging the payout for the last three years, the stock has nearly caught up. Moreover, its latest dividend hike was bigger than usual: $0.03 instead of $0.02.
An extra penny? Sounds small, but it is a 50% hike. There’s reason to believe more are on the way (beyond the AI bump). For one, in the latest quarter, free cash flow jumped 10%, to $3.1 billion, easily covering the $1 billion in dividends (and $230 million in buybacks) the company kicked out.
Finally, GILD trades at a reasonable 15.7-times forward earnings, even with its latest jump. That shows the market still hasn’t caught on to the AI-driven potential here.