
Income to date £8,013.00. Although the SNOWBALL is ahead of this year’s target, do not scale to reach a year end figure, as the total contains a special dividend that may not be repeated next year.
Cash for re-investment £347
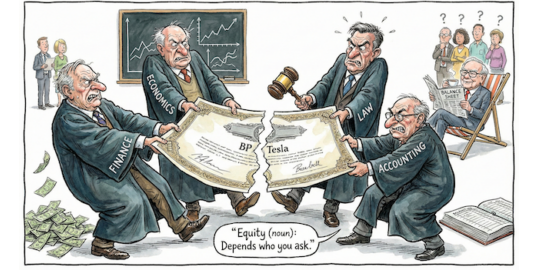
Investment Trust Dividends
Income to date £8,013.00. Although the SNOWBALL is ahead of this year’s target, do not scale to reach a year end figure, as the total contains a special dividend that may not be repeated next year.
Cash for re-investment £347

TwentyFour Select Monthly Income Fund Limited
(a non-cellular company limited by shares incorporated in the Island of Guernsey under the Companies (Guernsey) Law 2008)
Re: Dividend Announcement
The Directors of TwentyFour Select Monthly Income Fund Limited (“SMIF”), the listed, closed-ended investment company that invests in a diversified portfolio of credit securities, have declared that a dividend of 0.5 pence per share will be paid, in line with the Prospectus, representing the regular monthly targeted dividend for the financial period ended 30 June 2026 as follows:
Ex-Dividend Date 16 July 2026
Record Date 17 July 2026
Payment Date 31 July 2026
Dividend per Share 0.50 pence (Sterling)
Given the ongoing interest rate environment and volatility in the global markets, the Directors have given careful consideration to the Company’s projected income for the year against their assessment of risks currently affecting the markets and those inherent in achieving its target dividend payment of 6 pence per share per annum. Based on this analysis the Directors believe that dividends payable in respect of the year ending 30 September 2026 are likely to be in excess of 6.5 pence per share.
Pair trading is where you split your capital between two Trusts, both that pay a dividend but the first Trust where you hope to make a capital gain and the second Trust where the income is given priority but still with the chance of a modest capital gain. The blended yield remains at 7% or above.


You still receive dividends for re-investment as you wait to see if your stock picking was correct.

2 Monthly Dividend Stocks I’d Buy for Steady Cash Flow
Two dividend stocks are ‘strong buy’ options for investors seeking steady cash flow every month.
Posted by
Christopher Liew, CFA
Published July 8
Dividend stocks are tangible passive-income assets thanks to the stock market. Many retirees fund their living and other expenses with dividend income, while keeping the capital intact. Most publicly listed Canadian companies pay quarterly dividends, although a select few distribute payouts monthly.
My “buy now” monthly dividend stocks for steady cash flow are Bird Construction (TSX:BDT) and RioCan (TSX:REI.UN). There are compelling reasons why these dividend payers are buying opportunities and worthy of consideration.

Yield chasers will not pick Bird Construction for its monthly payouts. However, this industrial stock offers a total return package in 2026, not to mention a long growth runway. At $64.85 per share, current investors delight in the market-crushing 129.7% year-to-date gain on top of the modest 1.3% dividend.
Had you invested $7,000 at year-end 2025 ($28.24 per share), your money would be worth nearly $16,074 today. Note that BDT is a 2025 TSX30 winner, the flagship program highlighting Canada’s 30 top-performing stocks. It ranked 17th and is likely to join the prestigious list again this year. The total three-year return is plus-753.5%, representing a 104.4% compound annual growth rate (CAGR).
This $3.7 billion construction and maintenance company has become a dominant player in the country’s infrastructure and industrial landscape. It serves all major markets, providing comprehensive construction services and innovative solutions.
One Bird platform was launched as the centrepiece of its 2025–2027 strategic plan. Bird uses its own workforce and equipment to have direct control over project schedules and quality. It also promotes collaboration among internal teams to mitigate against industry-wide labour shortages.
In Q1 2026, construction revenue and net income grew 9% and 21% year-over-year to $783.4 million and $11.4 million, respectively. Notably, the backlog of contracted work rose 5.8% to over $5.4 billion versus Q1 2025. Teri McKibbon, President and CEO of Bird, said, “Record contracted backlog and a sizable pending backlog provide clear visibility into future activity.”
RioCan offers predictable income delivery to investors. The retail-focused real estate investment trust (REIT) boasts highly stable rent collection from resilient, necessity-based tenants such as grocery chains, value retailers, and pharmacies. Also, at $22.86 per share, REI.UN outpaces the TSX, up 25.7% year-to-date versus plus-11%. If you invest today, the dividend yield is 5.1%.
According to this $4.7 billion REIT, its productive retail core assets and future-focused platform will drive durable growth and lasting value to shareholders. The densely populated, supply-constrained urban markets also provide structural market advantages. Around 86% of RioCan’s 167 properties have a grocery component.
The committed commercial and retail occupancy rates at the end of Q1 2026 were 97.9% and 98.6%, respectively. RioCan reported a blended leasing spread of 25.8%, the highest to date, compared to 17.5% in Q1 2025. Meanwhile, portfolio investments and development spending are ongoing. RioCan expects cash NOI to grow by at least 3% annually after 2027, primarily supported by contractual rent steps and positive leasing spreads.
The pairing of Bird Construction and RioCan REIT creates a formidable monthly cash-flow engine. You get total-return power, too – the best of both worlds – with capital growth alongside the dividends.

Brett Owens, Chief Investment Strategist
Updated: July 8, 2026
In the working world, paychecks show up every two weeks. Or at least, every month. Which keeps up with the pace of monthly bills, charges, and expenses.
In the stock market world, payouts (dividends!) arrive every quarter. That’s 30 days in between bills, but a full 90 days spanning divvies.
Hence the appeal of monthly dividends. These management teams know that the investors who hold their stock are here for the payment. It’d better show up every 30 days, and it’d better be the same amount. No cuts allowed.
Problem is, some of these monthly payers are writing checks their business can’t cash. So let’s “audit” the last decade of receipts from the six biggest monthly payers in America. We’re asking two questions:
Here’s the list, along with a spoiler: half of these monthly dividend companies couldn’t keep the checks coming for a full decade.
The 6 Biggest Monthly Dividend Payers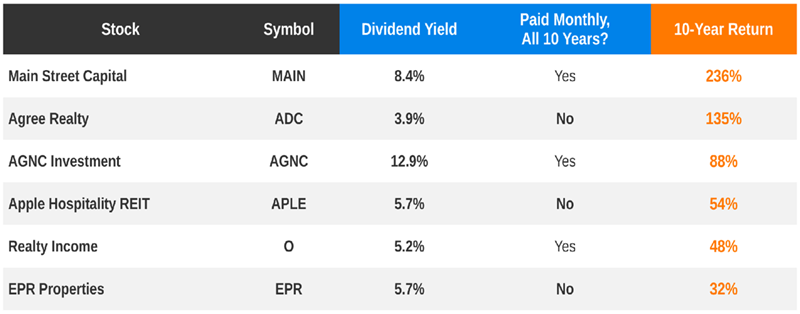
Why the focus on 10-year total return when we are here for the dividends? Because we’re not interested in a melting share price! When we retire on dividends we want our principal to stay intact (or, even better, to appreciate).
As you can see this is not a “close your eyes and buy” shopping list. We have some problem children. To name names, landlord EPR Properties (EPR) was a compelling buy for retirees. It collects rent checks from “experience venues” focused on activities like Topgolf and ski resorts. Younger generations spend their money on experiences versus collecting “things” so, perfect, right?
Kind of—until 2020 came along! The world shut down in March and by May, EPR had suspended its monthly payout. The “temporary freeze” ended up lasting fourteen months because it took a while for the world to reopen.
Then we have the “other Apple,” Apple Hospitality (APLE), a hotel landlord whose roughly 220 old properties fly the Marriott and Hilton flags. Business travel is a big driver of APLE’s business and that came to a halt in March 2020. And likewise, its monthly payout skidded to a stop!
When APLE resumed payments in March 2021, they were not every month. They were quarterly, and even then, only a penny per share. The monthly check didn’t return until March 2022—two full years after it vanished.
Agree Realty (ADC) delivered the second-best total return in our audit, 135% over the 10-year period. More than a double, through rents from the Walmarts and Tractor Supplys of the world.
Agree is new to the monthly game, though. It paid a quarterly dividend until January 2021, when its marketing team flipped to a monthly payout, which Agree has paid on time ever since. Five of the ten years it’s been paying the monthly—but hey, let’s note it’s a recent convert to Monthly Land.
Realty Income (O) deserves its own line. It literally trademarked “The Monthly Dividend Company,” and to its credit, it has dished checks every 30 days for decades. Problem is, a 48% total return over an entire decade is sort of terrible!

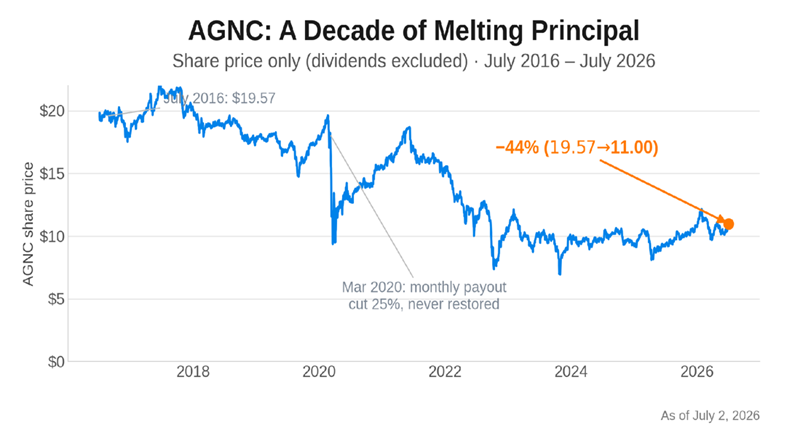
AGNC Investment Corp (AGNC) is quietly another dog, even though it always pays a generous headline yield. And monthly, too! So what’s not to like?
The not-so-great total returns, that’s what.
The company is a mortgage REIT, which means it buys mortgages. These are relatively safe mortgage-backed securities from government agencies like Fannie and Freddie, so there’s not a big problem there. The issue is that these mortgage bonds don’t pay a lot of money, so AGNC “levers up”—it borrows to buy more to increase its income. Then money is too expensive and this eats into AGNC’s profitability.
In March 2020 AGNC chopped the monthly payout from $0.16 to $0.12—and never restored it. This stock is more of a breakfast beer than a long-term holding. There’s a time and a place, but you don’t want to make a daily habit out of it. Investors who held over the past decade earned just 88%, which isn’t very good—it means AGNC compounded at only 6.5% per year. This stock dishes a monthly dividend of 12.9% and loses nearly 6% per year in price. Not ideal!
The monthly champion is a favorite of ours here at Contrarian Outlook, business development company (BDC) Main Street Capital (MAIN). Main was early on the monthly train, paying its divvie every single month (without a cut!) since its 2007 IPO.
And MAIN grew investors’ wealth, too. The shares themselves are up 59% over our decade, before a single dividend. Add the payout and you’re at 236%, the top of our audit table.
What makes MAIN the bluest of BDC blue chips? Two engines instead of one. Most of its competitors simply lend money and collect interest. MAIN lends and takes equity stakes alongside the debt.
Make no mistake: Management is bullish. It just declared its 19th consecutive quarterly “bonus” dividend—that’s on top of the regular monthly payout, which it raised 4% this year. That adds up to an 8.4% yield, including special payouts. And it teased another likely bonus for September! And for those of us paying strict attention to net asset value (NAV), there has been no blip whatsoever. MAIN’s NAV grew to a record high.
Here’s another great thing at MAIN. Insiders own 3.8% of the company, roughly 3.7 million shares. That’s unusual and high for a BDC. They run the place like they own it, because… they do!
So… should we run out and buy MAIN? Well, we need to be careful. There are private credit fears in the market that we must consider before piling into MAIN, or any monthly dividend. Let’s not buy blindly and end up with an undercover dog like AGNC!

When you start to use your Snowball to pay your bills, the only consideration is, how secure is the dividend ? Everything else is secondary to your decisions.
Story by Sam Shaw
Investors are navigating uncertain times with confidence© Getty Images
There’s an age-old investment adage that promotes the value of spending time in the market as opposed to trying to time the market.
Unless you’ve got a crystal ball that tells you exactly when certain markets or asset classes are going to rise or fall, you’re probably better off investing smaller amounts on a regular basis, referred to as pound cost averaging. This smooths out any highs and lows, allows you to pay less for your investments on average and can make the journey less volatile, if indeed that’s your desired experience – some investors may enjoy the thrill of trying to time market highs and lows with a lump sum.
Behavioural finance experts often suggest that as humans, we’re predisposed to certain biases, including selling our investments when performance starts to drop off, despite all the expert evidence telling us not to do that; it just crystallises any losses instead of giving your investments a chance to recover.
That said, investor confidence is at its highest in seven years despite a year defined by geopolitical instability, global trade tensions and market uncertainty.
An annual study of investor behaviour and sentiment from research and communications businesses AML Group and The Nursery Research & Planning, The Investor Index 2026, showed investor confidence reaching a new high.
“What’s particularly interesting is how normalised uncertainty appears to have become for investors,” said Nicola Wright, insights director at The Nursery Research & Planning.
“Confidence is no longer closely tied to calm market conditions. Investors seem increasingly comfortable making decisions in a world where disruption and volatility are seen as part of the backdrop rather than temporary events.”
Several reasons are likely feeding that confidence, according to Jason Hollands, managing director at investment platform Bestinvest.
These include overplayed concerns that the US was facing a recession (which has not materialised) and markets (being forward-looking) appearing to discount the risk of the Middle East conflict as temporary, despite it lasting longer than many had first expected. He believes the over-riding reason behind many investors’ optimism is around AI and the exceptional levels of capital expenditure being ploughed into the sector
Investing during uncertain times
Confidence is informed by several factors, including attitude to risk, life stage and level of experience and the amount of money you have.
The survey found 84% of investors (defined as having £10,000 or more invested) near or in retirement feel confident their savings and investments will be sufficient. Confidence is also higher among those already retired, as opposed to those in planning stages, and among those with more than £250,000 invested.
While the index showed UK investors were putting their money where their mouths were – 50% increased their investment amounts compared with last year while 40% maintained the same levels despite an uncertain backdrop.
That faith in the market is supported by a willingness to pay a premium for more likelihood of returns, a priority alongside decent track records and user-friendly products.
The choices UK investors are making also indicate optimism, favouring equity funds on the whole, with a rising demand for exchange-traded funds (ETFs). In keeping with regular savings strategies, considering a diversified, long-term approach – such as looking at reliable large caps, high-quality fixed income and some uncorrelated real asset exposure – should help many investors, whatever their time horizon, weather any storms.
Hollands said the danger of buoyant markets is the risk of overconfidence or being swayed by casual conversations with people ‘down the pub’.
“A lot of DIY investors start off enthusiastically but over time their interest wanes and they tend to forget about their portfolio,” he said.
Asset allocation – checking if any position sizes need rebalancing to bring the overall investments in line with your intended risk profile and preferences – is something many self-directed investors tend to overlook. Many get excited about fund or stock ideas rather than looking at the bigger picture, he added.
“Try not to over-react to the last thing someone told you but also make sure you’re reviewing your portfolio at least a couple of times a year, at the same cadence. Having a well thought-through asset allocation is really important, which can then anchor you to making better decisions.”
Intenders, perhaps unsurprisingly, are more cautious. The Nursery and AML define this cohort as those with over £10,000 in savings or over £2,000 in savings and an income over £40,000 but also likely to invest in the next two years. These people are keen to invest but still waiting for a ‘trigger’ event.
Tending to listen to banks, family and friends rather than professional advisers, they are more anxious across the board compared to investors. They see property and savings as safer bets than stocks and shares, with fear of loss and risk aversion their main barriers to getting started.
Of this group, 41% worry they will lose money and 37% say it feels too risky. Yet 44% say low-risk options or better knowledge would get them over the line.
“One of the main reasons that a lot of people who’d like to invest don’t do it is they’re nervous about putting their money in at the wrong time, and then suddenly seeing a significant drawdown in the value of their investment. That can stop them investing full stop,” explained Hollands.
He said the way to overcome that was to take the pound cost averaging approach.
“By just investing a little often regularly, it takes the emotion out of it and also means that across a year, you can expect to smooth out some of the ups and downs that you see in the short term.”
He also urges even experienced investors to consider the benefits of this approach – it’s not just for beginners.
Bestinvest is seeing novice investors increasingly choose readymade portfolios rather than trying to build their own from scratch, selecting funds themselves.
Readymade portfolios are essentially multi-asset funds designed to cater to a range of risk profiles, which have become common across most DIY investment platforms, which have evolved their offerings to serve customers of all levels of experience.
“Readymade portfolios provide inexperienced investors with effectively a ‘one-stop shop’ managed investment solution, through a diversified selection of underlying funds selected by a portfolio manager and an asset allocation approach that is periodically rebalanced to stay in line with the risk profile,” said Hollands.
He also said that passive funds had become more popular, with novice investors increasingly putting relatively small amounts via regular savings into global tracker funds.
One way to invest, is to re-invest your dividends based solely on the yield available in the market at the time.
Another is to add new capital to your SNOWBALL into short term gilts held to maturity or money market accounts, then invest those funds into your Snowball after markets have fallen. You can only get into any share at it’s low by luck or your have a De-Lorean in your garage.

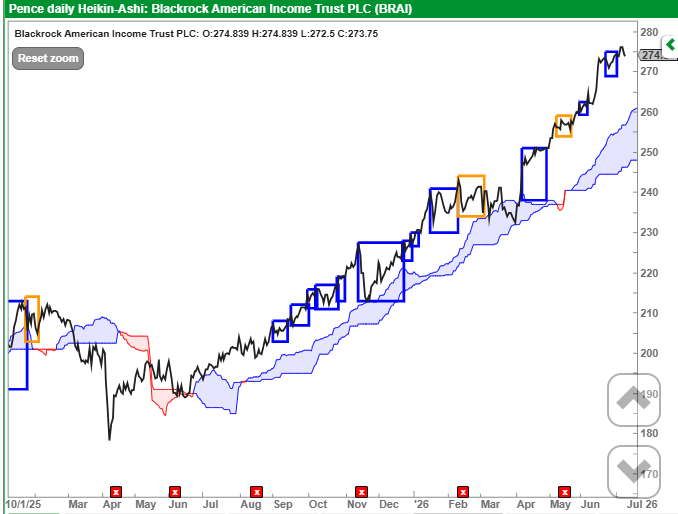
You are interested to pair trade BRAI as you know the dividend is going to be reset to 6% of NAV.
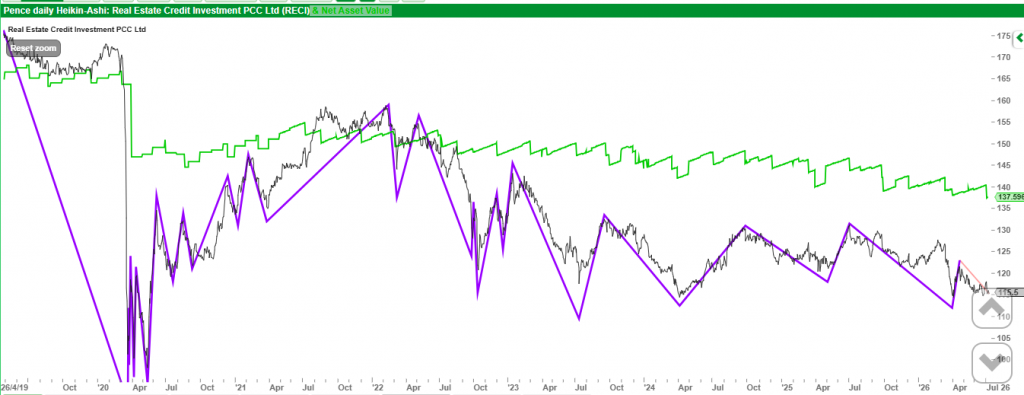
I obviously have copied a good example but the rules remain the same.
Be hopeful if the price is above the cloud.
Be fearful when the price is below the cloud.
You add capital when the price moves above the cloud, whilst keeping everything crossed it’s not a market slam dunk and the hardest part do nothing.
If you are sitting on a large gain you could take out some ‘profit’ and re-invest in a higher yielder.

| gullfossiceland gullfossiceland.comx iid8kumn@outlook.com 45.196.221.68 | Interesting concept, though I’ve always been a bit skeptical about passive income claims until I see real numbers. Have you personally been using this RECI system for a while, and if so, how long did it take to see consistent returns? I’m curious about the risk level compared to something like dividend stocks. |
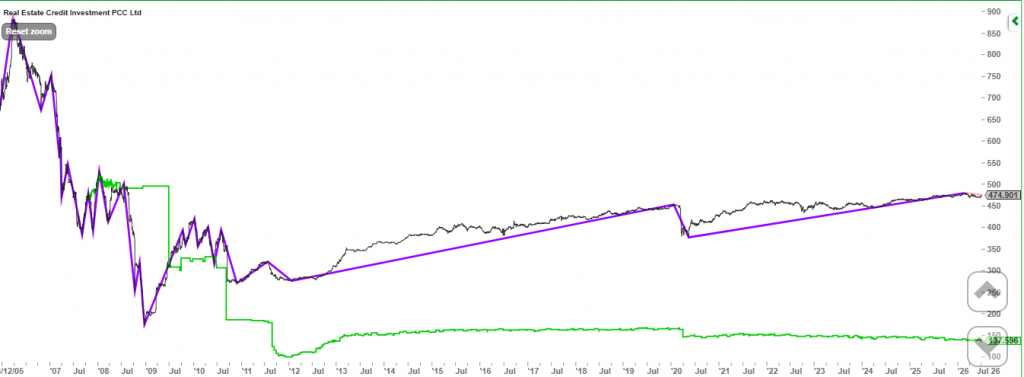
TR chart, where anyone who bought when the Trust started trading are below the water line.
The covid crash, where it was assumed that companies would stop paying the interest on their loans, even though the loans were secured against property.
As always.

The SNOWBALL has traded the trust with a profit of £843 and £829.
The SNOWBALL owns RECI for the regular dividend to re-invest back into the portfolio. Current position a loss of £95.00 including the earned dividend but not received.
Reliable dividend that isn’t keeping up with inflation, so buying the yield is important.
Unlikely to be a capital gain until interest rates and bond yields fall.
For the SNOWBALL it’s a hold and re-invest the dividends back into the portfolio but it’s unlikely to be at RECI’s current yield.
7th July 2026 09:41
by Douglas Chadwick from ii contributor
This content is provided by Saltydog Investor. It is a third-party supplier and not part of interactive investor. It is provided for information only and does not constitute a personal recommendation.
After a strong equity rally during April and May, June was more mixed. Only half of the major global stock market indices that we track each week made gains.
The star performer was the Japanese Nikkei 225, which went up by 5.6%, adding to the 11.9% that it had made in May and the 15.3% in April. At the opposite end of the spectrum, the Hong Kong Hang Seng fell by 8.9%.
Closer to home, the FTSE 100 ended the month up 0.8%, while the more domestically focused FTSE 250 fell by 1.8%. Across the Atlantic, the Dow Jones Industrial Average gained 2.5%, while the S&P 500 fell by 1.1% and the Nasdaq dropped 2.8%.
However, the performance of the UK-domiciled funds was more encouraging, with around three-quarters making headway over the month. Most of the Investment Association (IA) sectors also made positive returns in June. Of the 33 that we regularly monitor, 28 posted one-month gains.
Leading the way was the new Healthcare & Biotechnology sector, up 8.2%.
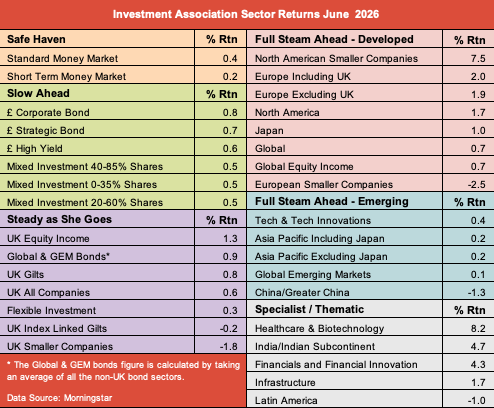
Past performance is not a guide to future performance.

Brett Owens, Chief Investment Strategist
Updated: July 7, 2026
The crowd is still way too worried about interest rates—and their fear is handing us a shot at two stout monthly dividends (yielding up to 11.9%) on the cheap.
We can thank new Fed chair Kevin Warsh for ginning up the panic here. Because he was appointed by President Trump, the suits expected Warsh to push for lower rates right off the hop. Instead, the new Fed chief has gone full Dirty Harry on inflation.
Investors are buying it. But they’re already on the wrong side of the story.
Oil has plunged to around $68 a barrel. And the job numbers for June, out last week, were soft, with the number of new gigs around half of what it was expected to be. That could be a sign of things to come as AI spreads across the economy, providing a sweeping level of automation to white-collar work. Very deflationary.
In the 1990s, the Internet acted as a similar “deflator” on prices. The move from snail mail to email and from fax machines to web browsers made businesses wildly more efficient, which kept a lid on consumer prices.
The bottom line here is that rates will fall. Which brings us back to Warsh.
Even though the president has given him a long leash for now, I expect it to shorten fast when rates and inflation start to ease. When push comes to shove, Warsh will choose self-preservation.
As the wind shifts toward lower rates, I expect the discounts on the two monthly dividend CEFs we’ll discuss next to speed toward par—and possibly beyond.
Monthly Dividend Pick No. 1: A Diversified Pick With a 7.8% Dividend
We’re going to start with a fund holding high-yield stocks and handing us a rich 7.8% dividend (yes, paid monthly).
That would be the BlackRock Enhanced Equity Dividend Trust (BDJ), which is nicely set up for pretty well any market. For starters, its portfolio is balanced among stock sectors. Tech is the biggest slice, but even so accounts for a reasonable 18% of assets, followed by financials (15%), industrials (14%) and healthcare (13%).
Then BDJ adds a dash of global exposure, with about 11% of assets outside the US, in stable countries like the UK, South Korea and Canada.
Let’s get to what we really want to know about here: the (monthly!) dividend, which is not only hefty but has risen a stout 32% in the last decade (not including special dividends—the spikes in the chart below):
Source: Income Calendar
The fund aims to hold at least 80% of its portfolio in dividend-paying stocks. Right now, its holdings include Amazon.com (AMZN), as well as companies like CVS Health (CVS) and Citigroup (C), both of which stand to gain as AI boosts their efficiency.
BDJ is also seeing gains from FedEx (FDX), as the company cuts costs and moves away from lower-margin work (like Amazon deliveries). BDJ also holds Western Digital (WDC), which has soared on booming demand for chips and storage.
The fund further bulks up its dividend by selling options on its holdings. That brings in extra income and further shores up the dividend. It’s a strategy that works particularly well in volatile markets.
Even so, investors have tossed BDJ aside. As I write this, the fund’s discount to net asset value (NAV, or the value of its underlying portfolio) sits at 6.7%—though it looks like it’s carving out a bottom here, suggesting its next move could be toward par.
BDJ Is Cheap—and Its Discount Has Momentum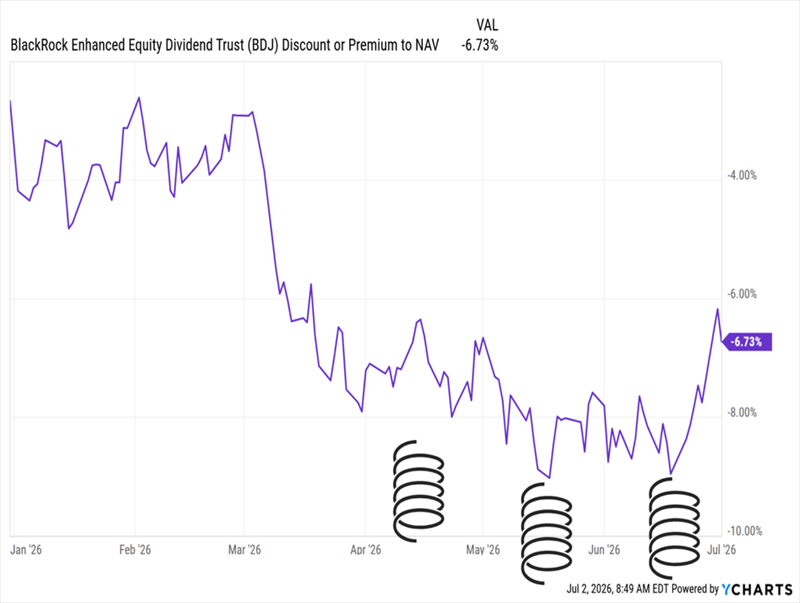
That’s a great setup to move into this well-constructed fund. The bonus? Since it pays dividends monthly, a buyer today won’t have to wait long to collect their first payout.
Monthly Dividend Pick No. 2: An 11.9% Dividend for 94 Cents on the Dollar
Now let’s swing over to bonds, where another fund from BlackRock stands out: the BlackRock Multi-Sector Income Trust (BIT). (That’s par for the course, as BlackRock is one of the biggest players in the CEF space.)
A key thing to note with BIT is the long average maturity on its credit assets: around 13 years. That’s important because longer-duration bonds do better when rates decline, as they’re more attractive than new (and lower-yielding) debt.
Moreover, BIT’s effective duration is around four years. That’s enough to position it for gains on lower rates without taking on too much risk if rates rise.
Plus, any rate-rise risk is more than priced into the fund’s 6.1% discount to NAV. That’s a level we haven’t seen since 2022, and then only briefly. And back then, the rate setup was the opposite of today’s: Inflation soared to 9%, and rates shot higher in response.
BIT’s “Back to 2022” Sale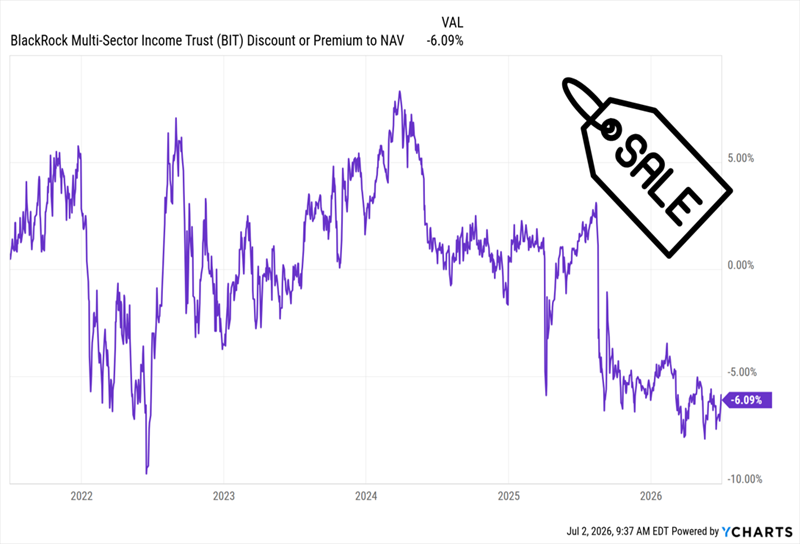
The fund’s drop in valuation looks overdone here. And if you look at the right side of that chart, it looks like that discount is carving out a bottom, similar to what’s happening with BDJ.
On the performance side, this fund has been around since 2013 and has more than doubled the return of the benchmark US high-yield bond ETF, the SPDR Bloomberg High Yield Bond ETF (JNK), since then.
BIT Laps High-Yield Bonds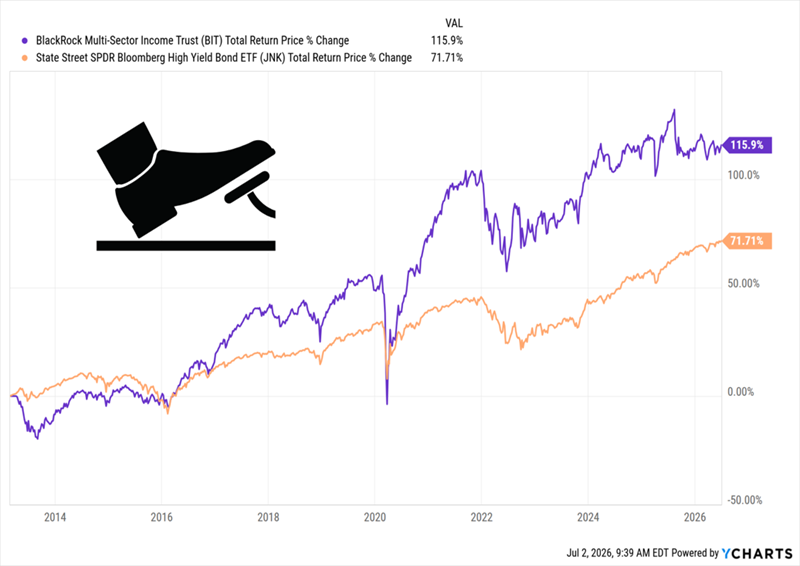
Reinvested dividends drove that return, thanks to BIT’s monthly payout, which has not only held steady through the tumult of the last decade (including the aforementioned 2022 bond meltdown)—it’s grown.
Source: Income Calendar
That strong payout record is likely to continue. And in the longer run, a move toward lower rates would act like a vice on the discount, forcing it to close—and help propel the fund’s price higher as it does.

© 2026 Passive Income Live
Theme by Anders Noren — Up ↑
