hujantoto Hello there! Would you mind if I share your blog with my twitter group? There’s a lot of folks that I think would really appreciate your content. Please let me know. Cheers
££££££££££
Yep, no problem with that. If the content is from another source it would be polite to include their name.
The Company’s aim remains to provide investors with an attractive and sustainable dividend that increases in line with RPI while preserving capital on a real basis. In each of the first 10 years since listing, the Company increased its dividend target by RPI and for 2024, the 11th year, the Company increased its target significantly above RPI to 10 pence per share. The Company paid an underlying 2.5 pence per share with respect to Q1 2024 and has declared a dividend of the same amount per share with respect to Q2 2024, giving a total of 5 pence per share for the period. The Company also paid an additional £29 million of dividends to shareholders in February, increasing the total dividend to 10 pence per share for 2023.
In line with the current higher interest rate environment, the Company forecasts a 10 per cent return to investors on NAV (net of all costs). This includes reinvestment of excess cash generation (dividend cover) in addition to the dividend yield. Since listing, the Company has reinvested £935 million of excess cash generation and paid £1,074 million of dividends.
£££££££££££
Price was 165p dividend 10p yield 6% Price now to buy 142p yield 7% Now a belt and braces Trust. As always timing and then time in. 7% compounded doubles your hard earned in ten years.
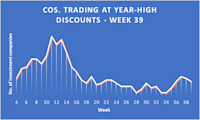
The number of investment companies trading at 52-week high discounts fell to just nine. It wasn’t a good week all round though, one sector saw all five of its constituents set new discount highs for the year.
By Frank Buhagiar• 30 Sep
We estimate there to be nine investment companies that saw their share prices trade at 52-week high discounts over the course of the week ended Friday 27 September 2024 – two less than the previous week’s 11.
It’s not often all funds in one sector see their share prices set new 52-week high discounts to net assets on the very same day. But that’s what happened with the five-strong Japan sector. True, the share prices of the five investment companies – Baillie Gifford Japan (BGFD), CC Japan Income & Growth (CCJI), Fidelity Japan (FJV), JPMorgan Japanese (JFJ), Schroder Japan (SJG) – had been bobbling close to the year-high marks for some time now, but all saw their discounts set new highs for the year on Friday 27 September 2024.
Of the five, only SJG released results this week but a +21% NAV total return for the full year hardly cause for concern, more like celebration. The reason for the sector-wide discount doldrums have a political driver. After Japan’s markets closed on Friday, former defence minister, Shigeru Ishiba, narrowly defeated Economic Security Minister, Sanae Takaichi, in the Liberal Democratic Party’s leadership contest. That means Ishiba becomes Japan’s next prime minister.
With Ishiba considered to be on the hawkish side when it comes to monetary policy, expectations are that he will likely not stand in the way of further interest rate hikes as the Bank of Japan looks to normalise monetary policy after years of tackling deflation. Cue the election result causing the yen to gain more than 1% against the dollar and stock futures to sink, indicating a selloff in equities lies ahead when markets reopen on Monday. But with UK markets still open, the share prices of all five Japan-focused investment companies were always likely to come under pressure, and so it proved.
Fidelity Japan FJV19.53%JapanSchroder Japan SJG14.69%JapanBaillie Gifford Japan BGFD16.79%JapanCC Japan Income & Growth CCJI11.87%JapanJPMorgan Japanese JFJ14.50%Japan
Defensive sectors come to the fore even as investors celebrate Fed rate cut
Russ Mould Thursday, September 26
“Investors continue to welcome the first interest rate cut from the US Federal Reserve in four years, and a big one at that, in the view that the central bank is doing its best to keep American economic growth firmly on track,” says AJ Bell investment director Russ Mould.
“However, the need for a half-point cut may be tempering enthusiasm slightly, as it does suggest the Fed is concerned about the risk of a greater-than-expected slowdown, and this may be why defensive sectors are doing so well Stateside so far in 2024.
“The S&P 500 has gained just 1.6% since 10 July, which does not entirely smack of an imminent inflationary boom, and it may pay to dig beneath the headlines to see what investors are really thinking.
“The market may not always be right, but its views must be respected and so it is always worth paying attention to what the market is saying, and there will be many adherents to the view that ‘a bad stock in a good sector will outperform a good stock in a bad sector,’ at least in the near term.
“In this context, the US stock market’s response to the long-awaited reduction in interest rates from the Federal Reserve on Wednesday 18 September has been fairly textbook. Cyclical sectors such as Consumer Discretionary, Materials and Industrials have done well, as have so-called ‘bond proxies’ such as Telecoms and Utilities, as their yields become relatively more attractive as returns on cash and bond yields recede. Defensives such as Consumer Staples and Health Care have done less well, although pharmaceutical firms’ traditional role as a pre-presidential election punch bag for vote-hungry candidates could be an additional reason for the latter sector’s muted showing.
Source: LSEG Refinitiv data, as of 25 September 2024, based on S&P 500 sectors
“Tech stocks have continued to do well, and they remain the best performer in the year to date, buoyed by enthusiasm for the Magnificent Seven and all things related to artificial intelligence.
“However, the next best performer is Utilities, with Telecoms close behind.
Source: LSEG Refinitiv data, as of 25 September 2024, based on S&P 500 sectors
“This could be down to the possible boost to demand for electricity from data centres that run the Large Language Models behind artificial intelligence and store vast swathes of digitised information and content. It could be because utilities are seen as so-called ‘bond proxies,’ and a sector that usually does well when interest rates (and bond yields) are falling, as this makes the yield on utility stocks seem more attractive on a relative basis.
And it could be because investors are subtly looking for a haven, and industries where demand is relatively predictable and not too sensitive to the wider economy, just in case an unexpected slowdown is coming around the corner in the US.
“The long-term chart for Utilities’ performance relative to the S&P 500 remains ugly, but it is worth noting how the sector’s defensive, economically insensitive characteristics enabled it to outperform during 1990-92, 2000-02 and 2007-08, just as the US entered a recession or encountered some form of financial market meltdown, or both.
Source: LSEG Refinitiv data
“The presence of Financials among the leaders offers some reassurance, as does how every US sector is still in positive territory this year, but the presence of Utilities and Telecoms in the top five is not necessarily what you would expect to see if investors were truly confident in America’s economic outlook. Weakness in Energy and Materials may not be a good sign, either, although China’s efforts to reflate could yet give them a boost, especially if the US does enjoy a soft landing, or even avoid a slowdown altogether.
“According to the official data from the Office for National Statistics, the UK is emerging from the shallow recession suffered in the second half of 2023, and this may be helping cyclical sectors like Industrials and Consumer Discretionary, even if Energy and Materials are the laggards, just as they are in the USA, thanks to commodity price weakness that could speak of nerves regarding the wider, global economic outlook.
Source: LSEG Refinitiv data, as of 10 September 2024, based on the FTSE UK sectors
“That said, Materials is the best performer in the UK since the Fed cut, perhaps boosted by monetary stimulus in America, the world’s largest economy, and the application of a fiscal boost in China, its second biggest.
“Utilities have fared less well on this side of the Atlantic, and that could be down to uncertainty over the new AMP8 regulatory cycle for water companies that begins in April 2025, especially as water and waste treatment services providers are still the subject of much public opprobrium over the quality of their services, the prices they charge and the bonuses they pay. Utilities were also the subject of windfall taxes when Tony Blair’s Labour government took over in 1997 and investors may have taken some evasive action with this year’s general election in mind.
“These trends could yet prove ephemeral, and sentiment could switch again – technology for one is unlikely to go down without a fight. If indeed summer’s ructions are the first signs of a top in the sector which, for the moment at least, peaked in mid-July there may be many attempted rallies before the bull market cracks, just as there were in 2000 when the tech bubble burst. The telling indicator back then was each rally failed to reach the prior peaks and that may be a trend to note this time around, too, although investors are unlikely to be too keen to ‘fight the Fed’ for too long, unless the monetary medicine is not enough to stave off a US slowdown and the American market’s above-trend valuation multiples prove difficult to sustain (which was exactly what happened during the downturns of 2001-03 and 2007-09, when growth and thus corporate earnings both disappointed).”
City of London Investment Group PLC ex-dividend date CT Private Equity Trust PLC ex-dividend date European Assets Trust PLC ex-dividend date F&C Investment Trust PLC ex-dividend date Finsbury Growth & Income Trust PLC ex-dividend date Life Science REIT PLC ex-dividend date Manchester & London Investment Trust PLC ex-dividend date Murray International Trust PLC ex-dividend date Pantheon Infrastructure PLC ex-dividend date Real Estate Investors PLC ex-dividend date RIT Capital Partners PLC ex-dividend date Schroder European Real Estate Investment Trust PLC ex-dividend date Schroder Income Growth Fund PLC ex-dividend date Shires Income PLC ex-dividend date
The criteria for the Snowball has been tweaked, it was previously very roughly an equal weighted amount invested in each position but has now been changed to equal income from each position.
The target is income of 1k per share, there are currently 10 shares in the Snowball, so it will take some time to achieve, although gently increasing dividends over time should help to shorten the time frame.
I’ve bought for the Snowball a further 1311 shares in SUPR which should produce total income in the next 12 months of £928.00
Next years Income Fcast is £9,120 and the Target is 10k, a yield on seed capital of 9%.
Bluefield Solar (LON: BSIF), the London listed UK income fund focused primarily on acquiring and managing solar energy assets, is pleased to announce the Company’s fourth interim dividend for the financial year which ended on 30 June 2024 (the ‘Fourth Interim Divdend’).
The Fourth Interim Dividend of 2.20 pence per Ordinary Share (September 2023: 2.30 pence per Ordinary Share) will be payable to Shareholders on the register as at 11 October 2024 with an associated ex-dividend date of 10 October 2024 and a payment date on or around 15 November 2024.
The Board is pleased to have declared full year dividends totalling 8.80 pence per Ordinary Share for the financial year ended 30 June 2024, in line with our target, compared to a full year dividend of 8.60 pence per Ordinary Share for the financial year ended 30 June 2023.
Furthermore, the Board has set a target dividend for the financial year ending 30 June 2025 of not less than 8.90 pence per Ordinary Share. This is expected to be covered by earnings and to be post debt amortisation.
SDCL Energy Efficiency Income Trust plc (“SEEIT” or the “Company”)
Interim Update Statement
The Company announces an Interim Update Statement for the period from 1 April 2024 to 30 September 2024 (the “Period”).
Jonathan Maxwell, CEO of the Investment Manager, SDCL, said:
“The operational assets in SEEIT’s portfolio are performing in line with expectations, on a consolidated basis. The portfolio is also well positioned for growth.
Two of our largest investments, Onyx, which is one of the most established providers of distributed clean energy solutions to commercial and industrial customers across the United States, and EVN, which is one of the most successful electric vehicle charging platforms in the UK, are growing fast and ahead of budget. Both platforms require further capital. Therefore, we are actively pursuing financing, co-investment and disposal opportunities to support their growth and secure value for SEEIT shareholders. Surplus capital raised will be used to pay down our Revolving Credit Facility (RCF).
Interest rate cuts in the US and UK are likely to have a positive impact on the value of SEEIT’s portfolio on a discounted cash flow basis. While this may in due course reduce SEEIT’s weighted average discount rate, we view it as prudent to materially absorb decreases in risk free rates through increases in risk premiums for the September 2024 valuation due to ongoing economic and geopolitical uncertainty.
The Board and the Manager remain highly focused on SEEIT’s share price discount to NAV, as well as keeping its gearing levels well within limits, and we continue to prioritise taking actions described below in line with the Manager’s six-point plan set out in the March 2024 Annual Report.”
Operational performance
On a consolidated basis, operational performance is generally in line with expectations. Noteworthy updates for the Period are included below.
Onyx, now the largest SEEIT portfolio investment, which provides on-site generated solar power to commercial and industrial sectors across 14 US states, continues to create and convert significant pipeline through its development activity. Onyx has already hit its 70 MW Notice to Proceed (NTP) target for the year and is on track to meet or exceed its annual Power Purchase Agreement (PPA) target. It is also on track to meet its Commercial Operation Date (COD) target for this year. COD is the point at which these new projects begin generating revenue.
EVN, the electric vehicle (EV) charging infrastructure development company, continues to see strong demand for ultra-fast EV charging stations across the UK and has successfully brought a further 3 sites operational, bringing the total to 26.
Oliva is currently performing ahead of budget, and we expect this will continue due to the successful management of the cost of gas by their in-house procurement team, maximising operating margins.
RED, one of North America’s largest district energy systems, has multiple workstreams underway, including:
· Current negotiations of tariff amendments are expected to significantly improve EBITDA performance, correcting current underperformance in part resulting from lower demand from one of its key customers. The Manager forecasts that RED will miss 2024 budget EBITDA by c.17% but considering the upcoming tariff amendments, it sees the underperformance as predominantly a short-term timing matter.
· As previously reported, Li-Cycle, an existing customer, is significantly expanding its facilities with the construction of a new hub processing centre that will increase their demand for services from RED. The additional funding Li-Cycle needs to restart construction continues to be expected before the end of 2024, as previously announced.
· Meanwhile, RED’s cogeneration project is progressing as planned and remains on schedule to come online by Q1 2025.
As announced on 25 July 2024, the Manager has successfully renegotiated the loan facility for Primary Energy, a portfolio of on-site energy recycling, cogeneration and process efficiency projects, servicing blast furnaces, including the largest steel blast furnace in North America. This includes an improved margin of 350bps over Secured Overnight Financing Rate (SOFR), down from c.425bps and restructuring the debt to improve yields for SEEIT.
Dividend
The Company is on track to deliver its target dividend of 6.32p per share for the financial year to 31 March 2025, covered by net operational cash received from investments.
If u are saving for a special occasion/reason, u have two choices.
One Deposit Account.
U can invest in either a deposit account or a cash ISA, the current problem is that interest rates are expected to fall, so your final amount returned will also fall, unless u choose a fixed date interest amount against a variable interest amount.
If u are saving for a house deposit research LISA’s.
Two. Government Gilts.
It’s a lot easier to buy Government Gilts (loans) nowdays.
The rule is, if inside a tax wrapper u can choose a higher interest amount but if outside a tax wrapper, a low interest rate with a tax free capital gain.
If we set a date 3 years from now.
Inside a tax wrapper
On the 7/12/2027 the current government will return your cash of par value £100. The next ‘dividend’ is the 7/12/24, then every six months.
U have to pay the current holder of the Gilt the interest already accrued since the last date. U should be able to work out the amount u will have at the end of 2027, 3.73% on the amount invested pa.
Outside of a tax wrapper.
Tax to pay on the nominal interest, u will not lose money as long as u hold until the maturity date. U would currently buy at £93.72 and have £100 returned on the 22/7/2027.
In this week’s Fund Monitor, another possible tie-up in the REIT sector – this time NewRiver REIT is looking to acquire Capital & Regional; and another fund considers its options on account of its size – Menhaden Resource Efficiency.
By Frank Buhagiar
NewRiver REIT Looks to Acquire Capital & Regional
New River REIT (NRR) has joined the London-REIT takeover party after announcing a possible offer for Capital & Regional (CAL). Principal terms and conditions of the potential cash and share offer have been agreed by the Board that would see NRR acquire the entire issued and to be issued share capital of CAL. In exchange for each CAL share, shareholders would receive 31.25p in cash and 0.41946 New NewRiver shares. Based on NRR’s closing share price of 74.5p on 22 May 2024 (the last trading day before the Offer Period commenced), the offer would value CAL shares at 62.5p each. That’s a premium of approximately 21% to CAL’s undisturbed closing price of 51.5p per share.
In conjunction with the offer, NRR successfully launched and completed a placing and retail offer of new shares on the same day as the offer announcement. In all, around £50 million has been raised. CEO Allan Lockhart “This successful placing to support our proposed offer for Capital & Regional further underpins our belief in the strategic rationale for the transaction.” It must have been a busy day at NRR HQ!
JLEN Environmental Assets Changes Its Name
JLEN Environmental Assets (JLEN) is no longer, at least in terms of the name. The fund is now known as Foresight Environmental Infrastructure following shareholder approval at the company’s AGM on Friday 13 September 2024. That means the ticker also changes – from JLEN to FGEN.
Menhaden Resource Efficiency Considering Its Options
Menhaden Resource Efficiency (MHN) announced, alongside its half-year results, that “it proposes to carry out, together with its advisers, a formal review of the options available to it in order to address the issues facing the Company prior to its continuation vote in 2025.” For issues, read the fund’s size, “Notwithstanding its good net asset value performance, at its current size the Company’s secondary market liquidity is relatively low and it has been unable to attract attention and demand from investors, which has led to the Company’s shares trading at a material discount to the Company’s net asset value per share.”
Numis “Menhaden Resources Efficiency has announced that it will conduct a formal review of the options for the company, given the size, low trading liquidity and wide discount. The company is due to hold its five-yearly continuation vote by the AGM in July 2025 and will provide investors with a further update ahead of that with the outcome of the review.”
Dividend Watch
City of London (CTY) has clocked up 58 consecutive years of dividend growth. As per CTY’s Annual Report. The “annual dividend grew by 2.5% to 20.60p per share, slightly ahead of UK CPI inflation, and was covered by earnings per share.” That means “Over ten years, City of London’s dividend has grown by 39.6% compared with a cumulative increase in UK CPI inflation of 33.8%.” CTY, the inflation-buster!