For any new readers, where have you been ?
There are only 3 rules.

Rule 1

Rule 2

Rule 3

Investment Trust Dividends
For any new readers, where have you been ?
There are only 3 rules.
Rule 1
Rule 2
Rule 3

I’ve bought for the SNOWBALL 5k of MRCH 864 shares. Until the current oil crisis is resolved it’s likely the price will continue to fall and the yield will rise, enabling me to buy more shares with any earned dividends. If the market bounces when the ceasefire is announced there may be a short term gain to be made.

In the future when you look at the chart, for Dividend Hero Trusts, the current time will just be another blip.

I was buying more SEIT at 40p last week at a £432m market cap, I’ve been deep diving it further too. Even taking a foray into the chattersphere. Where I find the OB is the topic of conversation.
“The OB is losing it” says one “he’s a ramper” declares another – ah the poisonous crowd in the chattersphere – “He makes broad brush estimates” and “doesn’t really understand the accounting in SEIT…. his analysis is superficial”.
I rarely visit the chattersphere but when I do I’m reminded of why I don’t.
Interesting to see that SEIT’s portfolio gross value has grown over time. There is no collapse to the valuation, compared with the share price. The assets are actually very resilient.
SEIT
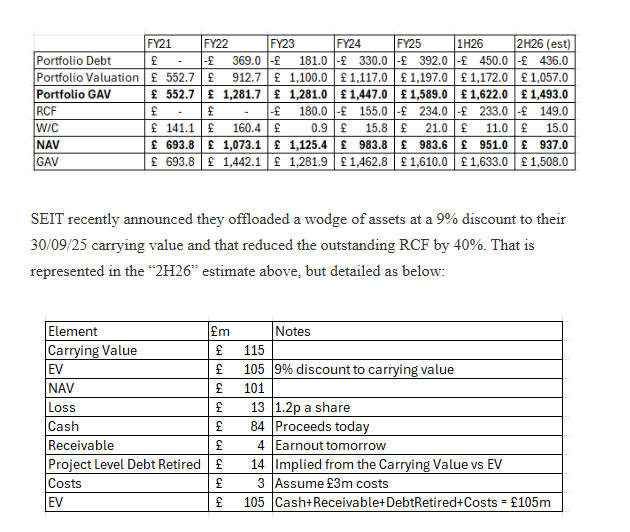
The reduction in the RCF with an interest cost of 6.4% saves over £9m interest per year.
How? £133m x 6.4% = £8.5m per annum vs the interest cost in 1H26 of £9m so £18m annualised. Are there some additional costs such as amortisation of arrangement costs in that £9m… perhaps, but £m’s per year? I doubt it.
We know that the “Big 5” are 66% of the Portfolio value in £m terms but delivered 75% of the EBITDA in 1H26 and 2H25 – and an even greater proportion in 1H25 (Oliva was a drag more recently) so losing about a quarter of the “Non Big 5” is an 6% reduction of EBITDA pro rata (25% of 25% is 6% right?), so about a -£4.5m reduction of EBITDA.
So even with costs and the discount taken into account the effect is up to ~£5m net positive for the Fund’s ongoing cash income (excluding one-off costs), implying up to 8% boost to net cash after interest costs from £43m to nearer £48m, even based on a static performance (which appears to be anything but static).
The positive news flow from Primary Energy (Nippon Steel is investing $3bn into US Steel) and Red Rochester (25% growth due to new customers) alongside Driva (Sweden) and Oliva (Spain) being beneficiaries to the current troubles for more expensive European energy there’s reasons to believe Cash Flows from the Big 5 will have grown in FY26 and will have a far brighter outlook for FY27.
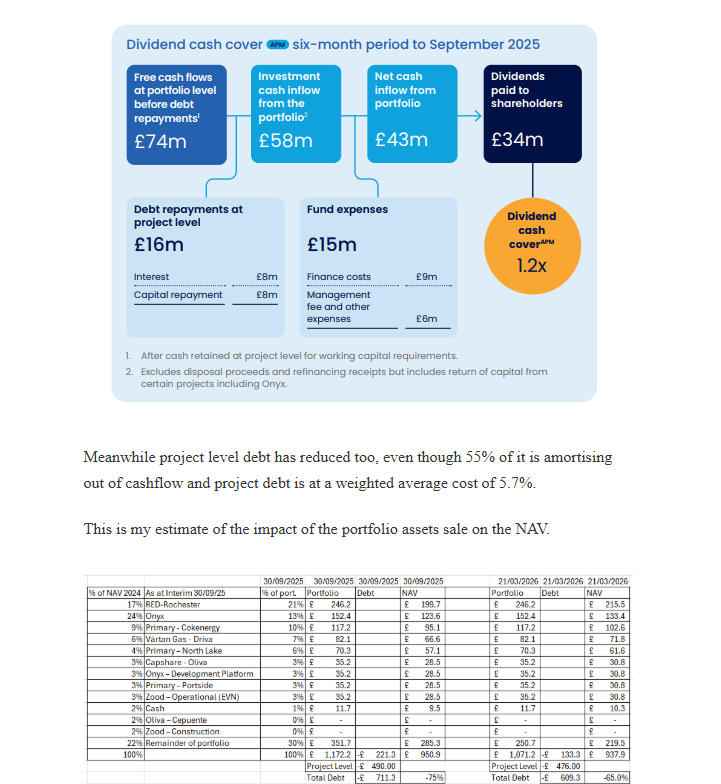
Meanwhile project level debt has reduced too, even though 55% of it is amortising out of cashflow and project debt is at a weighted average cost of 5.7%.
This is my estimate of the impact of the portfolio assets sale on the NAV.
On a pence per share you’re paying 40p a share to own about 132p of real assets less the equivalent of -56p of debt so 40p gets you 86p of net assets.
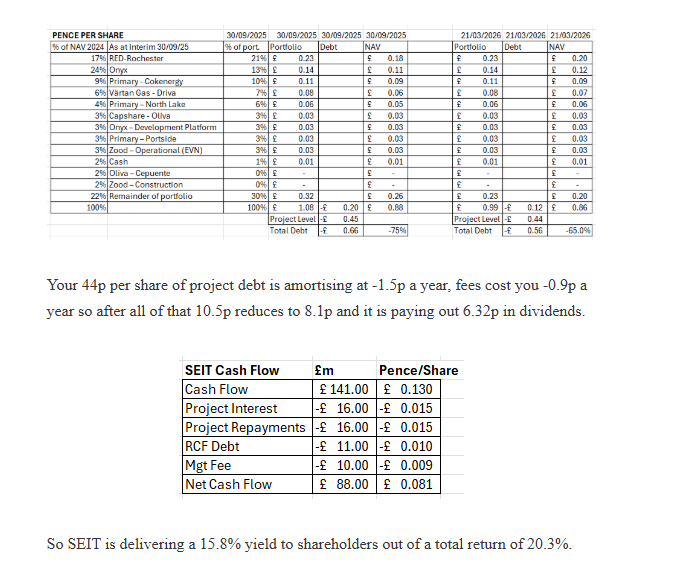
132p of real assets generate 13p of cash (historically) of which -2.5p gets paid going forwards on interest leaving 10.5p cash earnings.
Your 44p per share of project debt is amortising at -1.5p a year, fees cost you -0.9p a year so after all of that 10.5p reduces to 8.1p and it is paying out 6.32p in dividends.
So SEIT is delivering a 15.8% yield to shareholders out of a total return of 20.3%.
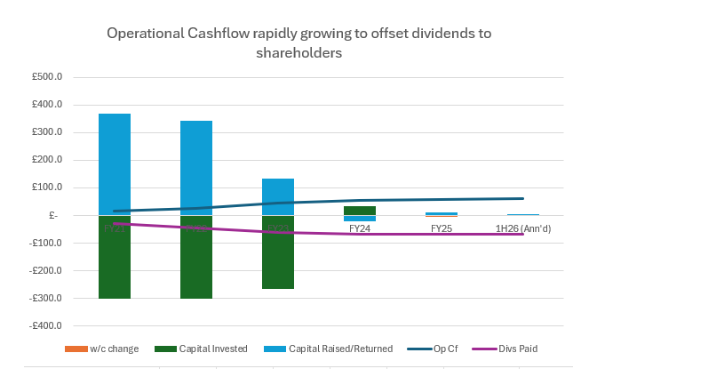
If you look at the Fund’s income and expense the growing income from holdings is apparent too. The green line shows growing dividend income. It’s true that the blue bars are reductions through fair value losses – through rising discount rates (an eyewatering 9.7%) and falling power curves.
Power Curves in 2026 are definitely rising again since the Iran conflict erupted and 65% of income is index-linked. All of that is positive for the NAV – and the attractiveness of its assets.
If you consider the growing income from the portfolio (dividend income and loan interest income) below, and then contrast that with the fair value gains and losses you can see a clear disconnect between the trajectory of each. Why do assets with a lower fair value deliver growing income? Does that actually make sense?
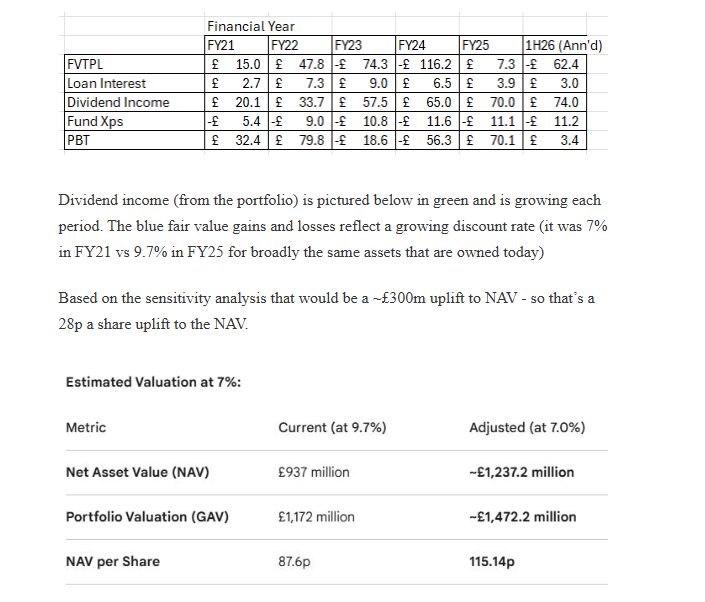
Dividend income (from the portfolio) is pictured below in green and is growing each period. The blue fair value gains and losses reflect a growing discount rate
Regards
The Oak Bloke
Disclaimers:
This is not advice – you make your own investment decisions.
Micro cap and Nano cap holdings including REITs might have a higher risk and higher volatility than companies that are traditionally defined as “blue chip”.
Thanks for reading! Subscribe for free to receive new posts and support my work.
Pledge your support
The Oak Bloke’s Substack is free today. But if you enjoyed this post, you can tell The Oak Bloke’s Substack that their writing is valuable by pledging a future subscription. You won’t be charged, unless they enable payments, and you decide to continue with a subscription.

Thursday 2 April
BlackRock Energy & Resources Income Trust PLC ex-dividend date
Finsbury Growth & Income Trust PLC ex-dividend date
Gore Street Energy Storage Fund PLC ex-dividend date
Henderson High Income Trust PLC ex-dividend date
Invesco Asia Dragon Trust PLC ex-dividend date
Mobius Investment Trust PLC ex-dividend date
New Star Investment Trust PLC ex-dividend date
Personal Group Holdings PLC ex-dividend date
Pollen Street Group Ltd ex-dividend date
Real Estate Investors PLC ex-dividend date
RIT Capital Partners PLC ex-dividend date
Social Housing REIT PLC ex-dividend date
STS Global Income & Growth Trust PLC ex-dividend date
Questor: Never forget the bond market and the ‘risk-free rate’
Russ Mould
Published 30 March 2026

Questor, The Telegraph’s investing column, takes a weekly view of the markets – what is moving them, what lies ahead and how all of this could affect your portfolios and financial goals.
It has long since passed into lore that James Carville – once a senior adviser to Bill Clinton, the former US president – said that if there was such a thing as reincarnation, he would want to come back as the bond market so he could “intimidate everybody”.
At present, investors may be paying more immediate attention to the commodity markets – especially oil and gas – but they are doing so partly because of the possible knock-on effects that higher hydrocarbon prices could have upon inflation and, in turn, interest rates – all of which eventually hit the bond market.
From the end of the global financial crisis in 2009 to Covid-19 and Russia’s attack on Ukraine at the start of this decade, investors were able to take low inflation, low interest rates and low bond yields for granted.
The world is different now and, as a result, investors may need to think and approach markets in a different way if they are to protect and augment their wealth.
The key benchmark to note is the 10-year gilt yield. This represents the “risk-free rate” for investors because, in principle, the British government will not default on its liabilities.
The last time the UK defaulted was the 1672 Stop of the Exchequer under King Charles II – although some financial market historians argue that 1932’s reduction of the 1917 War Loan coupon to 3.5pc from 5pc was tantamount to a default, even if the government portrayed the reduction as a voluntary one on behalf of patriotic investors.
In sum, the British Government will always make its interest payments (coupons) on time and return the initial investment (principal) once the bond matures, even if it must print money to do so. The investor will receive all the interest they are owed and their money back, assuming they buy the gilt upon issue and hold it until it matures.
At the time of writing, the 10-year gilt yield is 4.89pc. This is therefore the minimum, nominal, annual return on any investment that an investor should accept over their preferred investment time frame.
The 10-year yield is approaching 5pc. That figure comfortably exceeds the 3.3pc forecast yield on the FTSE 100 for 2026.
The test now is whether investors settle for a higher risk-free rate and buy gilts, or stick with stocks, hoping for their near 7pc earnings yield, judging by the FTSE 100’s 14-times forward earnings multiple for this year.
At the same time, investors may also decide they want to pay lower valuations and prices for riskier assets such as equities because they do not need them quite so badly in their search for a return on their capital.
More things can go wrong with a shareholding than a bond, too – not least that the share price can go down, management can cut the dividend or the earnings forecasts can be wrong (or all three).
If gilt yields rise, investors are likely to demand higher returns from equities to compensate for the risk.
This can mean paying a lower valuation, or multiple of earnings and cashflow, but they can also demand a higher dividend yield. This can be achieved by increasing payouts or simply by buying at a lower share price.
Remember: the total return from a share is determined by capital return plus dividend yield. The capital return will be, in crude terms, a function of both earnings growth and the multiple or rating paid to access that earnings growth.
In its simplest form, the price-to-earnings (p/e) ratio is a helpful tool here.
Earnings will go up (or down) depending on the economic cycle and the fortunes of the company’s target industry, as well as the management’s strategy and business acumen.
Many factors can influence the price, or multiple, the investor wishes to pay – including the company’s finances, managerial competence and governance, as well as the predictability and reliability of its operations and financial performance.
Interest rates will have a big say in the multiple, too.
If gilt yields are rising, investors may feel less inclined to take risks and decide to pay lower prices and multiples, forcing a lower p/e in effect.
This maths helps to explain the FTSE 100’s pull-back from late February’s record high. Equally, the opposite can hold true, as evidenced between 2009 and 2021 when share indices rose as interest rates hit – and stayed at – rock bottom.
However you invest, never forget the bond market.

RULE 1 for Traders.
Stubbornly holding on to small losses.
Most investors could get out cheaply but because they are human their emotions take over. You don’t want to take a loss, so you hope, until your loss gets so large it costs you dearly. The rule is to cut all losses when a stock falls 7-8%.

For a dividend re-investment plan, re-invest your dividends at those higher yields than you could have got a month ago.

AEI enters a new phase through a combination with SHRS strengthening an already proven UK equity income strategy.
Overview
On 17/03/2026 Aberdeen Equity Income (AEI) completed the process of combining with Shires Income (SHRS), with AEI as the continuing vehicle. The result is an enlarged trust with net assets in excess of £325m. The combination modestly broadens the investment toolkit, adding preference shares and investment-grade fixed income securities, alongside exposure to selective overseas equities in developed markets. Whilst this may diversify income sources and slightly alter the risk-return profile, the core UK equity income approach remains unchanged, with managers remaining focussed on bottom-up stock selection, valuation discipline and dividend sustainability, building a Portfolio of high-quality companies where share prices understate long-term potential.
Income progression remains a defining feature too. For the year ended 30/09/2025, AEI delivered its 25th consecutive annual Dividend increase to 23.0p per share, fully covered by earnings. The board intends to continue this record, guiding dividends of at least 23.1p for FY2026. The current yield of 6.0% remains attractive and the progressive dividend policy will continue post combination.
Cost efficiency is also set to improve. At 30/09/2025, AEI’s ongoing Charges figure stands at 0.84%, but the enlarged trust’s OCF will be capped at 0.78%. As part of the scheme, Aberdeen agreed to fund implementation costs (net of the cash option discount), limiting NAV dilution for rollover shareholders.
Performance has also strengthened meaningfully over the past year to 23/03/2026, with AEI delivering NAV and share price total returns of 26.3% and 25.3%, ahead of the 17.5% return from the FTSE All-Share. Alongside this, investor demand has been strong. The trust has issued c. 6.5% new shares over the past 12 months, a notable outlier in a sector where issuance has been limited. At the time of writing, AEI currently trades at a small Discount of 1.9%, compared with its five-year average of 3.4%.
Analyst’s View
The merger with SHRS is, in our view, a constructive development for AEI. It brings greater scale, lower, more competitive costs and a potentially broader toolkit, without altering the high-quality, valuation-driven UK equity income philosophy that has delivered strong income and capital growth under Thomas’ tenure. The addition of Iain Pyle’s expertise in preference shares, selected fixed income and overseas equities should modestly diversify income streams and temper volatility at the margin, but the strategy remains fundamentally the same disciplined approach.
To us, one of AEI’s clearest differentiators remains its income durability. A 25-year record of consecutive dividend growth, with a further rise guided for 2026, reflects a diversified portfolio of cash-generative businesses and prudent reserve management across multiple cycles. In an environment of easing cash rates and moderating inflation, a 5%+ yield backed by a progressive policy remains attractive.
The combination also strengthens AEI’s position in what we view as an increasingly compelling UK equity backdrop. The UK market remains attractively valued relative to global peers, with robust corporate balance sheets, significant overseas earnings providing resilience and ongoing M&A activity highlighting latent value. Against this backdrop, AEI’s larger scale, and bias towards attractively valued businesses, including meaningful smaller company exposure, leaves it well placed should market leadership broaden, though smaller companies remain sensitive to economic pressures and investor sentiment.
AEI has traded at a modest premium for most of the last 12 months, reflecting improved performance and renewed demand, although it fell to a discount at the start of March 2026, when the Iran war began. Whilst its current level reduces the valuation cushion seen in 2023, continued outperformance, a broader recovery in UK sentiment, particularly towards smaller companies, and the added benefits of the combination through added scale and cost efficiency, could see its discount narrow, or return to a premium. On balance, we believe AEI is well positioned for long-term income-focussed investors wanting differentiated exposure to the UK’s potential.
Dividend
The combination with SHRS has not altered AEI’s core income objective. The board has made clear that the enlarged company will continue to pursue a progressive dividend policy, with the intention of extending its long-standing record of annual increases. Whilst the investment toolkit may broaden modestly, the emphasis on delivering a high and growing income stream remains central to the trust’s identity. Importantly, the board has also stated that it does not expect a reduction in dividend income for shareholders of either AEI or SHRS as a result of the transaction.
That commitment is underpinned by a strong track record. For the year ended 30/09/2025, net revenue earnings rose 2.1% to £11.24m, supporting a 1.6% increase in earnings per share to 23.43p. This in turn supported a fourth interim dividend of 5.9p, bringing the total annual dividend to 23.0p. The dividend was fully covered by earnings and marked the 25th consecutive year of dividend growth, maintaining the trust’s status as an AIC Dividend Hero. The ten-year history of dividends and earnings per share, shown below, highlights consistent coverage, with the exception of the COVID-affected years (FY20–21), when revenue reserves were used prudently to maintain distributions. Looking ahead, the board expects dividends of no less than 23.1p for the 2026 financial year, reinforcing its intention to extend the trust’s dividend growth record.
Source: Aberdeen
Whilst the board continues to emphasise that dividends should be funded primarily from portfolio earnings AEI retains revenue reserves of 15.68p per share, equivalent to approximately 0.7× last year’s 23.0p dividend, to support distributions in more challenging periods. In addition, distributable capital reserves of 171.25p offer further flexibility, should they ever be required to support distributions further and shareholders recently approved an application to the courts to redesignate the share premium account as a distributable reserve, providing further flexibility to the board.
At the portfolio level, both Thomas and Iain have demonstrated, within their respective trusts, that income generation and capital growth can be achieved in tandem. In our view, this provides a positive indication of continuity under AEI, post combination. Their valuation-aware approach often leads them towards companies offering attractive yields alongside scope for operational or strategic improvement. In several cases, this has resulted in dividend yield compression as market perceptions improved. Recent examples include Imperial Brands and M&G, where strong cash generation and clearer capital allocation frameworks supported both income delivery and share price appreciation.

Sirens are mythical creatures known for their enchanting voices that lured sailors to their doom.
Of the investment trusts waiting in the wings to become ‘dividend heroes’, there are plenty of high-yield options.
25th March 2026
by Kyle Caldwell from interactive investor

As reported last week, 20 investment trusts have delivered at least 20 consecutive dividend increases.
However, the latest data from the Association of Investment Companies (AIC) shows that waiting in the wings to become dividend heroes are 30 trusts that have increased their dividends for 10 or more consecutive years, but fewer than 20 years. More than half of these “next generation” trusts yield more than 4%.
There are two new entrants to this year’s list: Utilico Emerging MarketsOrd UEM
and Foresight Environmental Infra Ord FGEN
Dropping off the list versus a year ago are Chelverton UK Dividend Trust Ord
Henderson International Income and BBGI Global Infrastructure. The latter two trusts were subject to takeovers, with Henderson International Income merging into JPMorgan Global Growth & Income.
Among the next generation of dividend heroes is Diverse Income Trust Ord
,which is proposing to turn into an open-ended fund. Under the open-ended fund structure, it will be tougher for Diverse Income to achieve a consistent dividend track record, as funds do not have revenue reserves and all the income generated each year is returned to shareholders. Therefore, during lean periods, a year-on-year dividend cut is pretty much inevitable for funds when less income is generated by the underlying investments.
Income-paying investment trusts have a particular attraction for investors who want a regular cash flow, because they don’t have to distribute all the income generated by their assets every year. Investment trusts can hold back up to 15% each year, which means they can build up a “rainy day” reserve to bolster dividend payouts in leaner years.
There are a number of high-yielding options among the next generation of dividend heroes, but care needs to be taken, as high yields can signal a potential value trap.
Moreover, while high yields offer investors the prospect of higher income today, there are no guarantees that this will result in market-beating returns from a total return perspective – when both capital and income are combined. In addition, dividend growth may be higher for trusts with lower yields today.
Having explained those caveats, the highest-yielding next generation dividend heroes are
Henderson Far East Income Ord HFEL
Also bear in mind that those with low yields have a much greater growth focus. In those instances, most of the overall total return will come from growth rather than income generation.
Schroder Oriental Income Ord SOI
BlackRock Greater Europe Ord BRGE
lead the list, both having increased their annual dividends for 19 consecutive years. They are closely followed by CQS New City High Yield Ord NCYF0.00% and Henderson Far East Income, which both have an unbroken record of 18 years of dividend increases. Two investment companies that have 17 years of dividend increases are International Public Partnerships Ord INPP2.03% and Aberdeen Asian Income Fund Limited AAIF0.00%.
The next generation dividend heroes with the fastest five-year dividend growth per annum are Fidelity China Special Situations Ord FCSS
CT Private Equity Trust Ord CTPE
CT Private Equity Trust Ord CTPE0 and Invesco Global Equity Income Trust ord IGET.
It’s easy to get the impression that the revenue reserve is somehow “ring-fenced”, but that’s not the case. In reality, it amounts to little more than an accounting tactic, an entry in the books to show retained revenue. That money is part of the trust’s net asset value (NAV) and is invested in the same way as the rest of the portfolio. If some of it is needed to top up dividend distributions, then the manager has to sell holdings or dip into the cash element and the NAV is affected.
Of course, even for those investment trusts with healthy income reserves, there’s no guarantee that dividends will be maintained or increased.
Source: theaic.co.uk/Morningstar. Data at 19 March 2026.

We reveal the biggest investment trust discount changes over the past week.
27th March 2026 11:58
by Dave Baxter from interactive investor

Investment trusts offer investors the chance of picking up a potential bargain thanks to their closed-ended structure. That happens when a trust’s share price is lower than the value of its underlying investments (the net asset value, or NAV).
However, a trust trading on a discount to NAV is not necessarily a buying opportunity. There’s likely a good reason why the trust is cheap, such as subdued short- or long-term performance, or poor investor sentiment towards it.
In this weekly series, interactive investor highlights the 10 biggest investment trust discount moves over the past week.
In total, nearly 400 investment trusts have been screened, with the data sourced from Morningstar. Venture Capital Trusts (VCTs) have been excluded. We also strip out trusts with less than £30 million in assets and those that are not available on the interactive investor platform.
saw its massive premium evaporate in late 2025 as concerns grew about softer growth in France, and has continued to struggle so far this year.
Those woes intensified yesterday, when an update from its main holding Action outlined plans to expand into the US market and shares dropped by around 15% in a day.
The shares traded at a discount of almost 25% at the close of trading, for once putting 3i Group in line with its heavily discounted private equity peer group.
Action noted that it had “completed an in-depth market study of the United States, which demonstrated clear potential for the Action format”. The company is looking to open its first US store by the end of 2027 or early 2028.
Customers at interactive investor tended to buy into the shares when they slipped last year, and next week we will take an in-depth look at the case for (or against) jumping in now.
The rampant consolidation of property investment trusts shows no sign of letting up just yet, with
Schroder Real Estate Invest Ord SREI
this week confirming to the market that they were considering a possible bid for Picton Property Income Ltd Shs GBP PCTN
SREI shares have been sliding since then, even if that continues the general trajectory of the last month, landing it in this week’s table. Another property name, Custodian Property Income REIT Ord CREI
sits in the table, if without any major news flow bar an update on a share buyback.
On the consolidation front, it’s worth noting that we also saw AEW UK REIT Ord AEWU
confirm that it was considering a bid for Alternative Income REIT Ord AIRE The former has also seen its discount widen, even if it doesn’t quite make it into this week’s table.
Plenty of trust share prices are in freefall thanks to recent market volatility, and it therefore makes sense that we see quite a mix of different trusts populating the rest of the table.
Interestingly, we see Global Opportunities Trust Ord GOT
a trust that has long expressed investment manager Sandy Nairn’s bearish views via a hefty cash position, moving out to a slightly bigger discount.
The trust released its results in the last week, where the manager argued that “the real opportunities are yet to appear and we retain the dry powder accordingly”. The trust’s allocation to cash and other net assets came to a hefty 15.3% of the portfolio at the end of 2025.
Otherwise we see a combination of weak and strong performers making this week’s list without obvious news flow.
one of the strongest-performing funds since the onset of hostilities in late February, saw its shares slip and its discount widen this week.
On the other end of the spectrum we see CT UK High Income Ord CHI
moving out to a double-digit discount. This mainly large-cap focused fund has been the worst performer in its UK Equity Income Association of Investment Companies (AIC) sector, by share price total return, since late February.
There’s plenty of additional variety in the list, from the presence of activist vehicle AVI Japan Opportunity Ord AJOT
to Baillie Gifford’s Schiehallion Fund Ord MNTN
and abrdn Diversified Income & Growth Ord ADIG
which is in the late stages of a wind-down.
With markets continuing to tumble, adventurous investors are almost spoiled for choice.
| Investment trust | Sector | Current discount (%) | Discount/premium change over past week (pp) |
| 3i Group Ord III1.04% | Private Equity | -24.4 | -15.4 |
| abrdn Diversified Income & Growth Ord ADIG8.21% | Flexible Investment | -10.2 | -9.4 |
| Greencoat Renewables GRP1.23% | Renewable Energy Infrastructure | -26.2 | -6.4 |
| Schroder Real Estate Invest Ord SREI1.18% | Property – UK Commercial | -24.5 | -5.2 |
| CT UK High Income Ord CHI1.00% | UK Equity Income | -10.1 | -4.9 |
| Global Opportunities Trust Ord GOT0.00% | Flexible Investment | -19.3 | -4.9 |
| Barings Emerging EMEA Opportunities Ord BEMO0.33% | Global Emerging Markets | -15.5 | -4.6 |
| Schiehallion Fund Ord MNTN1.46% | Growth Capital | -0.7 | -4.3 |
| Custodian Property Income REIT Ord CREI1.28% | Property – UK Commercial | -19.5 | -3.9 |
| AVI Japan Opportunity Ord AJOT1.19% | Japanese Smaller Companies | -4.8 | -3.9 |


Brett Owens, Chief Investment Strategist
Updated: March 27, 2026
Oil is up, and everything else is down. Stocks. Bonds. Even gold, the traditional safe haven!
Real estate stocks are on sale as well. Which means we contrarians need to go shopping. Today we’ll look at four real estate investment trusts (REITs) yielding between 6% and 15%.
Right before the conflict started, I mentioned that we were looking at an attractive setup for price appreciation in REITworld.
As the Fed cuts rates, the dividends that REITs pay become increasingly attractive to income investors. Money markets don’t pay 5% any longer. Neither do many bond funds. But REITs pay …
And rates are likely to continue lower due to the rollout of AI across the economy. Automation is capping wage growth. Customer support, for example, is well on its way to being automated. Next up we’ll see bookkeeping, compliance and even legal work increasingly handled by machines. Softer inflation gives the Fed room to cut more than Wall Street expects.
The longer-term outlook has not changed. (A big hint for anyone with a mature, big picture mindset!) But in the short term, the Federal Reserve has pushed “pause” on its rate-cutting trend.
Earlier this year, we could chalk it up to economic data. Now? The central bank is clearly in wait-and-see mode because of the Middle East.
“The thing I really want to emphasize is that nobody knows,” Fed Chair Jerome Powell recently said. “The economic effect [of the Iran war and oil disruptions] could be bigger, they could be smaller, they could be much smaller or much bigger. We just don’t know.”
As a result, the market has all but given up on any additional near-term relief in interest rates. FedWatch, which uses 30-day Federal funds futures prices to determine the probability of changes to the Fed’s target rate, shows an 88% likelihood that the Fed will stay put at its late-April meeting.
And, In Fact, There’s a 12% Probability That Rates Go Up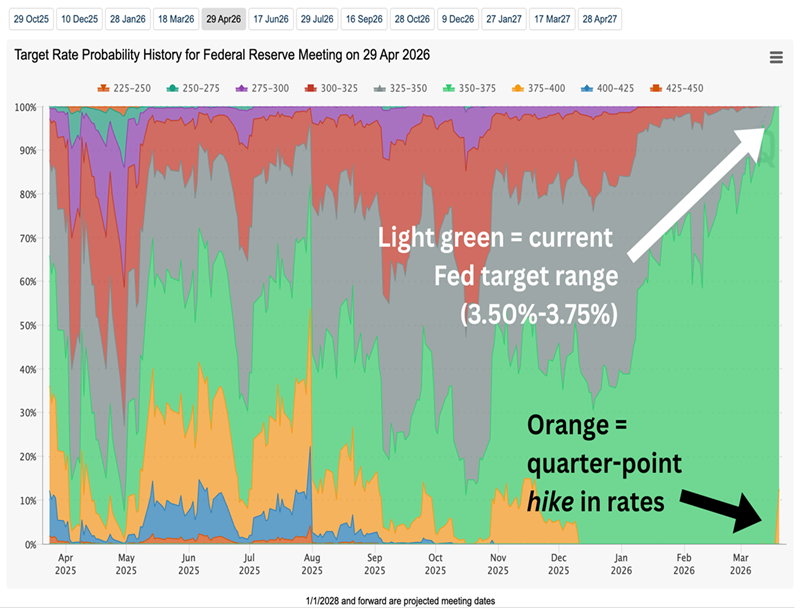
Source: CME FedWatch
That’s misery for REITs, which thrive when borrowing costs fall and their dividends look good in comparison to shrinking bond yields—but struggle when rising rates produce the opposite effect.
Virtually All of Real Estate’s 2026 Gains Have Been Erased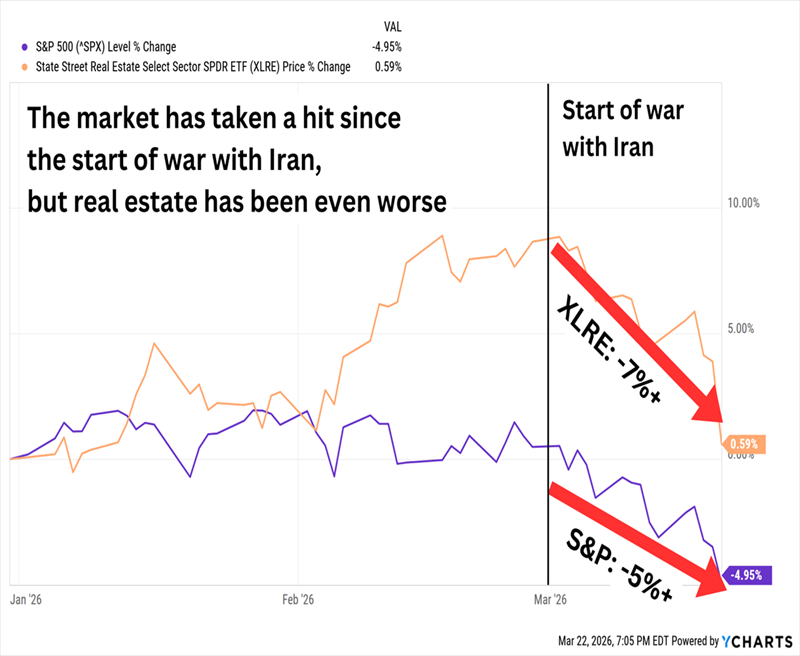
Again: The longer-term drivers of lower interest rates are still intact for now, which means this could be an ideal time to look for REIT deals. On my radar for a closer examination are these four landlords, which currently dole out between 6.1% and 14.6%.
Sabra Health Care REIT (SBRA)
Dividend Yield: 6.1%
Sabra Health Care REIT is a senior-focused healthcare play with roughly 360 property investments across the U.S. and Canada.
A little less than half of the portfolio, as measured by annualized cash net operating income (NOI), comes from skilled nursing and transitional care real estate. Another quarter or so is managed senior housing, with the remainder split among behavioral health properties, leased senior housing and specialty hospitals, among others.
The COVID crisis delivered a major shock to this type of real estate, but the long-term trends have remained in its favor—and that continues today. Supply is low. Pricing power is high. And Sabra is looking at expanding its senior housing operating portfolio (SHOP) via acquisitions.
As a result, shares have simultaneously been less volatile than the market but also plenty productive. In fact, the stock has steadily been making its way toward pre-COVID highs.
Returns Look Even Better When We Include the Dividend, But …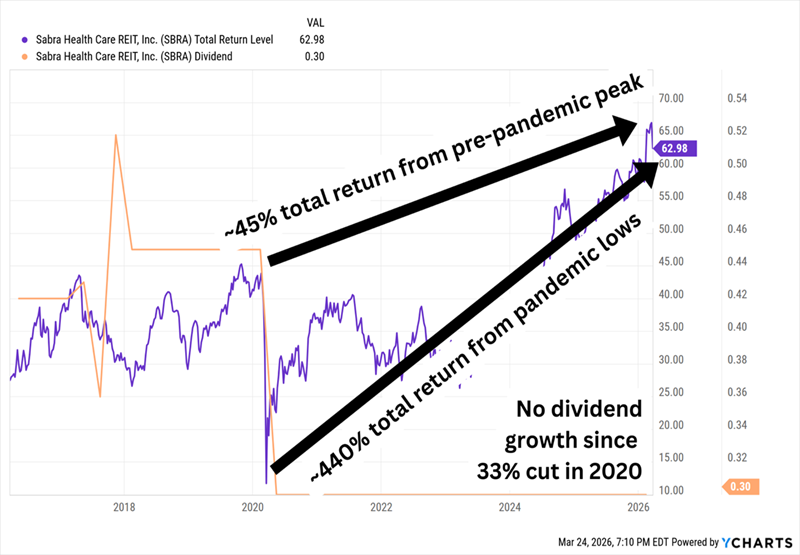
Sabra’s distribution hasn’t budged since slashing it by a third during the depths of the COVID doldrums.
It’s not for lack of room. SBRA pays 30 cents per share quarterly, so $1.20 across the year. Estimates for this year’s adjusted funds from operations (AFFO) are $1.60 per share. That’s a 75% AFFO payout ratio, which leaves room for at least some growth. But even though many other REITs have returned to dividend growth post-COVID, it’s not exactly surprising that Sabra has been hesitant.
The latest dip gives us a decent yield of around 6%, and SBRA trades at a decent 12 times AFFO estimates. It’s OK, but it’s hardly bargain territory yet.
Millrose Properties (MRP)
Dividend Yield: 10.4%
I highlighted several new dividend payers last July, including Millrose Properties (MRP), one of the more unusual REITs to ever hit the market.
Millrose was spun off by homebuilder Lennar (LEN) in 2025. The company exists to buy and develop residential land, then sell finished homesites back to Lennar and other homebuilders through option contracts with predetermined costs. Lennar, for instance, will pay Millrose an 8.5% annual option fee.
It’s truly a unique structure, so I wanted to revisit it after we had more data to look at.
So far, no complaint on the bottom line—Millrose delivered higher AFFO across every quarter of 2025, and estimates are for MRP to maintain or modestly grow AFFO every quarter across the next couple of years. And the REIT has been happy to push almost all of that back to investors, raising the distribution every quarter of its existence so far.
Though I Doubt a 99% AFFO Payout Ratio Is Doable Forever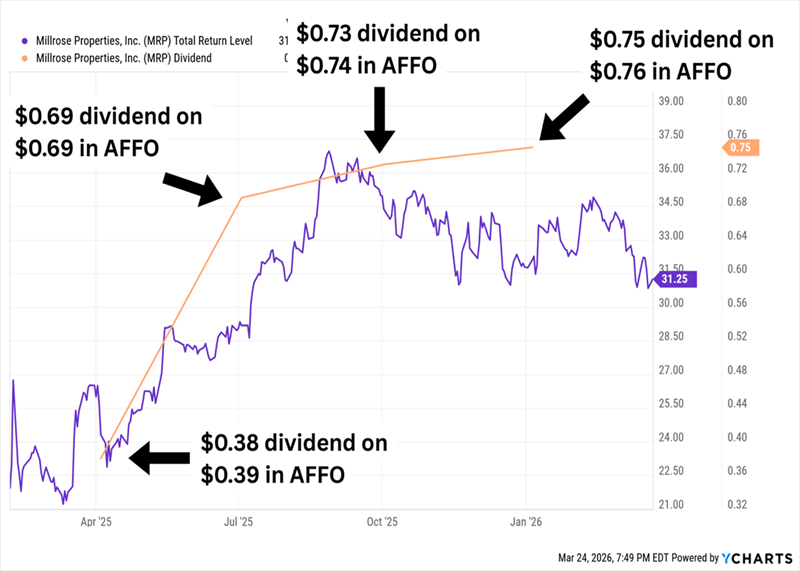
Rate uncertainty has clearly been weighing on shares of late. But what’s more interesting to me is that the administration’s executive orders to spark increased homebuilding haven’t done more to liven up shares.
I’ll also point out that MRP, at a 26% debt-to-capitalization ratio, is still plenty below its 33% max leverage target. Getting closer could spur more growth.
Meanwhile, shares trade at roughly 9 times AFFO estimates for this year. That’s definitely nice in a bubble, though MRP doesn’t have nearly enough trading history for us to know whether that valuation will be more norm or exception.
Innovative Industrial Properties (IIPR)
Dividend Yield: 14.4%
Innovative Industrial Properties (IIPR) acts as the first landlord and primary lender of choice for cannabis operators. In fact, this REIT is a capital lifeline for the industry.
IIPR buys dispensary facilities from the operators who are often short on cash and can’t finance their buildings because of the many roadblocks set up between cannabis businesses and banks. In the transaction, IIPR hands them a chunk of cash they badly need. Then it leases the facility back to the operator for 15 to 20 years.
Because traditional banks won’t touch the space, Innovative Industrial Properties negotiates incredibly favorable leases. They have long durations, built-in rent escalators and guarantees from the large corporate multi-state operator-lessees.
IIPR is essentially a “Godfather landlord” in a restricted industry. Cannabis peddlers need cash and have nobody else to turn to. So, they take the deal.
The REIT industry might have taken a hit in 2026, but we wouldn’t know it by looking at IIPR, which is one of the best-behaving stocks in the space this year.
IIPR Gained Ground After Earnings, Gave Very Little Back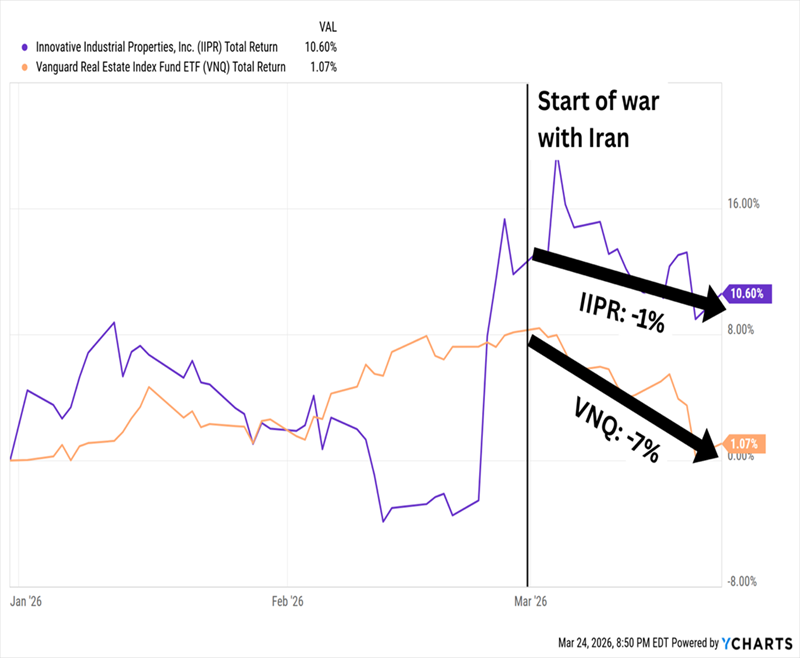
It’s a promising sign of relative strength from a stock that lost its luster years ago. IIPR’s price has cratered by 80% over the past five years—a bubble that simply popped.
Still, the slow but persistent march of cannabis legalization remains a long-term tailwind. IIPR is paying investors a high 14% dividend, though coverage has tightened up of late (2025 dividends of $7.60 actually outstripped AFFO of $7.24 per share). And we’re not paying much—after commanding crazy valuations of 30 to 40 times AFFO years ago, IIPR trades at less than 8 times AFFO estimates.
MFA Financial (MFA)
Dividend Yield: 14.6%
We can’t talk about high-yield REITs without discussing mortgage REITs (mREITs) like MFA Financial (MFA), which are the crème de la crème when it comes to eye-popping real estate payouts.
A reminder: Mortgage REITs borrow money at short-term rates to purchase mortgages (and other assets) that pay income tied to long-term rates, then profit off the difference. Their hope, then, is that short-term rates will be lower than long-term rates (which they usually are), and that short-term rates decline while long-term rates hold steady or move lower. The mREITs’ existing mortgages, which were issued when rates were higher, will yield more than newly issued ones, and thus be worth more.
Understandably, worries that the Fed might put off (or simply avoid altogether) any rate cuts in 2026, based on how the war with Iran resolves, has spooked mREITs right alongside traditional equity REITs.
MFA Is Holding Up Stronger Than Most, However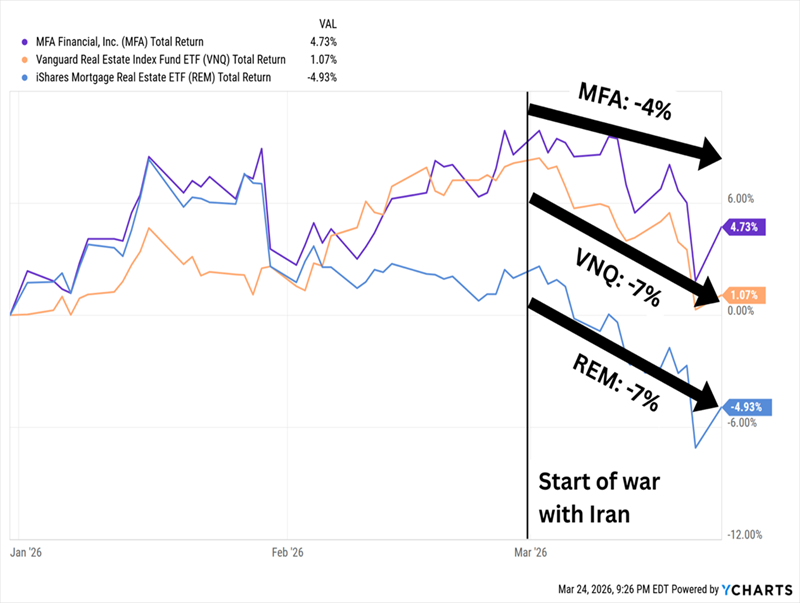
The company delivered an encouraging fourth-quarter report that provided some much-needed relief in a critical area: “distributable earnings per share” (DE), a non-GAAP measure of profitability that MFA favors.
I wrote in September that MFA was staring down the barrel of a significant dividend coverage problem—a potentially painful situation, but one that was expected to improve in 2026. And in fact, MFA finished 2025 with just $1.00 in DE versus $1.44 in dividends paid.
But its fourth quarter was much better than expected. Distributable EPS was better than expected. Economic book value per share inched higher in Q4, but management said it was up 3% so far in the current quarter. The investment portfolio improved by nearly 10%.
There’s still risk—MFA still needs to execute to get out of the woods, and a stalled Fed could hamper that—but this mREIT likely is still in a better position than it was half a year ago.
A Fully Paid Retirement for Just $600,000?
A 15% yield would do wonders for any retirement portfolio.
However, if we own 15% yielders that force us to religiously watch every earnings report for fear of a dividend cut, we might not make it to retirement.
If we’re going to retire on dividends alone, we don’t just need high yields—we need no-doubt payers that aren’t an earnings disappointment away from ruining our income stream.
And those are the kinds of dividends I prioritize in my “9% Monthly Payer Portfolio.”
These generous stocks and funds pay up to 14.9% and average more than 9% across the board. That’s enough to live on dividends alone—without ever needing to sell a single share to generate cash.
The math on this portfolio is easy to follow:
Better still? You’d be cashing dividend checks not annually, not quarterly, but each and every month. That means no “lumpy” payouts. No complex dividend calendars. No dumping money into certain stocks because you’re getting underpaid every third month.
Just paydays as smooth as when you were collecting a paycheck!


Nothing in Contrarian Outlook is intended to be investment advice, nor does it represent the opinion of, counsel from, or recommendations by BNK Invest Inc. or any of its affiliates, subsidiaries or partners. None of the information contained herein constitutes a recommendation that any particular security, portfolio, transaction, or investment strategy is suitable for any specific person.

© 2026 Passive Income Live
Theme by Anders Noren — Up ↑