The portfolio is called the Snowball because as a snowball rolls down a hill it gathers more and more snow and grows bigger until it stops rolling.
Or your Snowball, which should be different to the blog portfolio, the yield will grow as you buy more shares with the earned dividends, until you want to spend the same dividends, either when you retire or if you need to boost your income.
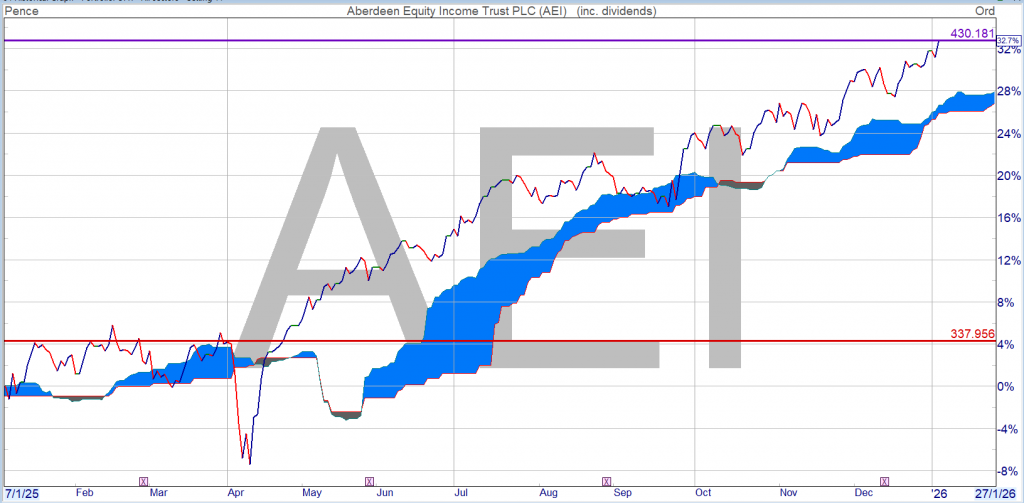
The Boards of Aberdeen Equity Income Trust plc (“AEI“) and Shires Income PLC (“SHRS)”) are pleased to announce that heads of terms have been agreed for a combination of AEI and SHRS (the “Combination“), bringing together two successful in
The combined yield will most probably fall and the Trust will leave the Watch List.
Supermarket Income REIT plc (LSE: SUPR, JSE: SRI) has today declared an interim dividend in respect of the period from 1 October 2025 to 31 December 2025 of 1.545 pence per ordinary share (the “Second Quarterly Dividend”).
The Second Quarterly Dividend will be paid on or around 27 February 2026 as a Property Income Distribution (“PID”) in respect of the Company’s tax-exempt property rental business to shareholders on the register as at 30 January 2026. The ex-dividend date will be 29 January 2026.
Please note that there is no scrip dividend alternative available for the Second Quarterly Dividend and it will be paid in full as cash. The Board will keep under consideration the offer of a scrip dividend alternative in respect of future quarterly dividends.
The National Fund itself dates back to 1927, when an anonymous donor gave around £500,000 in cash and investments.
The Debt Management Office has confirmed it will cancel £607.4 million of government debt on January 9, 2026, using money from the National Fund.
The debt being cancelled takes the form of a government bond, known as a gilt, which pays an interest rate of four per cent and was originally due to mature on January 29, 2027.
Unlike most government bonds, this gilt is not held by private investors.
Instead, it sits in the Donations and Bequests Account, a state-run account that holds money donated specifically to help reduce the national debt.
That account is overseen by the Commissioners for the Reduction of the National Debt, a long-standing institution responsible for managing such funds.
If your view is that UK unemployment is to continue to rise, the bank rate will be further reduced.
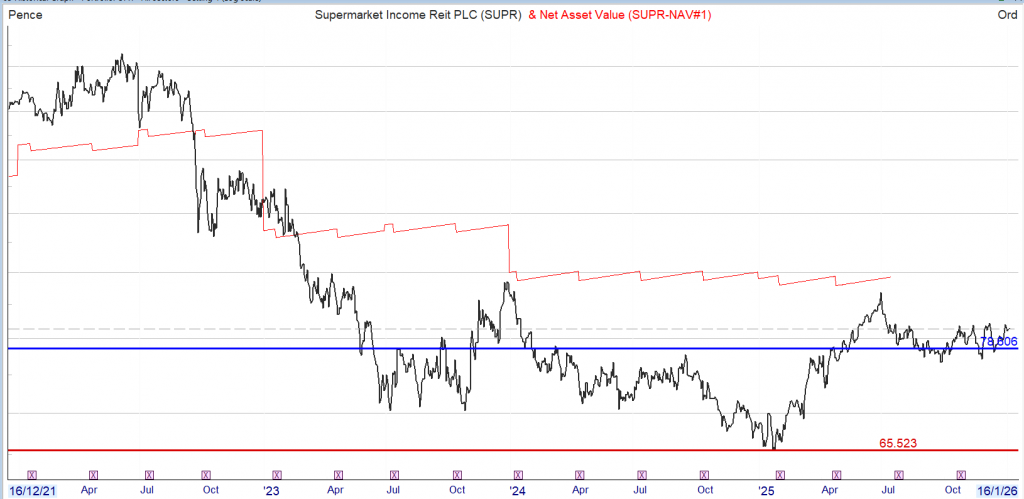
SUPR is no longer an Investment Trust but is still a
Real Estate Investment Trust REIT stands for Real Estate Investment Trust. It is a company that owns, operates, or finances income-producing real estate across various property types, providing investors with regular income streams and diversification.
Confusing yes ? They still have to pay out 90% of taxable income as a dividend but no longer have to publish a NAV.
The current published Fair Nav is 89.25p and the share price is currently 82p, which has proved to be resistance and the yield is 7.5%.
If your view is that interest rates will fall and therefore the return on money market accounts etc., will also fall the gap between the two will widen.
This might be the incentive for people to buy one of the safest yields in the market, although no yield is 100% secure and the gap between the price and the Fair Nav will close.
It could close if the NAV falls but that is the glory of investing.
Remember SUPR have never ever failed to collect their rent on the due date.
If you buy a 10k position with a share yielding 7% and re-invest those dividends at 7%, in ten years time you will be receiving a yield of around 14% on your position, not dependant on Mr. Market. If the price of the share rises and the yield falls, you may have to take your profit and switch horses.
SUPR
Your starting position – 13,000 shares cost 10k – Purchase date: 20 July 2023 Initial yield 7.5% The price fell after the starting position which meant you bought more shares for your money and therefore more dividends.
🟩 FINAL RESULT — Your total SUPR shares today
🎯 Summary
– Starting shares: 13,000 – Dividends received: £1,779.3 – Reinvested at actual prices on xd date – New shares added: ≈2,327 – Total today: ≈15,327 shares
15327 shares x fcast dividend 6.12p = £938.01 a yield on seed capital of 9.38%
All figures subjective to the price you could have dealt at on the xd date.
If you were lucky with you timing, the share including dividends is up 27% over a year, so not so shabby.
Here’s one thing I can say for sure about 2026: This year, we’ll be grateful we’re NOT sitting on “America’s ticker”—my name for the SPDR S&P 500 ETF Trust (SPY).
I call SPY that because pretty well everyone owns it. But its 1% yield makes it more likely that holders will be forced to sell low in the next pullback, if they’re leaning on it to pay the bills.
Not us! We’ll be pocketing the 8%+ cash payouts from the portfolio of my Contrarian Income Report service. So while SPY holders face the next pullback with dread, we’ll be chugging along with our usual “dividends and chill” approach.
When a storm hits, we simply wait for our next big dividend payment to roll in. (And we don’t have to wait long—many of our divvies are paid monthly.)
Today I want to zero in on one attractive 13.4% (!) payer from our portfolio. Then I’ll show you a smart, simple way to forecast that massive dividend (and indeed any payout) with ease.
This 13.4% Payer Loves This “Bearish” Bull Market
We love FS Credit Opportunities (FSCO) for a lot of reasons, but its sky-high—and growing—dividend is right up there. FSCO yields a mammoth 13.4% today (more on that in a second).
Small businesses—the main drivers of US economic growth—love BDCs, too, because they loan money to these firms. BDCs are a godsend for these mom-and-pop shops, who often struggle to get the capital they need from stingy banks.
Most BDC managers sit in their cozy offices, wait for a private-equity sponsor to call, then write a check for a safe but low-paying loan.
Not FSCO. Portfolio manager Andrew Beckman buys distressed loans for dimes—even pennies—on the dollar. His chops in this arena drive the stock’s growing 13.4% payout.
Beckman is the industry’s “credit surgeon.” Forget the safe loan! He wants the patient who’s bleeding out on the table because he can stitch them up—and charge a fortune for doing so.
Before FSCO, he spent the core of his career at Goldman Sachs (GS), in their legendary Special Situations Group. These “credit commandos” thrived buying depressed assets in the 2008/2009 crisis.
FSCO is a BDC in a closed-end fund (CEF) wrapper. As a CEF, it can (and does!) trade at different levels in relation to its value. Today, it trades at a 14.7% discount to NAV because slower jobs numbers are sparking recession worries. That means we’re getting FSCO’s expertly run loan portfolio for just 85 cents on the dollar.
Yes, hiring is slow, but that’s because companies are implementing AI to boost efficiency. And small businesses are the No. 1 users of this tech.
Meantime, the Atlanta Fed’s GDPNow estimate shows that the US economy is still solidly in growth mode: a strong 3.5% rate, to be exact.
The disconnect between investors’ mood and strong growth is our opening to grab FSCO, and its 13.4% payout, at a bargain.
Buy FSCO, Then Do This to Forecast Your Dividends for Years
High, and rising, dividends like this one really are unicorns, and I see a diversified portfolio of them as a far better option than ETFs like SPY.
But the key to getting peace of mind (and dodging the urge to sell when markets fall out of bed) is knowing exactly when your next payout is coming. Truth is, there aren’t many tools out there that do this. And even fewer that do it well.
My Top 2026 Market Prediction (and 3 Cheap Dividends to Play It)
Brett Owens, Chief Investment Strategist Updated: January 6, 2026
Ignore the doom-and-gloom “predictions” about 2026. There are plenty of gains—and growing dividends—to be had for us this year.
And if we do see a short-term pullback—possible, as we discussed a few weeks ago—the “smart money” is already setting up for a rebound. We’re going to join them by targeting three “depressed” corners of the market. We’ll get into those (and three tickers) below.
DC Stacks the Deck
Why am I so optimistic? Because, to be frank, the fix is in.
We are entering a year of “administered growth.” The Trump team has made its wishes clear: It wants lower mortgage rates, cheaper borrowing costs and a laissez-faire backdrop for American businesses.
And no matter who takes over at the Fed when Jay Powell leaves in May, they’re certain to push for lower rates out of the gate—in line with the administration’s stated (and stated, and stated) wishes.
Plus, midterm elections! We all know the administration wants a strong economy heading into the midterms. There will be money pumped into the economy this year.
In the meantime, growth remains robust, with the Atlanta Fed’s GDPNow measure giving an initial reading of 3% for Q4. That’s solid—and economists see S&P forecasts popping 15.5% next year. It’s tough to get a recession when bottom lines fatten like that.
… But We Still Need to Be Picky
That said, this is still a stock-picker’s market, and we contrarians will still do what we always do: Go where everyone else is not.
Buy an S&P 500 index fund now and you’ll lock a third of your investment in the Magnificent 7: Apple (AAPL), Amazon.com (AMZN), Alphabet (GOOGL), Meta Platforms (META), Microsoft (MSFT), NVIDIA (NVDA) and Tesla (TSLA).
I’m an AI bull. But I see the biggest gains flowing to the insurance, pharma, agriculture and other firms using the tech—less so the providers themselves.
I think other investors will see things this way, too, and they’ll rotate into other corners of the market as they do. These three tickers are a great way to “front run” them.
Consumer Spending Is Soaring. Mastercard Is Here for It
Consumers are still spending, though higher income earners are driving most of those gains, while lower-income folks cut back.
No matter how we feel about that, with productivity (and corporate profits) surging thanks to AI, consumers will likely keep tapping their cards in 2026.
That’s great for Mastercard (MA), which, along with Visa (V), essentially holds a duopoly on transaction processing. Every time a card (or phone, or mouse) is used to make a purchase, this duo gets a piece of the action.
Yes, Mastercard’s 0.6% current yield is uninspiring. But dividend growth is where the party’s at. Over the last five years, MA has essentially doubled its payout, and the share price has followed along—the “Dividend Magnet” effect we’ve talked about before. And now we have a gap between the two to take advantage of.
Dividend Doubles—Share Price Primed to Follow
Management knows this stock is strong: They’re hiking the divvie at an accelerating clip, with the last hike coming in at a rich 14%. And they’ve got a free hand to add more payout fuel to the fire, with a mere 17% of free cash flow going to dividends.
At that rate, investors don’t have to worry about a recession. Mastercard can keep the payout popping through any storm!
That payout resilience gets a boost from buybacks: Over the last decade, management has taken 10% of Mastercard’s shares off the market, leaving fewer on which it has to pay out—and setting the stage for even stronger per-share payout growth down the road.
A Low-Risk Play as AI Supercharges Medical Research
Healthcare is one place where we can clearly say there’s no AI bubble. Which is funny, because it’s where the tech can drive the biggest gains, as it slashes the amount of time needed to develop new drugs and medical devices.
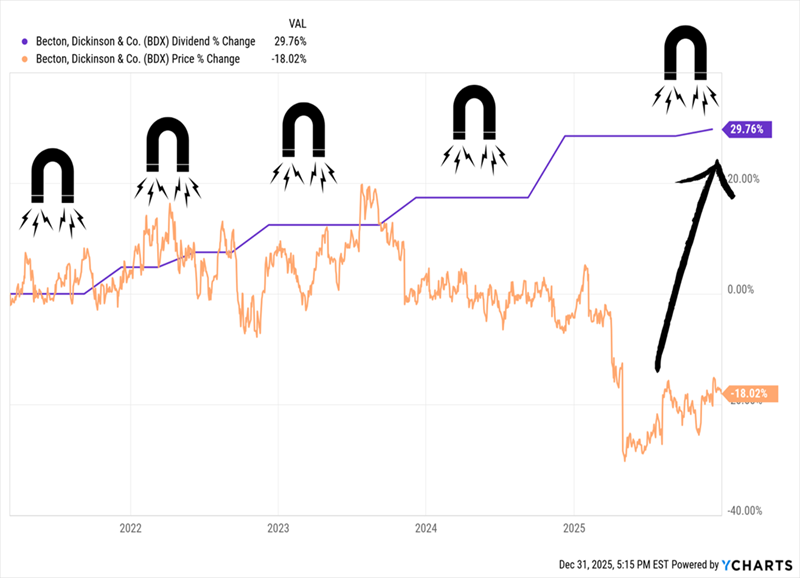
Enter Becton, Dickinson & Co. (BDX), which yields 2.2% and makes hospital mainstays like syringes, catheters and blood-flow monitors.
Our opening? BDX’s Dividend Magnet, which had been working well until a disappointing earnings report in May. That pulled down the stock and gave BDX a “dividend gap” I see as an opportunity.
Another “Dividend Gap” for Us to Play
Meantime, I see dividend growth accelerating, for a couple reasons.
First, demand for BDX’s products will naturally float higher as the population ages. Further growth comes from its Life Sciences division, maker of products every lab needs, like flow cytometers, used to analyze immune cells, cancer cells and biomarkers.
Then there’s the upcoming merger of its bioscience and diagnostics businesses with Waters Corp. (WAT). Management sees the deal teeing up 5% to 7% yearly growth for Waters, and here’s the real upside for BDX: Its shareholders will own 39.2% of the combined firm, letting it book a slice of those profits passively. Management can then focus on BDX’s remaining products.
The kicker: BDX also gets $4 billion in cash, half of which will go to buybacks, with the rest paying down debt. As with Mastercard, this opens the door to higher future payout hikes.
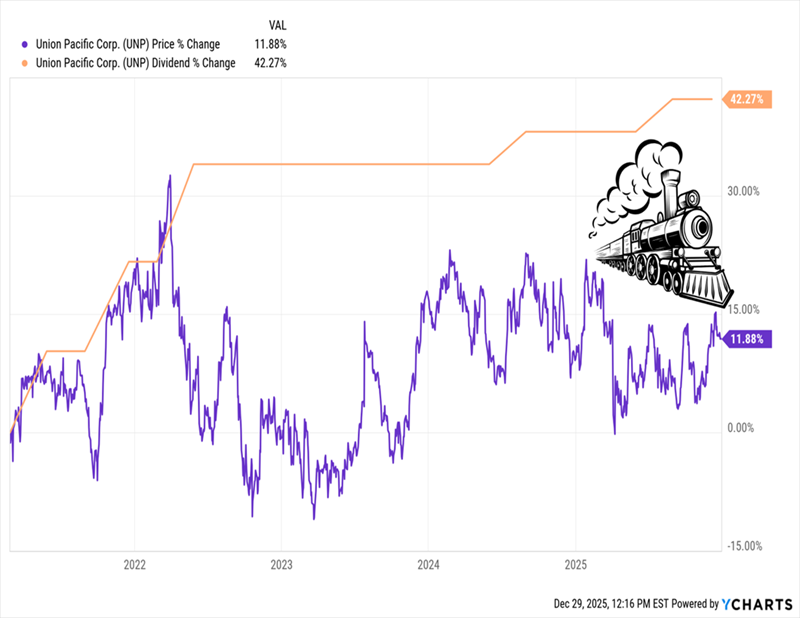
UNP Is About to Leave the Station
Trump’s tariffs hammered shippers in 2025, including railroads. Union Pacific (UNP), whose lines spread across the west and into Mexico, felt the heat. Now the company aims to capture more US business through its merger with eastern-focused Norfolk Southern (NSC).
Regulatory approval is far from certain, but either way, the “trade” winds are about to swing behind railways, and UNP’s soft stock price—which moved sideways in 2025—makes it a contrarian standout.
For one, the administration is being hammered on affordability, and it’s responded by cutting tariffs on over 200 food items. That’s a big “tell” that if inflation doesn’t let up, more tariff cuts are likely.
Then there’s the USMCA, which is up for renegotiation this year. In hearings held so far, US businesses have clearly said they want the deal to stay. And it’s always a safe bet that business—especially American big business—will eventually get what it wants.
Meantime, UNP is performing well, with EPS up 7% year-over-year in Q3. Management has also boosted efficiency, cutting UNP’s operating ratio (operating expense divided by operating revenue, the lower the better) by 1.8 points, to an adjusted 58.5%. That’s a solid result, with most Class I railroads in the 60% to 65% range.
UNP’s dividend growth has slowed recently (though it’s still up nicely in the last five years). The stock, too, has fallen off the pace. But I see that changing as trade worries wane and the NSC merger becomes clearer.
UNP’s Dividend Leaves the Station—Its Share Price Runs Late
That lag makes now a good time for a contrarian pickup—before unloved sectors like railways start to look very appealing to mainstream investors shifting out of tech.