For any new readers, there are only 3 rules.
Rule 1

Rule 2
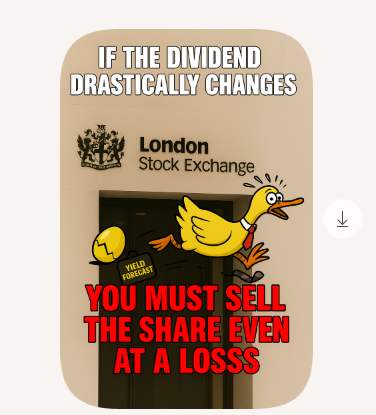
Rule 3

Investment Trust Dividends
For any new readers, there are only 3 rules.
Rule 1
Rule 2
Rule 3

I’ve bought for the SNOWBALL 3784 shares in HFEL for 10k.
Current yield 9.5%. Trading at a premium to NAV.
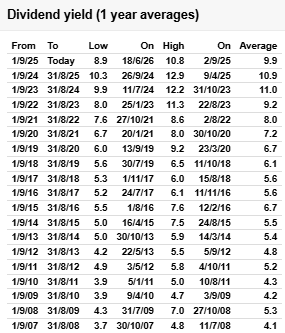
Higher yield, higher risk.

The SNOWBALL has sold Super SUPR for a profit of £528.00.
Hopefully Mr. Market may, one day, give us the chance to buy back at a higher yield.
View over Old Man Of Storr, Isle Of Skye, Scotland
Story by Zaven Boyrazian, CFA
Few investors come close to matching the exceptional track record of billionaire Warren Buffett. The ‘Oracle of Omaha’ has steered his investment firm to generate close to a 20% average annualised return since the 1960s. So it’s no surprise that when Buffett gives advice, investors listen… carefully.

And with the cost of living continuing to rise, his previous tips about the need to earn passive income are now more relevant than ever. After all, “If you don’t find a way to make money while you sleep, you will work until you die”, he famously said.
With that in mind, here’s how any investor can immediately start earning a passive income overnight.
While many investment portfolios tend to be geared towards growth, it’s easy to overlook mature, boring dividend-paying stocks. After all, why would you invest in a dull self-storage enterprise when there are bleeding-edge biotechs curing cancer?
However, despite the lack of excitement and attention, income stocks nonetheless drive the bulk of shareholder returns over the long run. And that’s especially true for UK shares, which offer some of the most generous dividends in the world.
So how do investors tap into all this passive income potential? It’s simple. All they need to do is buy shares in a dividend-paying company, and wait for the money to come rolling in (usually once every quarter).
But is it really that simple?

The most lucrative dividend stocks over the long run aren’t necessarily the ones with the highest yields today. Instead, it’s the businesses that generate exorbitant volumes of consistent free cash flow that not only fund shareholder payouts but also enable them to grow over time.

That’s a lesson Buffett has learned firsthand with his investment in Coca-Cola (NYSE:KO). The soft drinks giant has used its consistent and steady cash flows to increase dividends every year for 63 years in a row. And consequently, Buffett’s now earning more than a 60% yield on his original investment in the late 1980s.
Sadly, past performance doesn’t guarantee future results. And if investors blindly buy previously successful income stocks without investigating the underlying risks or potential rewards, their passive income could quickly disappoint.
So let’s take a closer look at Coca-Cola.
Starting with the positives, Coca-Cola’s latest results show that the company continues to expand sales organically at impressive profit margins. And even after another round of price increases, thanks to the group’s brand driving pricing power, sales volumes have remained robust, indicating that customers are happy to pay a premium.
That all translates into yet more free cash flow, paving the way for its 64th consecutive dividend hike. However, there are some brewing headwinds to keep a close eye on. Rising global sugar taxes and rising economic constraints in key emerging markets undermine the group’s long-term momentum.
As such, even if dividends continue to rise, future payout hikes might be far less impressive. Put simply, there may be other better dividend growth opportunities to explore right now. Nevertheless, for investors seeking reliable passive income, this Buffett-style stock might be worth a closer look.
The post Warren Buffett says you need to make passive income while sleeping! appeared first on The Motley Fool UK.

Harvey Jones crunches the numbers to show how investing in stocks and shares can be much more profitable than saving in a Cash ISA.
Posted by Harvey Jones
Published 29 June

You’re reading a free article with opinions that may differ from The Twelfth Magpie’s Premium Investing Services.
The Cash ISA is hugely popular. Too popular, in my view. While it’s a great home for short-term savings and an emergency cash buffer, this is no place to build long-term wealth for retirement. For that, the Stocks and Shares ISA will do a much, much better job.
And it’s not just me saying that. The Treasury agrees. That’s why it’s planning to cut the Cash ISA allowance for the under-65s from £20,000 to just £12,000 next April. The Stocks and Shares ISA allowance will remain at £20k for all. Why is it doing that? To encourage more people to access the long-term wealth building capacity of stock markets.
Over the last decade, the average Cash ISA paid just 1.21% a year, financial website Unbiased says. By comparison, the average annual return on a Stocks and Shares ISA, with dividends reinvested, was 9.64%.
So £20,000 saved in the average Cash ISA would be worth £20,242 after one year. In the average Stocks and Shares ISA, it would grow to £21,928. That’s £1,686 more. I’ll admit that’s a slightly daft comparison. Over such a short time scale, the Stocks and Shares ISA could go anywhere. It could easily rise or fall by up to 20% or more. Cash won’t.
That short-term volatility is a price worth paying given the long-term wealth building firepower that shares bring to the table. Over the typical investment lifetime of 30 years or more, the difference is massive.
Given the above performance figures, the Cash ISA would turn £20,000 into £28,690. But the Stocks and Shares ISA would absolutely transform it into £316,301.
A popular way to invest is to buy a spread of FTSE 100 stocks, which offer both share price growth and dividend income. Insurer and asset manager Legal & General Group (LSE: LGEN) now offers the highest trailing yield on the entire blue-chip index, a stunning 7.6%. Any share price growth is on top of that. I bought it for my SIPP three years ago.
Those dividends should ideally be reinvested while you’re of working age, to build your position, then drawn as income in retirement to top up your State Pension and any other savings you may have.
That dividend income should rise over time, which will help to protect its value against inflation. Over the last 15 years, Legal & General has increased its dividends by an average rate of 10.7% a year. This isn’t guaranteed though. The company has to generate enough cash to do that.
Sadly, Legal & General shares have disappointed lately. In fact, they trade at similar levels to a decade to go. But there are signs of a pick-up. Over the last year the shares have grown 12.7%. Combined with that trailing yield, the total one-year return is more than 20%.
Legal & General operates in a tough and competitive market. If we suffered a wider stock market crash, that could hit the value of the £1.2trn worth of assets it holds, reducing fee income. No stock is without risk. Yet I think the ultra-high income and the prospect of a share price recovery makes it worth considering today.
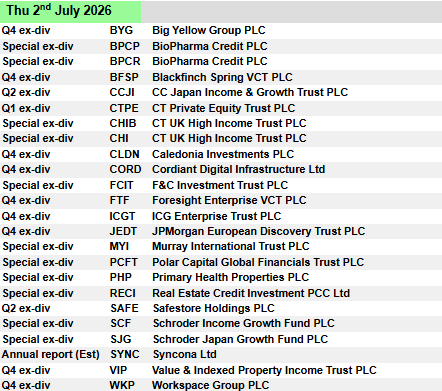
The strategic review and sale process initiated by Picton in January 2026, to explore options to maximise value for shareholders, is ongoing. In May, Picton received a non-binding indicative all-share offer from LondonMetric and Schroder Real Estate Investment Trust, acting as a consortium, the terms of which can be seen at the end of this report. The consortium is yet to make a firm offer for Picton, but on 16 June it announced that it had progressed confirmatory due diligence. Based on closing share prices as at 15 June, the terms of the proposed offer represented a value of £396m for Picton or 76.9p per share, a 9.0% premium to the closing share price of Picton at the same date.

Three possible outcomes.
One.
If the bid is finalised and subject to the share prices of SREI and LMP, a profit could be booked.
Two
A bid is made and the profit isn’t worth booking, the SNOWBALL would end up with shares in SREI 7.6% yielding and LMP yielding 6.5% which would be an acceptable outcome.
Three.
No bid is finalised and you end up with PCTN shares yielding 5.3%.
The shares would have to be sold, most probably at a loss.

This year’s income for the SNOWBALL is secured, so there could be time to buy and wait for the outcome. The jury is still out.

Let’s Talk About Seeking Alpha’s Favorite Preferred ETF: PFFA
Jun 26, 2026, 12:11 PM ETVirtus InfraCap US Preferred Stock ETF (PFFA)PFF, OXLC, ECC

When it comes to retirement, investors love to have a steady stream of expected income pouring into their bank accounts.
Seeking Alpha seems to be a home to the largest community of income investors anywhere on the Internet. Looking at other investing websites, if you research dividends, you find a significantly greater focus on total returns than you do here on Seeking Alpha. Reddit, for example, has countless conversations regarding dividend investing but still focuses on lower yield, lower risk, and higher total return potential that seems to be the most popular with readers and Investing Groups on Seeking Alpha.
That’s because Seeking Alpha has effectively catered to this niche section of investors for the last decade. It should come as no surprise that the largest investment groups on Seeking Alpha also focus on this niche sector. They’ve grown together by focusing on this underserved population.
One key staple for income investors is the demand for high recurrent income. Preferred securities are a hybrid class of security that mixes both aspects of common equity and debt together. A common dividend cannot be paid before the preferred security dividend is paid, but missing a preferred dividend does not cause the company to go into default like a true debt instrument would. This middle ground allows preferred securities to have a higher yield than other forms of traditional debt but a greater degree of safety than common equity. That greater degree of safety, though, means that you are trading potential capital upside for higher recurrent income in the present. Preferred securities, however, are still not readily understood by many investors, and they will choose to sidestep investing in individual preferred securities and use exchange-traded funds instead.
Today, I want to look at one of the most popular exchange-traded funds for preferred securities on Seeking Alpha and discuss what it’s doing well, but also the brewing risks under the surface. If you’re an income investor and you love recurrent regular income that is potentially growing and hopefully not getting cut, then this may be a solid read for you.
Let’s dive in!
Virtus InfraCap U.S. Preferred Stock ETF (PFFA) is an actively managed leveraged preferred security ETF that aims to meet a niche investor population. From its inception, PFFA has readily outperformed the passive index tracking preferred security ETF, the iShares Preferred and Income Securities ETF (PFF).
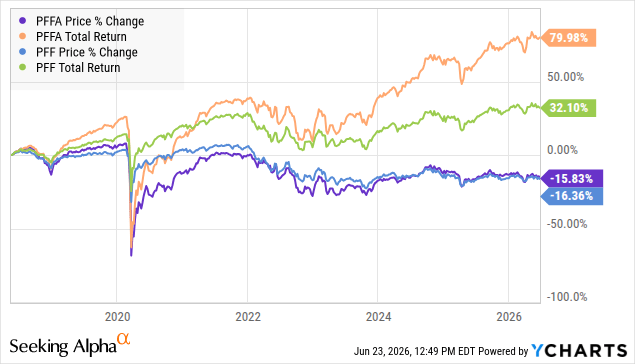
PFFA has outperformed PFF by a margin of over 40% in total returns. However, when we look at the actual price change returns from PFFA’s initiation, both have similarly negative price returns. This means that while what you’re getting in your pocket is significantly more, your capital is eroding in value. PFFA does not provide more capital preservation than PFF.
The reason for this is that both of these ETFs simply buy and hold. PFF blindly follows the index as it changes and does so on a quarterly basis, selling and buying regardless of premium or discount to par.

PFFA relies on active management to try to outperform the index, leading to portfolio turnover rates of sometimes over 60% on an annual basis. It’s this increased portfolio turnover and their use of leverage that is designed to help fuel greater return potential. PFFA uses between 20-30% leverage in an attempt to boost returns. This adds greatly to the volatility the fund experiences over short periods, as leverage works like an amplifier of both positive and negative returns. It also boosts the expenses of the fund to 2.11%, with 0.8% being their management fee and the rest the cost of their leverage. PFFA pays out a much larger distribution but does so at the expense of any type of additional capital-preservation measures.
Clearly, PFFA is paying out more and providing a greater total return because all of the return that they have in excess of PFF comes strictly from the distributions that they make, and this is what predominantly attracts investors to PFFA.
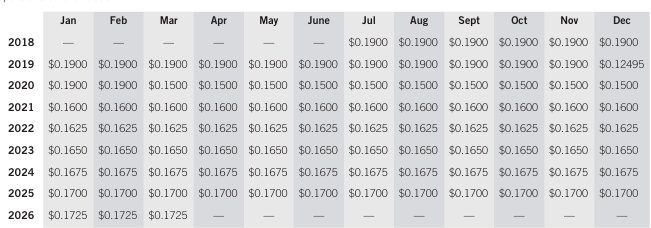
Over its lifetime, PFFA has had to cut its distribution only once. It has been raised multiple times, but never to its prior level. This means that original investors in PFFA are still receiving less each month than they received when they first invested in PFFA.
The key to remember is the fact that PFFA is not a preferred security investment by itself. You are investing in a fund that is actively managed using leverage and investing in preferred securities, and as such, you’re not going to receive the same level of income stability and security that you would from investing in individual high-quality preferred securities. You’re also going to receive potentially a significantly higher yield than you would from investing in those types of securities. You can find preferred securities offering anywhere from a 6-8% yield that is significantly lower risk and less volatile than you would find with PFFA, but you’re not going to benefit from the active trading activities of PFFA’s management team or the use of their leverage. So long as their management team can find excellent opportunities to achieve great returns, then you can expect the dividend to be consistent.
The risk is when environments are not favorable to their trading activity. When I last covered PFFA, I highlighted that if interest rates continued to drop, their ability to generate the high yield they’re providing would become strained. Thankfully, it looks as if interest rates are not going to be cut any further anytime soon, and there is a potential for interest rate hikes on the horizon if the economy remains strong and inflation remains high. There is a lot of gray in the outlook, and we only provide long-term outlooks to Dividend Kings members.
PFFA is currently not sustaining its present yield.

According to the fund’s own website, its present distribution rate exceeds that of its 30-day SEC yield. The 30-day SEC yield is a measurement of the fund’s current earnings over the last 30 days, subtracting any of the expenses the fund has incurred, and then expressed as a yield. This allows us to know if, in the last 30 days, the fund has readily achieved or covered its yield from the income, distributions, and capital gains that it has achieved over that timeframe. PFFA has not.
Furthermore, when we look into the fund’s history, we can see that they did not cover their yield for the annual period going from October 2024 to October 2025 either. The fund generated a net investment income of $98 million and realized trading gains of $32 million but paid out $148 million in distributions, overpaying by $18 million. These figures include any gains from their active trading and options trading.
This means that management was well aware they were overpaying when they hiked the distribution in 2026. The question remains how much they are willing to fall behind in their distribution coverage before they are either forced to do another cut or stop growing their distribution.
This is one major risk area when it comes to investing in funds versus buying the individual securities yourself. Fund managers are not necessarily aligned with you personally because they receive revenue tied to the size of the fund, and a high yield above what you can readily find in the preferred security space will attract more investors to invest in PFFA, thus growing their management fees. The management team is incentivized to overpay to maintain that higher yield. The fund itself attracted over $550 million worth of new investment in 2025, meaning that while assets under management are growing and the management fee is growing, even if the fund itself can’t afford the distributions it’s paying.
One does not have to look beyond Oxford Lane Capital Corporation (OXLC) or Eagle Point Credit Company Inc. (ECC) to understand the dangers of overpaying a distribution to attract investors to a high yield. Once the music stops, the damage falls out. Thankfully, PFFA is an ETF and cannot trade at the same extreme discounts or premiums that closed-end funds like Oxford Lane and Eagle Point Credit can. Over-distributing your earnings still leads to NAV erosion regardless.
PFFA is designed to provide a high level of recurrent income today, even if that income isn’t covered by the net investment income and the capital gains of the fund itself.
This makes the fund extremely attractive to income investors who are not particularly concerned about overall total return or capital preservation. This goes against the very fundamental process that we follow in Dividend Kings.
We are focused not just on capital preservation but also on capital gains on top of the dividends we receive. PFFA works as a diversification tool to gain exposure to a wider array of preferred securities, but not as a replacement for individual preferred security holdings we have within our Model Portfolio. We can get a slightly lesser yield but significantly greater levels of capital preservation and capital gains from our own investing activity, just like you can by investing in high-quality individual preferred securities.
One should not accept a fund manager overpaying the distribution to attract new investors to enrich themselves at the expense of their own capital eroding over time.
This is the dichotomy that exists within PFFA. It vastly outperforms the standard index while duplicating its fundamental flaw. On one hand, investors receive wonderful and strong income in the present from it. But on the other hand, you’re accepting that the capital you’re putting in there is going to be eroded because of the misalignment that management has with shareholders.
I can already hear some of you jumping to the comment section to disagree with me and say that Jay Hatfield, the portfolio manager, has readily said that he has a vast majority of his personal net worth invested in PFFA. That’s a great marketing tool for him, but you have to remember he doesn’t just receive the distributions that you do. He also receives the management fees from you. So he is willing to accept a 15% loss in capital value because he’s collecting significant sums of management fees on top of that as well.
PFFA also works well for investors who want exposure to preferred securities but still lack the basic understanding of how the sector works. It outperforms the passive index tracking PFF and provides a similar level of capital preservation. It does. This means that if you are looking to just use an ETF to meet your needs in this sector, PFFA is a no-brainer choice compared to PFF. I would encourage you, though, not just to stop there, but to gain a personal knowledge base and exposure to how preferred securities work and your own personal risk tolerance so that you can use PFFA as a temporary base to springboard into the deeper pool of understanding.
PFFA is designed to meet a particular niche desire that is extremely popular on Seeking Alpha, if not elsewhere on the Internet. Investors who are looking for strong income opportunities can use PFFA to meet that income desire while accepting that it is not going to provide any greater degree of capital preservation than PFF.
Individual investors would tremendously benefit from learning how to invest in individual preferred securities on their own, whether they seek out that knowledge through articles on Seeking Alpha, other places on the Internet, or the Preferred Security Primer within Dividend Kings.
You can generate a similar yield with a higher degree of capital preservation as a manager of your own portfolio, completely aligned to your own goals. The biggest issue when investing in a fund is recognizing that management is not strictly aligned with your benefit but benefits from growing the fund, even if it is at your expense.
Over the long term, PFFA has outperformed PFF and provides an easy exposure to preferred securities for novice investors, retirees, and those seeking a higher degree of recurrent income and potentially less capital risk than investing in common equity or debt. However, investing in preferred securities is a tradeoff. You receive higher yields now and less potential capital gains in the future.
The current environment gives some positive room for PFFA. If management effectively benefits from the unchanged interest rates we’re seeing right now by trading into those holdings that will benefit from the potential hikes in the future, then the distribution may be covered in 2026 when it wasn’t in 2025. The risk is that management gets caught flat-footed and they’re not able to adjust, or they make the wrong call. If they move into more floating-rate securities and interest rates decline, their holdings and their revenue will fall. If they move into fixed-rate holdings and interest rates are hiked. They may again see the same issue.
With a high turnover ratio, management does not regularly hold positions for long periods, unlike most preferred security investors. I don’t expect management to cut the distribution in the near term. They may be forced to in the long term because of overpayment. In the short term, it is too effective as a beacon to draw in new capital. I would not hold my breath for any sort of large distribution hike from them, given the fact that they are knowingly overpaying already. As long as the yield is attractive to investors and capital keeps pouring in, then the distribution will stay put.

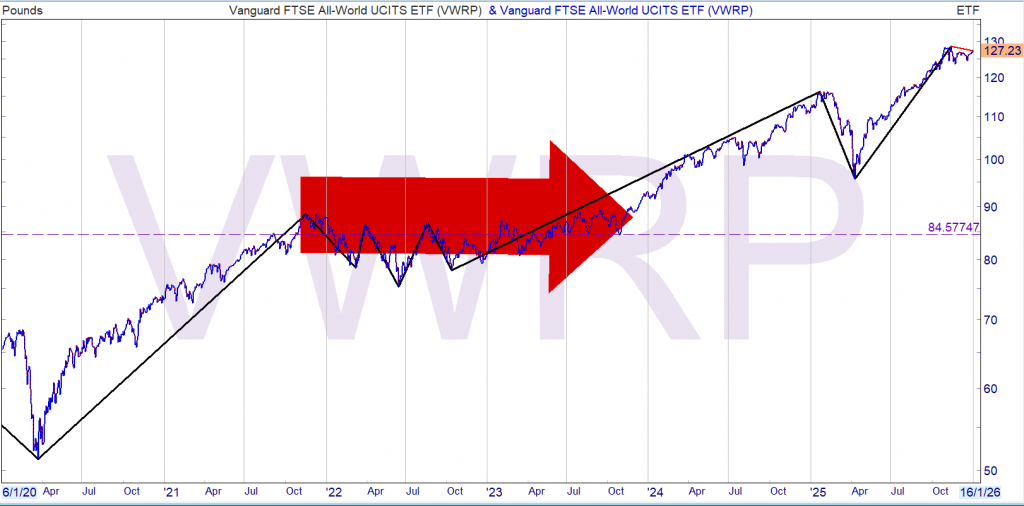
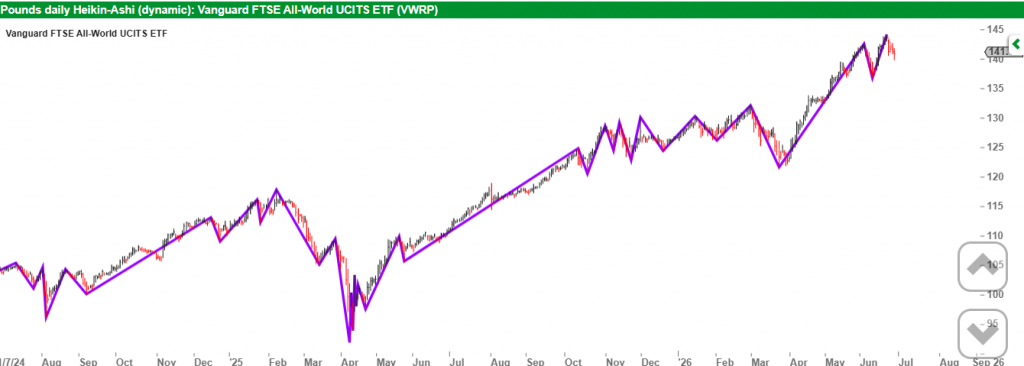
2 years of no growth could make a big hole in your retirement plan.
The ETF Bubble Nobody Is Talking About
VWRP is used as the comparison share to the SNOWBALL. It’s not a recommendation to buy, other ETF’s/Shares are available.
Roasting someone or something means delivering a sharp, humorous insult—a joke that lightly (or sometimes brutally) mocks a person, idea, or object in a way meant to entertain others. The key is that the “burn” is intentional, witty, and usually exaggerated.
Roasting is playful or harsh teasing, often done publicly, where the goal is to embarrass the target a little for comedic effect. It’s not meant to be taken as literal hostility—though tone and context matter.
(See previous post)
The three options for your retirement fund.
Buy an annuity, not a option for this blog as you have to surrender your capital.
Grow your Snowball and live off the dividends, with the intention of never selling any shares to raise cash.
Use the 4% Rule.
The SNOWBALL will have at least 11k to re-invest back into the SNOWBALL
The SNOWBALL has a comparison share VWRP, the comparison being that you use the ETF for withdrawing 4% (inflation linked).
The current value of VWRP is £169,226, not too shabby.

The SNOWBALL current income 11k.
VWRP income using the 4% rule £6,769
If we now compound for ten years, the SNOWBALL should have income of 22k, 22% pa.
To receive 22k of income from VWRP the total would need to be 550k.
GL with that luck.
Note anyone joining in a bull market nearer to the end than the beginning is likely to lose money.
© 2026 Passive Income Live
Theme by Anders Noren — Up ↑