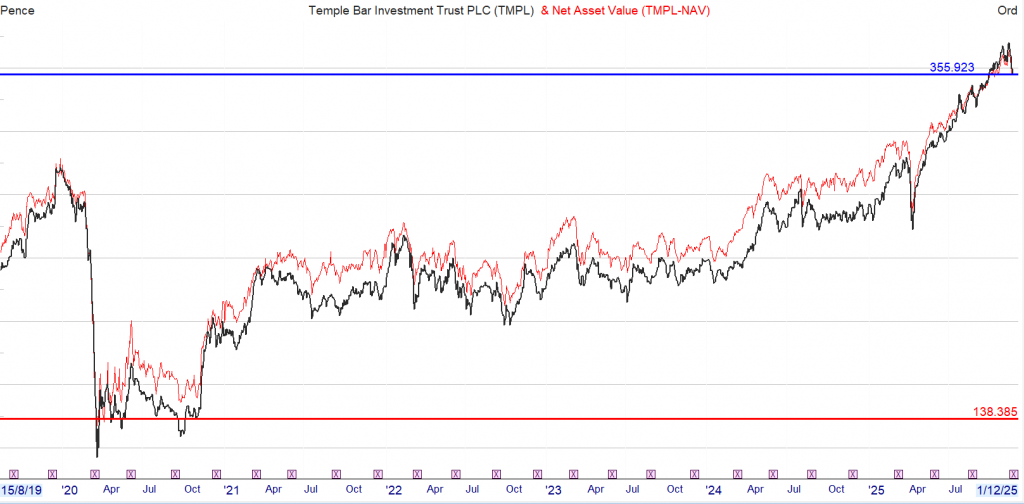
Temple is the Snowball’s pair trade, where a Trust with a lower yield is traded with a Trust with a higher yield to maintain a yield of around 7%.
Buying a Trust to make a capital gain near or at the end a bull market is and always will be a gamble.
Maybe if there is a Santa rally, last years was a damp squib, the Trust could be sold at a profit. If not as the dividends are received, part will be invested into TMPl, so a falling market would be a positive.
The first dividend of £30 has been earned, many a mickle makes a muckle.
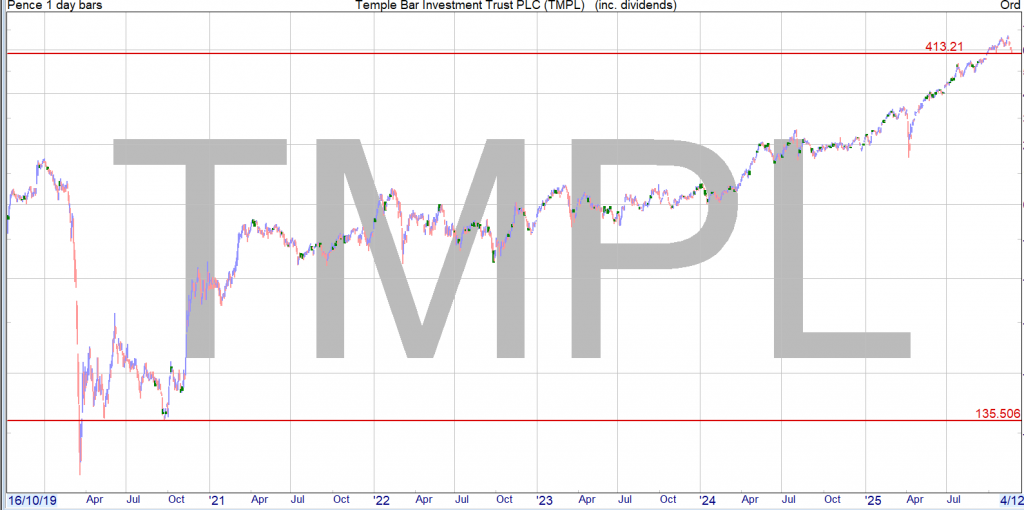
Historically anyone who bought has outperformed the market and the share may do again, having achieved the holy grail of investing in that you could take out your capital and invest into a higher yielder and retain the remaining shares and try to do it all over again.
Current yield 3.1%
Dividends included and re-invested into a higher yielder.
At the low the dividend yield was 7.5% and is currently 8% on buying price.
Trading Update for Q3 2025 and Unaudited Net Asset Value
Foresight Solar, the fund investing in solar and battery storage assets to build income and growth, announces that its unaudited net asset value (NAV) was £564.5 million at 30 September 2025 (30 June 2025: £603.8 million). This results in a NAV per Ordinary Share of 102.1 pence (30 June 2025: 108.5 pence per share).
Summary of key changes
Item
p/share movement
NAV on 30 June 2025
108.5p
Interim dividends paid
-2.0p
Time value
2.1p
Power price forecasts
0.1p
Project actuals
-0.4p
REGO price forecasts
-1.3p
Inflation
0.5p
Portfolio discount rate adjustments
-1.4p
Share buyback programme
0.1p
Tax review adjustments
-3.6p
Other movements
-0.5p
NAV on 30 September 2025
102.1p
Moderately higher power price forecasts across the middle and the long end of the UK curve, along with mostly flat curves in Spain and Australia led to an upside of 0.1 pence per share (pps) to NAV.
Unplanned distribution network operator (DNO) outages in the UK and curtailment in both Spain and Australia affected electricity production in the three months between July and September. Project actual performance, therefore, resulted in a negative impact to NAV of 0.4pps.
Updated pricing to reflect independent consultant’s forecasts for Renewable Energy Guarantees of Origin (REGO) certificates culminated in a 1.3pps downside.
Inflation assumptions have been updated, with the 2026 RPI forecast increasing to 3.5% from 3.0%, and 2025 CPI updated to 3.5% to bring it closer to actuals, making up the positive 0.5pps effect to NAV.
The discount rate applied to the Australian assets was raised by 165 basis points (bps) to reflect feedback from the recent sale process. This is indicative of values bidders are using when pricing standalone solar portfolios in what is currently a buyer’s market where no pure play solar deals have taken place for more than 12 months. This adjustment resulted in a negative impact to NAV of 1.3pps (included in the broader portfolio discount rate adjustments).
For the Spanish portfolio, discount rates were raised by 75bps to reflect inferred pricing from recent transactions. During the period, the investment manager adjusted the methodology for Spanish power price forecasts, incorporating a third consultant into the blend and aligning it with the process used for the UK. The net impact of these changes was 0.1pps (included in the broader portfolio discount rate adjustments).
The Company continued its buyback programme, repurchasing roughly 3 million shares, returning £2.8 million to shareholders, and adding 0.1pps to NAV in the third quarter of 2025. Since repurchases began, they have delivered a cumulative 2.9pps increase in NAV.
Foresight Solar, with the support of a leading tax advisor, has engaged with HM Revenue & Customs in respect of its group tax structure. This process has been productive in respect of achieving an agreed position for historic tax submissions and providing clarity for tax obligations going forward. Having reached this agreement, however, the current best estimate of tax forecasts indicates that future tax payments will need to be increased, leading to a 3.6pps downside adjustment to NAV. The board has opted to include this estimate in this quarter’s update, consistent with the Company’s transparent approach. To the extent required, the directors will announce any future updates to the market.
Other movements include working capital adjustments, foreign exchange fluctuations, minor adjustments to contract values, and a de minimis change to the valuation of Foresight Solar’s pre-construction battery storage project, Clayfords.
Commenting on the third quarter net asset value movements, Tony Roper, chair of Foresight Solar, said: “The valuation reductions and the tax review are disappointing for us and shareholders. This quarter’s challenging news compounds a difficult year for the renewable energy investment trust sector, with a difficult macro environment, a volatile regulatory landscape and frustrating share price performance.
“Operational performance year to date is in line with budget, giving us confidence in achieving our dividend cover target for this year.
“We continue to analyse options available to deliver the best potential outcome for investors. In the meantime, we are focused on addressing the share price discount to NAV. Divestment processes are ongoing, with the aim of unlocking capital, we continue to return cash to shareholders via one of the largest buybacks in the sector relative to NAV, and we are committed to paying down debt further.”
Trading update
Electricity production from the global portfolio was 6.3% below budget in the third quarter, despite irradiation 3.6% above base case.
In the UK, DNO outages hampered generation, which was 1.8% under budget, whilst irradiation was 6.9% higher than expected. Stripping out the effects of grid interruptions, production would have been in line with forecast.
Curtailment was a challenge in both Spain and Australia, with generation 17.9% and 4.4% under budget, respectively.
Divestment update
The process to sell the Australian assets has been paused. A small number of bids for the entire portfolio were received, but, upon thorough investigation, none were deemed deliverable. The directors have, therefore, decided to review whether the portfolio can be re-positioned before re-assessing with the investment manager and advisors when to restart the process. In the meantime, the investment manager is focused on refinancing the portfolio and progressing the two co-located BESS projects.
The investment manager is also overseeing sales processes currently underway for the additional 75MW of operational solar assets marked for disposal and the board will update investors in due course.
Gearing
The Gross Asset Value (GAV) on 30 September 2025 was £969.4 million (30 June 2025: £1,005.6 million), with total outstanding debt of £404.9 million representing 41.7% of GAV (30 June 2025: £401.8 million and 40.0%) – comfortably within the 50% limit.
At 30 September 2025, the RCF balance was £91.7 million drawn (30 June 2024: £75.9 million), reflecting working capital requirements and pending cash receipts from the portfolio after the summer. After post-period distributions from the projects, the revolving credit facility was repaid, and the drawn balance is currently £72.7 million.
ROC and FIT consultation
On Friday, 31 October 2025, the UK Department for Energy Security and Net Zero unveiled proposals to revise the inflation indexation of the Renewable Obligation (ROC) and Feed-in Tariff (FIT) schemes. These changes have the potential to impact future revenues for operating UK solar projects and dampen investor confidence in the country’s renewable energy sector.
The document outlines two approaches under consideration:
· Option 1: An immediate revision to the date of the switch from Retail Price Index (RPI) to Consumer Price Index (CPI), bringing it forward to April 2026 from April 2030.
· Option 2: A temporary freeze in indexation to allow for a gradual realignment with CPI. The retrospective calculation of indexation would mean a realignment only happens in the mid-2030s.
Modelling the potential impact of these changes on the Company’s latest Net Asset Value (NAV), option 1 would be equivalent to a downside impact of c.1.7 pence per share or 1.6%. In the more aggressive option 2, the effect is c.10.4pps or 10.2%. (Estimates are based on information currently available and may evolve as the consultation progresses.)
The board is disappointed in the proposals. The inflation linkage embedded in the ROC and FIT schemes is a core component of the investment case for many operational assets in the UK. The Board will urge the government to carefully assess the likely impact of these proposed changes on investor confidence. This is particularly important at a time when increased investment is essential to achieving growth targets and securing the necessary build-out of renewable generation to support energy security and affordability, and to meet net zero goals.
When investing, your capital is at risk. The value of your investments can go down as well as up and you may get back less than you put in.Read More
The content of this article is provided for information purposes only and is not intended to be, nor does it constitute, any form of personal advice. Investments in a currency other than sterling are exposed to currency exchange risk. Currency exchange rates are constantly changing, which may affect the value of the investment in sterling terms. You could lose money in sterling even if the stock price rises in the currency of origin. Stocks listed on overseas exchanges may be subject to additional dealing and exchange rate charges, and may have other tax implications, and may not provide the same, or any, regulatory protection as in the UK.
Real estate investment trusts (REITs) are often known to offer attractive income payments to investors. To maintain favourable tax treatment, the trusts have to pay out a high proportion of their profits to shareholders. However, when I saw a REIT with an incredibly high yield, I wanted to see if it really was sustainable or not.
Company details
I’m talking about the Regional REIT (LSE:RGL). As the name suggests, the property portfolio is primarily in regional UK centres, outside the M25 motorway. In case Londoners forget, there is a world outside of Zone 5!
Should you buy Regional REIT Limited shares today?
One unique feature about the REIT is that it holds a mix of office, industrial, retail, and residential properties. Typically, other REITs would focus on just one area of the market. Yet, like other companies in the sector, Regional REIT makes money through long-term rental agreements. This is a key element that makes cash flow strong, which ultimately should translate to making the dividend streams predictable.
Please note that tax treatment depends on the individual circumstances of each client and may be subject to change in future. The content in this article is provided for information purposes only. It is not intended to be, neither does it constitute, any form of tax advice.
A generous dividend yield
At the moment, the yield stands at 9.45%. Over the past year, the share price has fallen by 18%. This is one reason why the yield has risen. After all, the dividend yield is calculated from the dividend per share and the share price. So if the stock falls, it acts to push up the yield. Although some might see this as a red flag.
The yield might be high, but in the latest half-year report from September, management said the dividend was fully covered. This means the income paid is taken from earnings, with earnings alone sufficient to pay the dividend. This shows that it’s sustainable and not stretching the company.
Looking ahead
The September update provided several signs that the dividend could be sustainable. There is strong lease activity, with the firm recently securing new lettings and lease renewals. For example, it reported £1.6m of new or renewed rent, beating their estimated rental values.
Further, the team has a process of selling non-core assets. This generates cash that can be used to reduce debt or reinvest in higher-return properties.
One risk I do see is the ongoing work on debt refinancing. A major debt facility matures in August 2026, and if interest rates remain high or financing conditions tighten, refinancing could be expensive or difficult.
Even with this concern, I don’t think the yield is too good to be true. As a result, I think it’s an income stock for investors to consider as part of a broader diversified portfolio.
Wall Street Panics, Powell Cooks, Chef’s Kiss for THIS 12.9% Dividend
Brett Owens, Chief Investment Strategist Updated: November 19, 2025
Jerome Powell is preparing a wonderful holiday income dish for us.
The economy is running hot and he’s cutting rates anyway. Oh baby! “Lame Duck Jerry” is finally starting to cook.
But vanilla investors aren’t having it. They’re sprinting from the table! Recession fears dominate the headlines, even though the data scream otherwise.
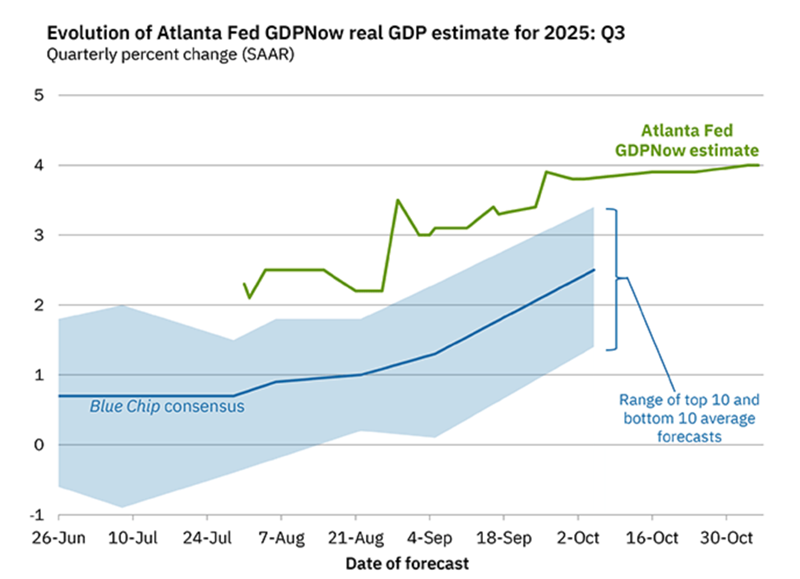
The Atlanta Fed’s thermometer has GDP at a sizzling 4%. Four percent! In today’s AI-fueled, efficiency-obsessed economy, the old recession playbook simply doesn’t apply.
AI is eating traditional white-collar work. Business models from 2019 no longer apply in 2025. Some sectors are struggling while others hit new strides. It’s a winners-and-losers economy—and investors are still squinting at discolored, outdated AAA maps !
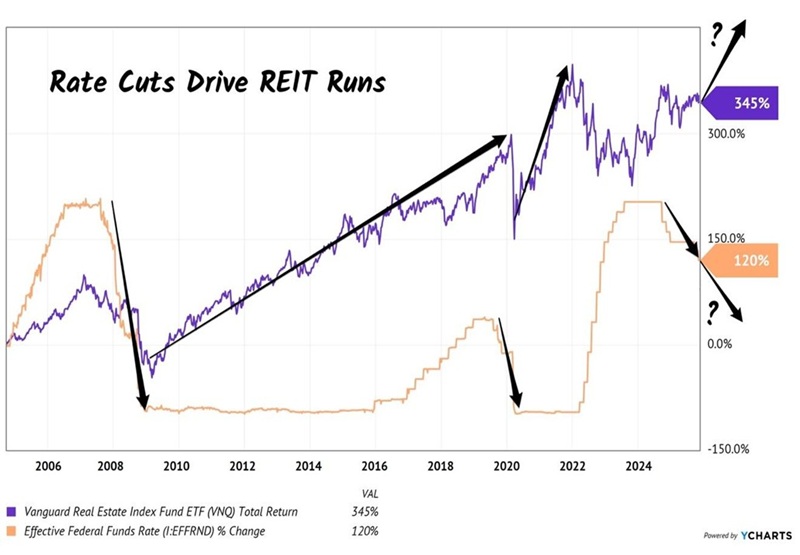
But one maxim still rules: As rates fall, REITs rise.
Over the last 20 years, we’ve had two major rate-cut cycles. Both kicked off monster REIT bull markets. The new cycle could be the biggest yet because unlike 2008 or 2020 the economy is growing, not shrinking.
Rate Cuts Kick Off REIT Bull Markets
Meanwhile, that “safe 4%” money-market yield everyone fell in love with? It’s going away. Every Fed cut pushes more idle cash into the market, searching for yields with actual staying power. REITs, obligated to hand 90% of their income to us, thrive in times like these.
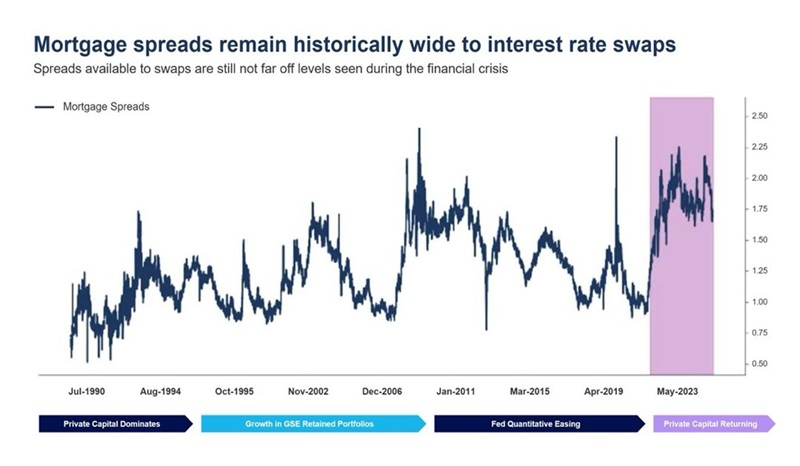
And select mortgage REITs (mREITs) are set up for big payouts and price gains. These financial “landlords” own government-backed mortgages that rise in value as long-term rates fall. This is an interest-rate trade rolled up in a dividend wrapper. Tasty.
While vanilla investors fret over imaginary recessions, Annaly Capital (NLY) licks its chops. Few companies benefit more from falling rates than NLY.
And we’ve only seen mortgage spreads this wide a few times in the last quarter-century. Each time, NLY rallied.
Why? Annaly leans in when others panic. Management buys high-quality government-backed (“agency”) mortgages when spreads explode. It buys low then waits for yields to normalize, which boosts book value. So, of course, its stock takes off.
The normalization has already begun, with mortgage rates falling from north of 7% to the low 6s. Every tick lower boosts the value of Annaly’s portfolio (yields down, bond prices up!). And these are Fannie and Freddie-guaranteed bonds (“agency” paper)—no credit risk.
The company already has more than enough core earnings to cover its dividend ($0.73 in earnings per share versus $0.70 paid out last quarter). But with rate cuts shrinking NLY’s cost of funds and fattening its net interest margin, more earnings could boost NLY’s 12.9% dividend again!
Annaly’s Big Quarterly Dividend
But please note, not all mREITs are created equal. It’s a complex business requiring specialized expertise. Fortunately, Annaly is a big, seasoned operator holding guaranteed agency paper. Other mREITs often hold sketchy commercial mortgages—office loans tied to struggling tenants and illiquid credit bets. Why take that risk when you can have Annaly?
Bottom line is that rate cuts create winners and losers, just like the 2025 economy has. Don’t overthink it. Buy the proven playbook.
My only nit pick with NLY? It pays quarterly, not monthly!
For example only. take a look at these 5 incredible funds that pay monthly and soar:
This is the key to a true “9% Monthly Payer Portfolio” – banking enough yields to live on while steadily growing your capital. It’s literally the difference between dying broke and never running out of money!
Here’s the proof, from our friends at Hartford Funds.
Hartford looked at the years between 1960 and the end of 2024, which included everything: the inflation of the ’70s, economic crashes in 2001 and 2008 and, of course, the pandemic.
Here’s what they found: if you’d put $10,000 in the S&P 500 in 1960, you would have had $982,072 at the end of the period, based solely on price gains.
That’s not bad: a 9,721% increase.
It shows you why most folks only think about share prices when they invest. After all, with a gain like that, it’s tough to get excited about a dividend that dribbles a few cents your way every quarter.
But here’s the thing: when you reinvest your dividends, the magic of compounding kicks in. The difference is shocking: your $10,000 would have grown to $6,399,429, or more than $5.4 million more than you’d have booked on price gains alone!
That’s a 63,894% profit.
It’s a crystal clear example of how critical dividends are. And you can grab stronger profits if you buy stocks whose dividends aren’t just growing but accelerating.
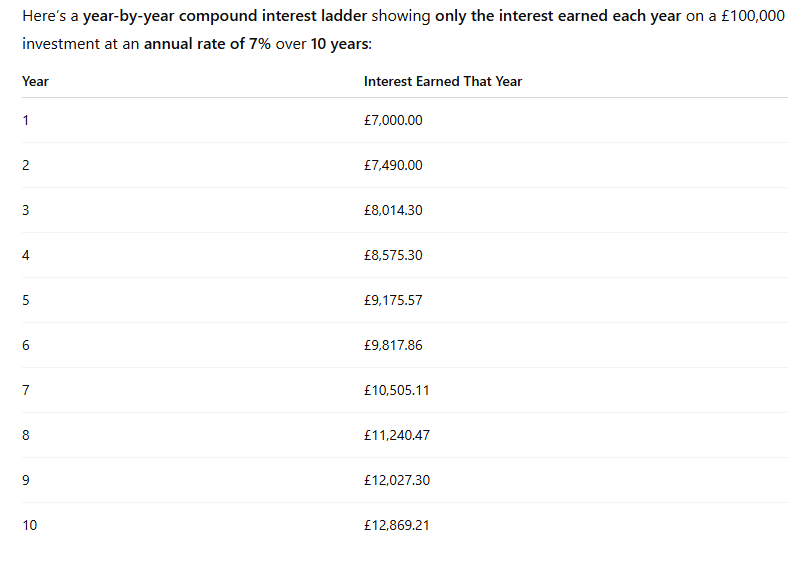
The good news is, if you are just starting out on your dividend re-investment journey, compound interest takes time to make a noticeable difference, so hopefully you will have more invested, when it does.
The current plan
On course to complete the plan before year ten, the target for 2026 may be increased to £10,500 but only if the dividends are repeatable, of course no dividend is ever 100% completely secure.
At this time it seems like WordPress is the preferred blogging platform out there right now. (from what I’ve read) Is that what you’re using on your blog?
The second top pick comes from JP Morgan, which has Primary Health Properties (LSE:PHP) in its sights. This unique real estate investment trust (REIT) landlord owns one of the largest portfolios of properties used by private healthcare professionals as well as the NHS. Think GP surgeries, pharmacies, dental clinics, etc.
With the bulk of its leases government-backed, the company’s long since enjoyed highly stable and predictable cash flows linked to inflation. And subsequently, management’s been able to deliver dividend hikes for more than 25 consecutive years.
Like many REITs, Primary Health Properties has seen its share price come under significant pressure in recent years. After all, higher interest rates don’t exactly create an ideal environment for landlords with lots of mortgage debt.
Nevertheless, given the nature of the firm’s clientele and the perceived strength of its cash flows, the analysts at JP Morgan have put their share price target at 114p. Compared to where the stock trades today, that’s a 17% potential capital gain paired with a tasty-looking 7.3% dividend yield.
However, there are still some crucial risks to consider.
Having the NHS as a primary tenant can be advantageous. But it also means that budget cuts and policy changes can be quite disruptive. It could even lead to lease agreements not being renewed. And since finding new tenants for specialised healthcare facilities isn’t easy, occupancy could come under pressure along with cash flows.
When investing, your capital is at risk. The value of your investments can go down as well as up and you may get back less than you put in.
The content of this article is provided for information purposes only and is not intended to be, nor does it constitute, any form of personal advice. Investments in a currency other than sterling are exposed to currency exchange risk. Currency exchange rates are constantly changing, which may affect the value of the investment in sterling terms. You could lose money in sterling even if the stock price rises in the currency of origin. Stocks listed on overseas exchanges may be subject to additional dealing and exchange rate charges, and may have other tax implications, and may not provide the same, or any, regulatory protection as in the UK.
Over the last six months, the FTSE 250 has enjoyed some strong performance, climbing by more than 14%. However, not all of its constituents have been so fortunate, such as Primary Health Properties (LSE:PHP).
Like many other businesses in the real estate sector, the healthcare-focused landlord has suffered from generally weak investor sentiment, resulting in the share price slipping back below £1. Yet despite this, dividends have continued to flow. And as a result, the REIT now offers a tasty-looking 8% dividend yield.
Please note that tax treatment depends on the individual circumstances of each client and may be subject to change in future. The content in this article is provided for information purposes only. It is not intended to be, neither does it constitute, any form of advice.
Impressive dividends
As a quick crash course, Primary Health Properties is one of the biggest healthcare landlords in the UK. It owns and leases a diversified portfolio of GP surgeries, pharmacies, and dental clinics primarily to the NHS.
With a government entity being one of its largest tenants, the company has enjoyed fairly resilient and predictable cash flows over the years. And it’s one of the main reasons why, despite the challenges within the real estate sector, the group has continued to reward shareholders with ever-increasing dividends for more than 25 years in a row.
But if that’s the case, why are investors seemingly not rushing to capitalise on the stock’s impressive yield?
Headwinds and challenges
Even with a resilient business model, the group has encountered several challenges both internally and externally. It’s no secret that higher interest rates have created numerous headaches for property owners, especially REITs that often carry significant debt burdens.
In the case of Primary Health, the group’s rental cash flows have continued to grow steadily, but rising debt costs have increased the pressure on net earnings.
At the same time, management’s contending with some protracted rent increase negotiations with the NHS. Should these talks fail, its currently impressive 99.1% occupancy might start to slip alongside its net rental income. After all, finding new tenants in the healthcare niche can be a bit trickier compared to the residential sector.
With that in mind, it’s not surprising that investors aren’t as keen to buy shares while the macro environment remains unfavourable.
Still worth considering?
The continued pressure of financing costs and delays in rent revaluations indicates that margins are at risk of being squeezed. This could also hinder rental income growth, squeezing the coverage of existing dividends and any potential future growth.
Nevertheless, the business continues to have an ace up its sleeve. Primary Health ultimately benefits from structural long-term demand for primary healthcare infrastructure. And that’s an advantage that doesn’t change even during economic downturns.
The balance sheet does carry a large chunk of debt. But it appears to remain manageable. And with interest rate cuts steadily emerging, the pressure from its outstanding loans should slowly alleviate over time while simultaneously helping boost the value of its property portfolio.
That’s why, despite the risks, I think this FTSE 250 REIT’s worth a closer look
I’ve been doing a bit of research on the habits of successful passive income investors, and I came across a bit of a surprise
Yes, real estate has been profitable for a number of people. But I had a very shaky venture into it. And it has a fair few drawbacks for individual investors.
Not really passive
One is that many of us won’t have the capital to go for, say, rental properties. It’s not the kind of thing we can get started with just a few hundred pounds, like we can with a Stocks and Shares ISA.
It’s not entirely passive either. Finding tenants, collecting rent consistently, and maintenance all take time and effort. And the latter can sometimes prove very costly if you’re unlucky.
But there’s a way we can get into real estate without facing those major hurdles. And that’s to consider buying real estate investment trusts (REITs). They’re investment companies that put their money into various kinds of properties, and they do all the management. All we have to do is buy shares in them, just as we do with shares in general
Healthy property
I like Primary Health Properties (LSE: PHP), which invests in GP surgeries, pharmacies, dental clinics. Importantly, they’re mostly rented to the NHS on long-term leases.
Having the UK government as its main customer provides some stability and predictability. But it hasn’t made the trust immune to weak property values in recent times. Over the past five years, the PHP share price has fallen 35%.
Higher interest rates are a burden, especially with debt on the books. At the end of the first half this year, net debt reached £1,367m, up from £1,323m in December 2024. There doesn’t seem to be any liquidity problem, but it could keep the shares down for longer.
Big dividends
On the bright side, a lower share price means a bigger dividend yield. Right now, we’re looking at a forecast 7.3%. And analysts are forecasting rises between now and 2027. We could have long-term capital appreciation too — especially when interest rates fall.
There are plenty of other REITs to choose from, addressing different sectors of the property market.
Please note that tax treatment depends on the individual circumstances of each client and may be subject to change in future. The content in this article is provided for information purposes only. It is not intended to be, neither does it constitute, any form of tax advice.
Millionaire style
Quite a few millionaire investors also invest for deferred income. That is, they aim for total returns — capital and dividends — and plan to convert it to income later.