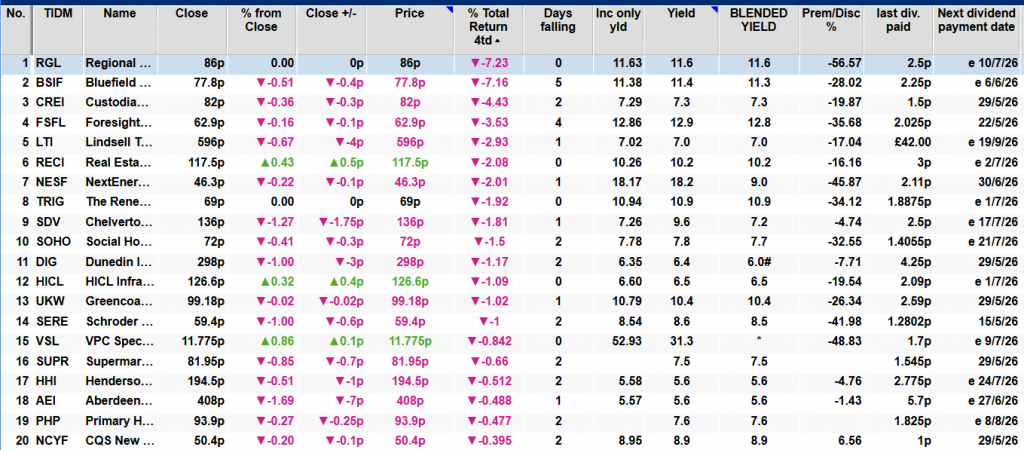
There will be 1k to re-invest in the SNOWBALL this week. I am content with all the current income projections so I can start to add some stability to the SNOWBALL by buying some bonds.
5 High‑Yield Bond Engine (Monthly) ETF s
Here are five of the strongest High‑Yield Bond “Engines” that pay monthly, drawn directly from current market data and UK‑accessible ETFs. Each one is a pure fixed‑income product with monthly coupon flow, not equity‑based covered‑call funds.
Top 5 High‑Yield Bond (Monthly) ETFs
1) Fidelity Enhanced High Yield ETF (FDHY)
Yield: ~10% total return over past year
Payout: Monthly (~$0.26–$0.27 typical)
Profile: Actively managed BB/B junk‑bond sleeve
Notes: Fee cut to 0.35% boosts net income
2) SPDR Bloomberg High Yield Bond ETF (JNK)
Yield: ~6.7% trailing
Payout: Monthly ($0.49–$0.56 typical)
Profile: Tracks Bloomberg HY Very Liquid Index
Notes: Concentrated in cyclical, comms, energy sectors
3) iShares iBoxx $ High Yield Corporate Bond ETF (HYG)
Yield: 6%+ SEC yield
Payout: Monthly
Profile: ~1,000 sub‑investment‑grade corporates
Notes: Long history of stable monthly distributions
4) iShares J.P. Morgan EM High Yield Bond ETF (EMHY)
Notes: Strong, consistent monthly distribution history
5) PIMCO US Short‑Term High Yield Corporate Bond UCITS ETF (STHY / SSHY)
Yield: ~6.9–7.0%
Payout: Monthly
Profile: Short‑duration HY bonds (lower interest‑rate sensitivity)
Notes: Available in GBP‑hedged, USD, and EUR‑hedged share classes
Quick Comparison Table (Yields & Risk Profile)
ETF
Yield
Duration
Region
Risk Level
Monthly?
FDHY
~10% TR
Medium
Global HY
Medium‑High
✔️
JNK
~6.7%
Medium
US HY
Medium
✔️
HYG
6%+
Medium
US HY
Medium
✔️
EMHY
~6.7%
Medium
EM HY
High
✔️
PIMCO STHY/SSHY
~7%
Short
US HY
Medium
✔️
Which one is the “Engine”?
If you want maximum monthly income, the hierarchy is:
FDHY → Highest income engine (active, strong yield)
PIMCO STHY/SSHY → High yield with lower duration risk
EMHY → High yield but higher EM volatility
HYG / JNK → Large, stable, core HY exposure
OR
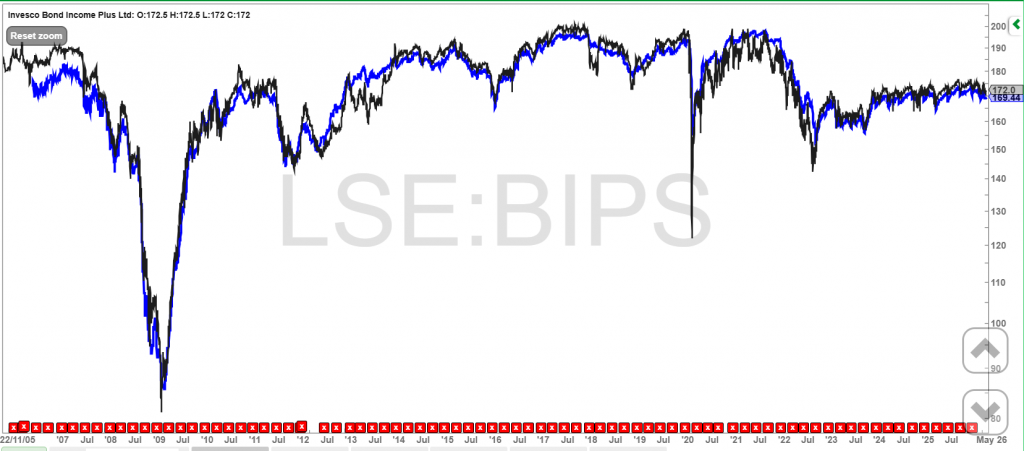
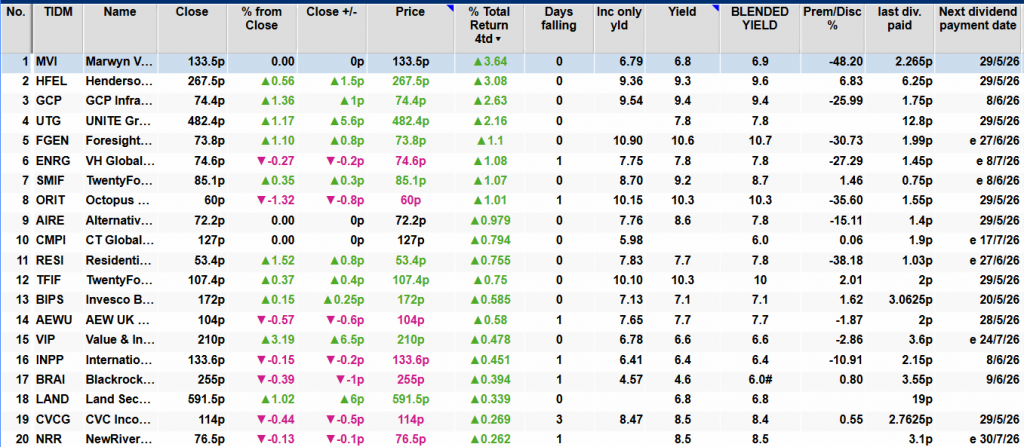
Looking at the chart, you can see that with BIPS there will be a capital drawdown in times of market stress.
Because the income is considered ‘safe’ it normally trades above its NAV.
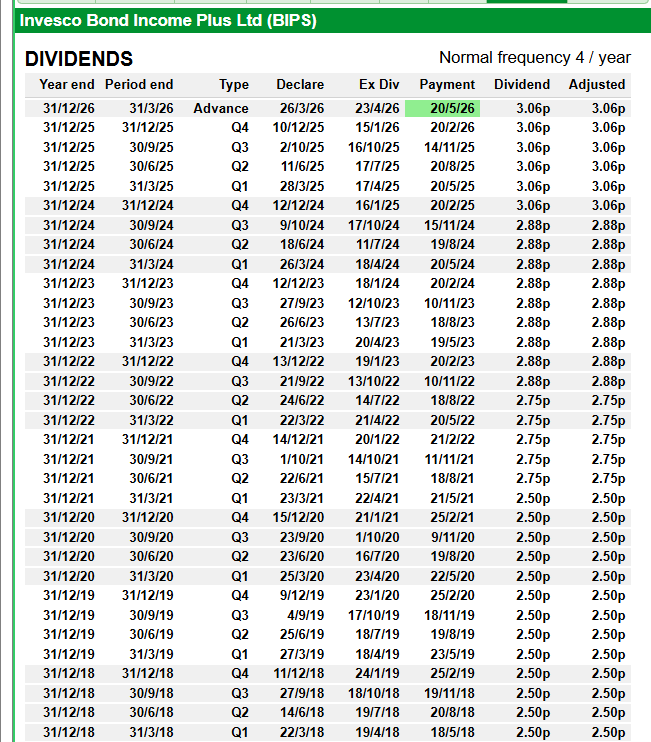
As recently as 2020 as the price fell and the yield rose, anyone who put on their big boy/girls pants and bought would be receiving a buying yield of 11% and a running yield of 7%.
As BIPS trades above its NAV, the choice can be made between an ETF and BIPS. As the SNOWBALL is going to build a position with earned dividends, if the price fell it would be a positive and not a negative.
But not junk bonds as that is the opposite to low risk.
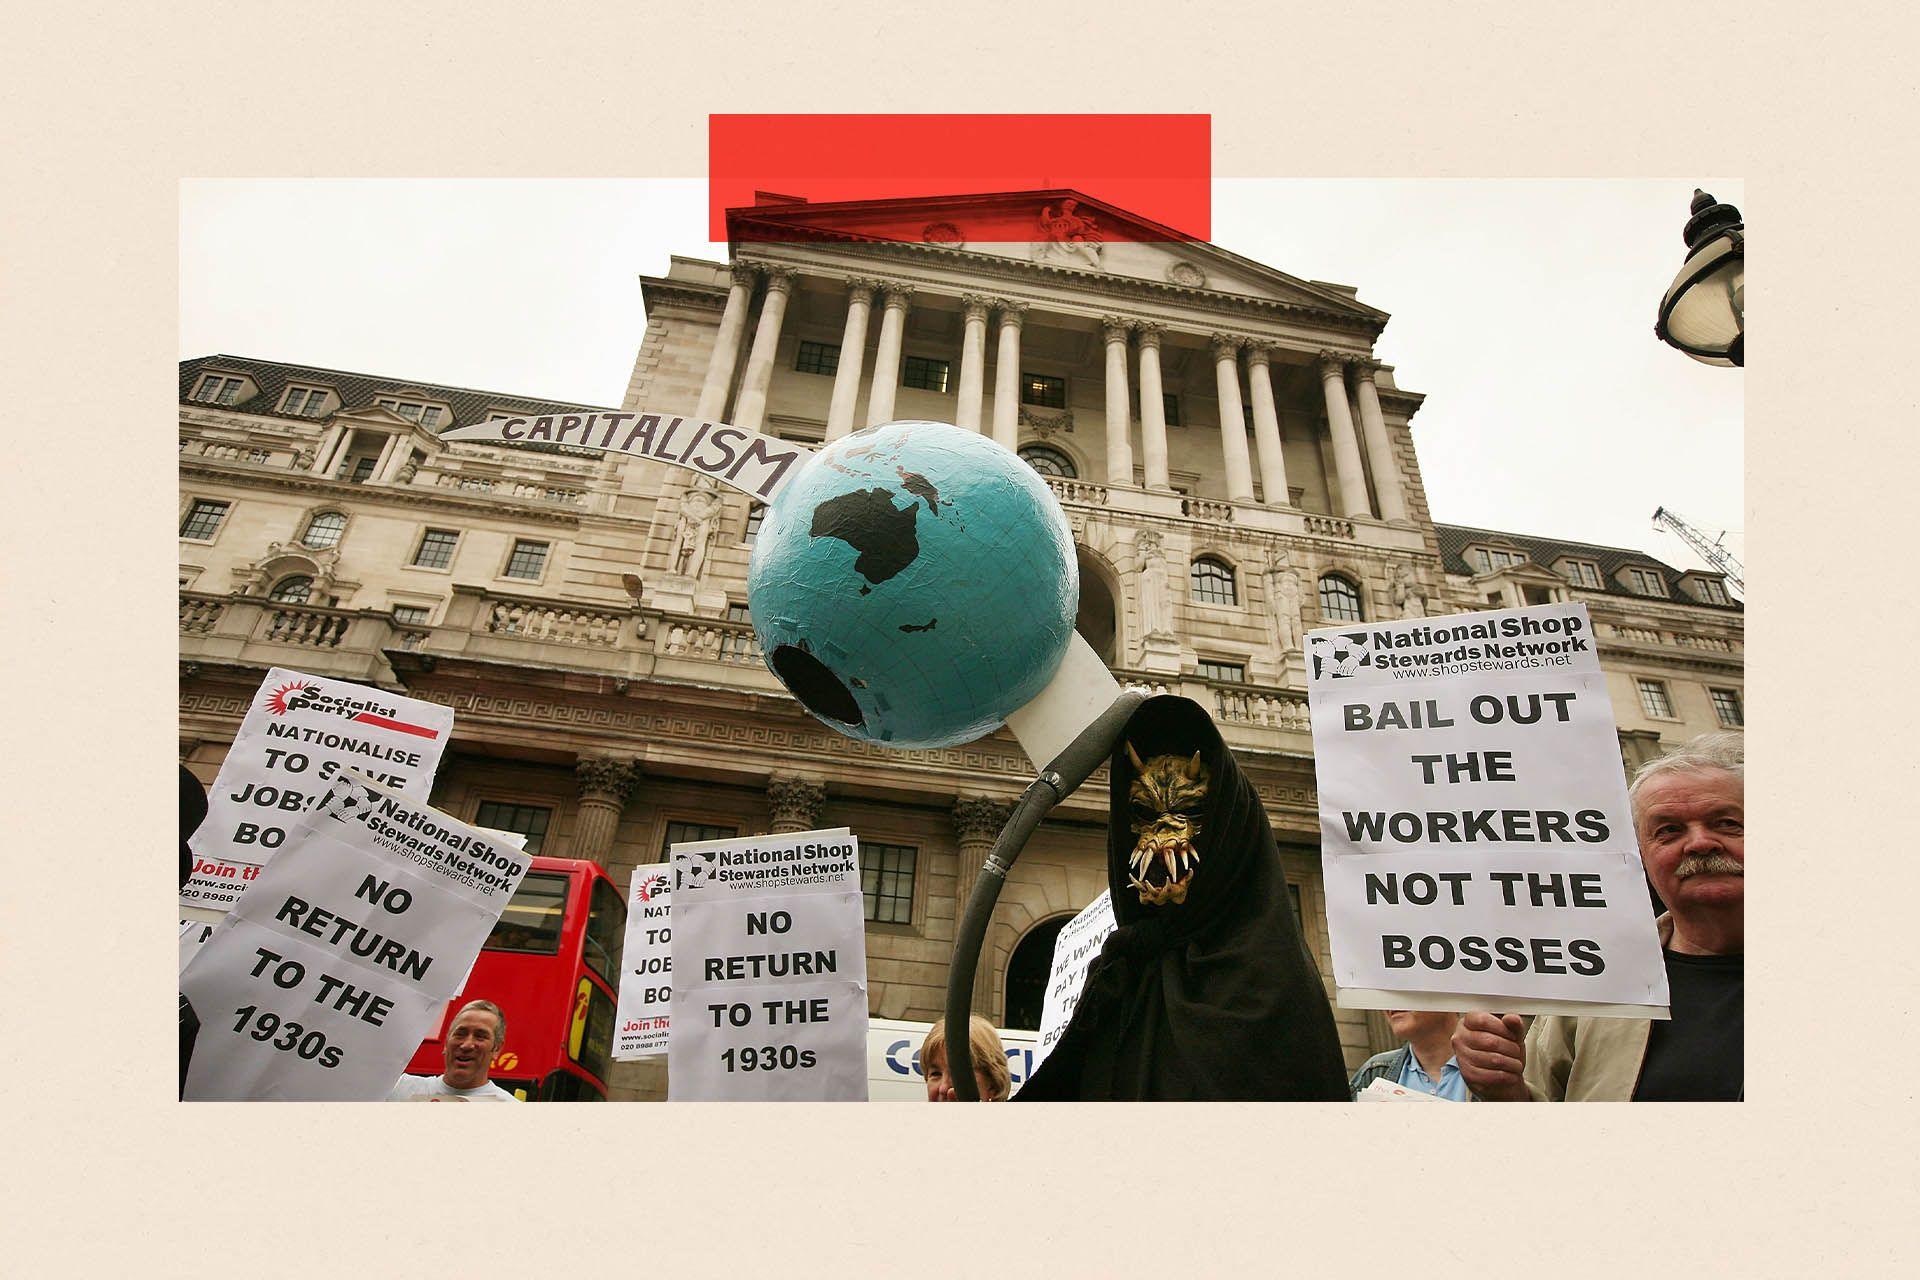
A fresh financial crisis may be coming – it won’t play out like the last one
Published 29 April 2026
BySimon Jack
Business Editor
On 15 September 2008, Bobby Seagull arrived at his office in Canary Wharf just before 6am.
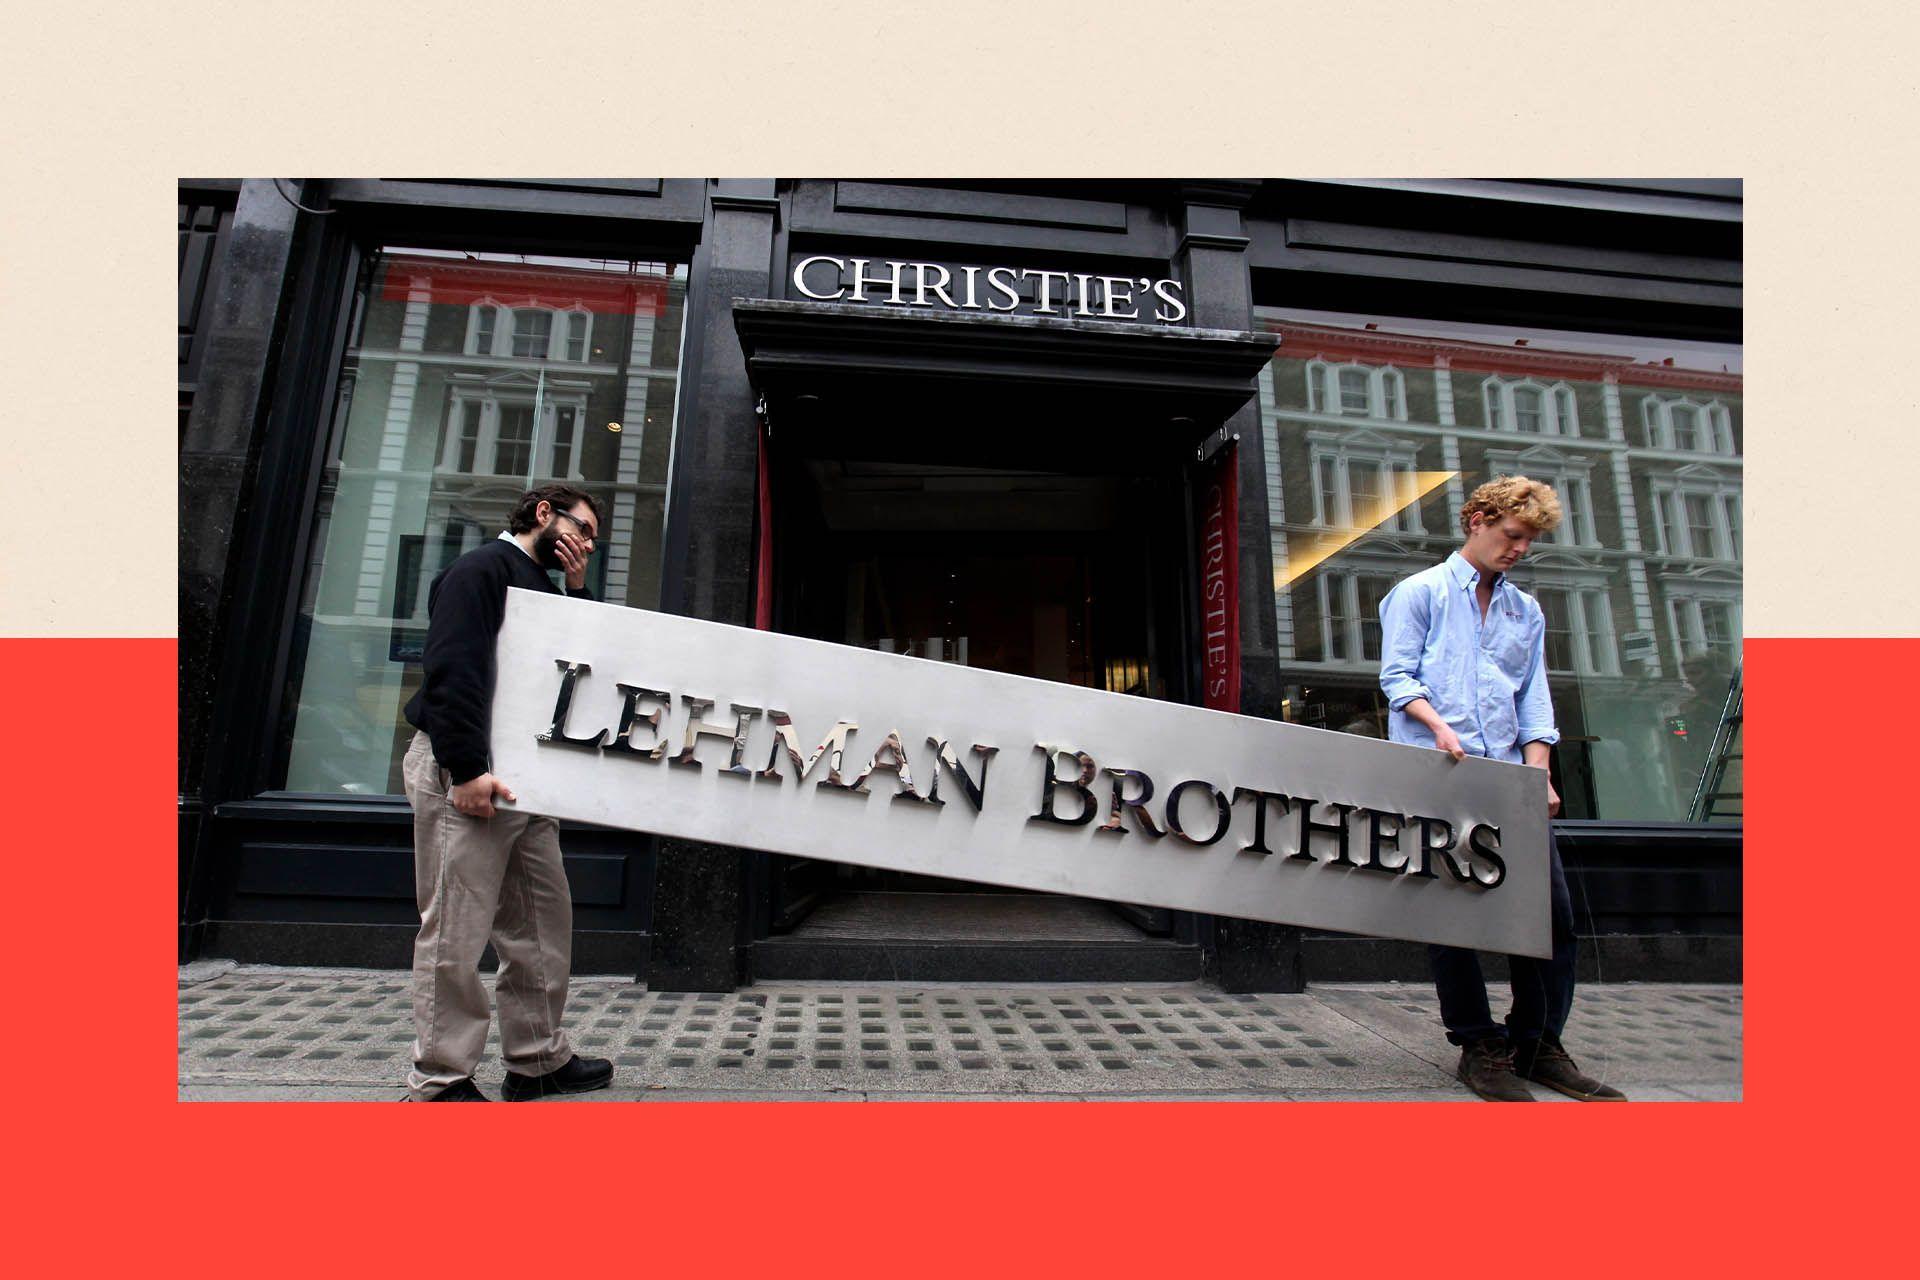
It was the last time he would need to be on time. He was a trader at Lehman Brothers, an American bank undergoing serious turbulence.
“We had seen on the Sunday news from America, they’re filing for bankruptcy. We weren’t quite sure [what] the implication was [for] us in the UK. So we were just told to turn up as normal.”
Initially it was “chaos”, Bobby says. “There was no direct communication with our American colleagues. They weren’t picking up the phones. Some people were picking up items, like paintings on the wall and saying, ‘They owe me shares’.”
Bobby had an inkling that disaster might strike and was well prepared.
“I actually bought a shopping trolley on the last day. And funnily enough, that summer, people did sense a bit of disquiet. I emptied my vending machine card, [worth] £300 pounds, on chocolates, because I realised if the vending machine or the bank collapsed, my vending machine card would become defunct.”
Bobby, along with thousands of colleagues, carried his career out in a cardboard box. It was a defining image of the global financial crisis which saw thousands of businesses fail and millions lose their jobs. It ushered in one of the longest and deepest recessions since World War Two.
Image caption,In 2008, investment bank Lehman Brothers filed for bankruptcy in the US
Now there are a number of warning lights flashing on the world economic dashboard that have some wondering whether we are in the foothills of another financial crisis.
What could the next meltdown look like? And with international relations in 2026 in a more febrile state than they were in 2008, will policymakers even have the tools to solve it?
Early warning signal
Before the crisis that engulfed the world economy in 2008, there were early warning signals in some parts of the financial system.
In 2007, investments in risky US mortgages went sour as homeowners struggled to pay. Funds run by Bear Stearns, BNP Paribas and other banks either had to freeze the ability of investors to take out their money, or liquidate the funds completely.
These problems were the canaries in what proved to be a very deep financial coal mine. As nervousness spread, even banks eventually stopped lending to each other for fear of not getting their money back, creating a so-called “credit crunch”. That caused a global financial crisis.
Image caption,A crisis engulfed the world economy in 2008
Fast forward to today.
Several funds which lend money have declared losses or restricted investors’ ability to take out their money. BlackRock, Blackstone, Apollo and Blue Owl have all faced demands for billions of withdrawals from private credit funds – institutions that provide an alternative to traditional banks.
Bank regulators and financial veterans recognise the similarities.
Sarah Breeden is the deputy governor of the Bank of England, with specific responsibility for financial stability. She says the new world of private credit has grown quickly, has yet to be tested by financial adversity and is poorly understood.
“There are echoes of the global financial crisis in what we’re seeing now,” she says. “Private credit has gone from nothing to two and a half trillion dollars in the last 15 to 20 years. There is leverage [borrowed money], there’s opacity, there’s complexity, there’s interconnections with the rest of the financial system. All of that rhymes with what we saw in the GFC.”
She’s also worried that a lot of the money lent by private credit funds has itself been borrowed, creating layers of debt – or leverage – that can amplify any losses.
“There is leverage on leverage on leverage. What we want to make sure is that everybody understands how that layer cake of leverage adds up.”
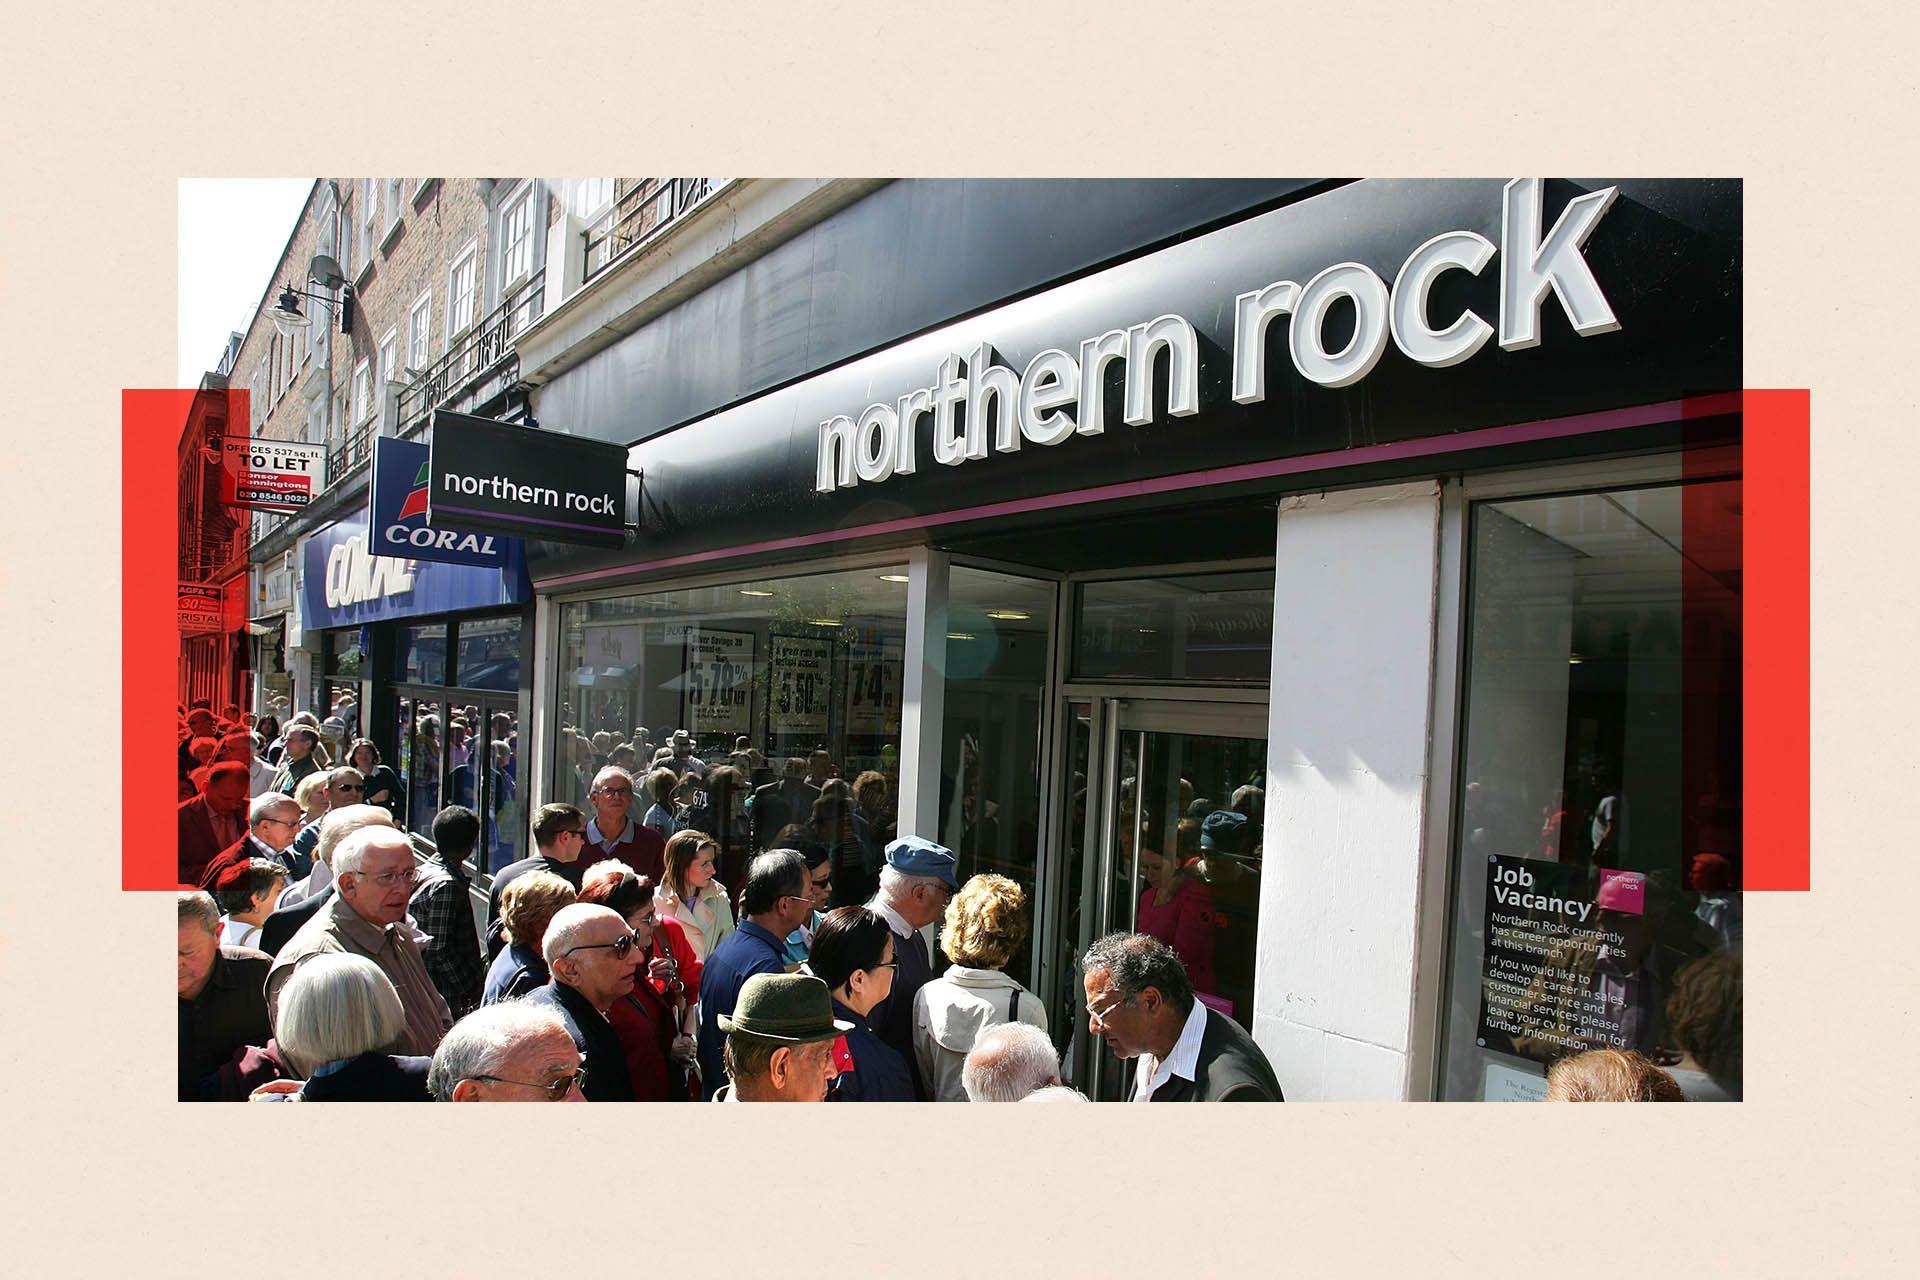
Image caption,In 2007 huge queues formed at Northern Rock branches as people tried to withdraw their money
Mohammed El-Erian, chief economic adviser to German financial firm Allianz and former CEO of PIMCO, the world’s biggest bond investor, agrees that the risk of another crisis is underestimated.
“There are certain similarities with 2007 that keep me awake at night. The similarities are clear fragilities in the financial system that are not properly appreciated.”
In fact, he says, it was the restrictions placed on banks after the crisis that gave birth to this new private credit market. Banks were forced by new regulations to be more cautious, so funds that mimicked banks sprang up to fill the void.
“Suddenly the system is flooded with private creditors wishing to give money to companies. Companies see all this money available and of course too much money makes people make mistakes.”
He lays out a scary scenario: “Suddenly everybody that lends you money wants their money back at the same time. The next thing you know, something that started out as a really good idea grows into something that risks instability, and rather than benefitting the economy, it actually risks pulling the rug out from under it.”
But Larry Fink, the boss of the world’s biggest money manager, BlackRock, recently told the BBC he did not agree that private credit posed a threat to the world economy.
The issues affecting some funds account for a small fraction of the overall market, he says.
BlackRock itself is one of several firms to have limited withdrawals by nervous investors from private credit funds. But Fink is adamant there is no chance of a repeat of the financial trauma seen in 2007-08, as he believes financial institutions today are more secure.
“I don’t see any similarities at all,” he says. “Zero.”
Nevertheless, some have likened what is happening in private credit to a slow run on a bank. You may not see the queues outside branches of Northern Rock, as we saw in 2007, but there is a line of people wanting their money back.
Energy
Another way in which history might be repeating itself is through surging energy prices.
That was a contributing factor to the 2008 crisis. The price of Brent crude oil went from around $50 a barrel at the beginning of 2007 to $100 by the end of the year – eventually peaking at $147 in July 2008. It was driven by surging demand from a rapidly expanding China but also in part from geopolitical tensions involving Iran.
Today, oil prices have risen to over $100 a barrel, with warnings they could go higher if there is not a speedy resolution to a conflict with Iran that has in effect shut the world’s most important energy artery through the Strait of Hormuz.
Fatih Birol, chief executive of the International Energy Agency, has called the ongoing closure of the Strait of Hormuz “the greatest energy security crisis in history”, insisting it is “more serious” than the previous energy shocks in 1973 (when some Arab states imposed an oil embargo on the West), 1979 (caused by the Iranian revolution) and 2022 (Ukraine) “put together”.
That level of gloom is not yet reflected in current oil prices. Although they have risen more than 50% since before the conflict with Iran, they are some way off the levels seen before the last financial crisis, when oil hit $147 dollars a barrel (in today’s money, that’s close to $190 a barrel).
And stock markets are currently at or near all-time highs – nothing like the oil shock of 1973, which triggered a 40% fall in US stock markets from peak to trough.
Sarah Breeden, of the Bank of England, says she expects stock markets to fall at some point, as they do not fully reflect the many current risks to the global economy. But for now, stock markets seem to assume that peace will eventually prevail, and lots of big companies are continuing to make more money than investors were expecting.
But an energy shock is part of the Bank of England’s check list of risks which Breeden fears could hit simultaneously.
“What happens if a number of these risks crystallise at the same time?”, she asks. “Major macroeconomic shock, at the same time as confidence in private credit goes, at the same time as AI valuations and other risky asset valuations readjust. What happens in that environment and are we ready for it?”.
Artificial intelligence
And there Breeden hits on another risk to add to our potential crisis cocktail.
Over $2tn has poured into investments in AI, in what Microsoft co-founder Bill Gates has called “a frenzy” and others have described as a bubble.
It has propelled the valuations of a few mega companies to the point that 37% of the value of the main US stock market index, the S&P 500, is now concentrated in just seven companies (including Nvidia, Microsoft, Google parent company Alphabet and Amazon, which are also among the biggest spenders on AI infrastructure).
That means the millions of people who invest in index tracking funds are investing a large portion of their savings in AI, whether they want to or not.
A big sell-off in these companies would hit savers – including individuals and pension funds in the UK – and inevitably rock business and consumer confidence.
The bursting of the dotcom bubble, which peaked in March 2000, helped trigger a recession in 2001. The tech heavy NASDAQ index fell nearly 80% between March 2000 and October 2002, destroying billions in market value. That collapse of internet-based companies, massive investor losses, and widespread tech layoffs caused a broader downturn in the economy.
A financial fire
There’s also the question of how effectively policymakers could hose down a financial fire.
In 2008 governments eventually got a grip on the chaos by pumping billions of public money into major banks to prevent their collapse, and raising guarantees on bank deposits to prevent savers fleeing. At the same time, major central banks cut rates, including a rare coordinated rate cut in the autumn of that year.
But some worry that those options may no longer exist.
In 2008, UK government debt amounted to less than 50% of national income. Today that number is close to 100%, after major interventions in 2008 bailing out banks, wage support during Covid-19, and the energy subsidies in 2022 after Russia’s invasion of Ukraine. So, the government’s ability to borrow money is much more limited.
Mohammed El-Erian uses the analogy of a fire brigade that has run out of water. “Governments and central banks have had to respond to crisis after crisis and as they have done, they’ve run down the ability to respond,” he warns.
That sentiment is echoed by the International Monetary Fund (IMF), which said earlier this month that the world’s manifold economic challenges come at a time when “policy space has been eroded”.
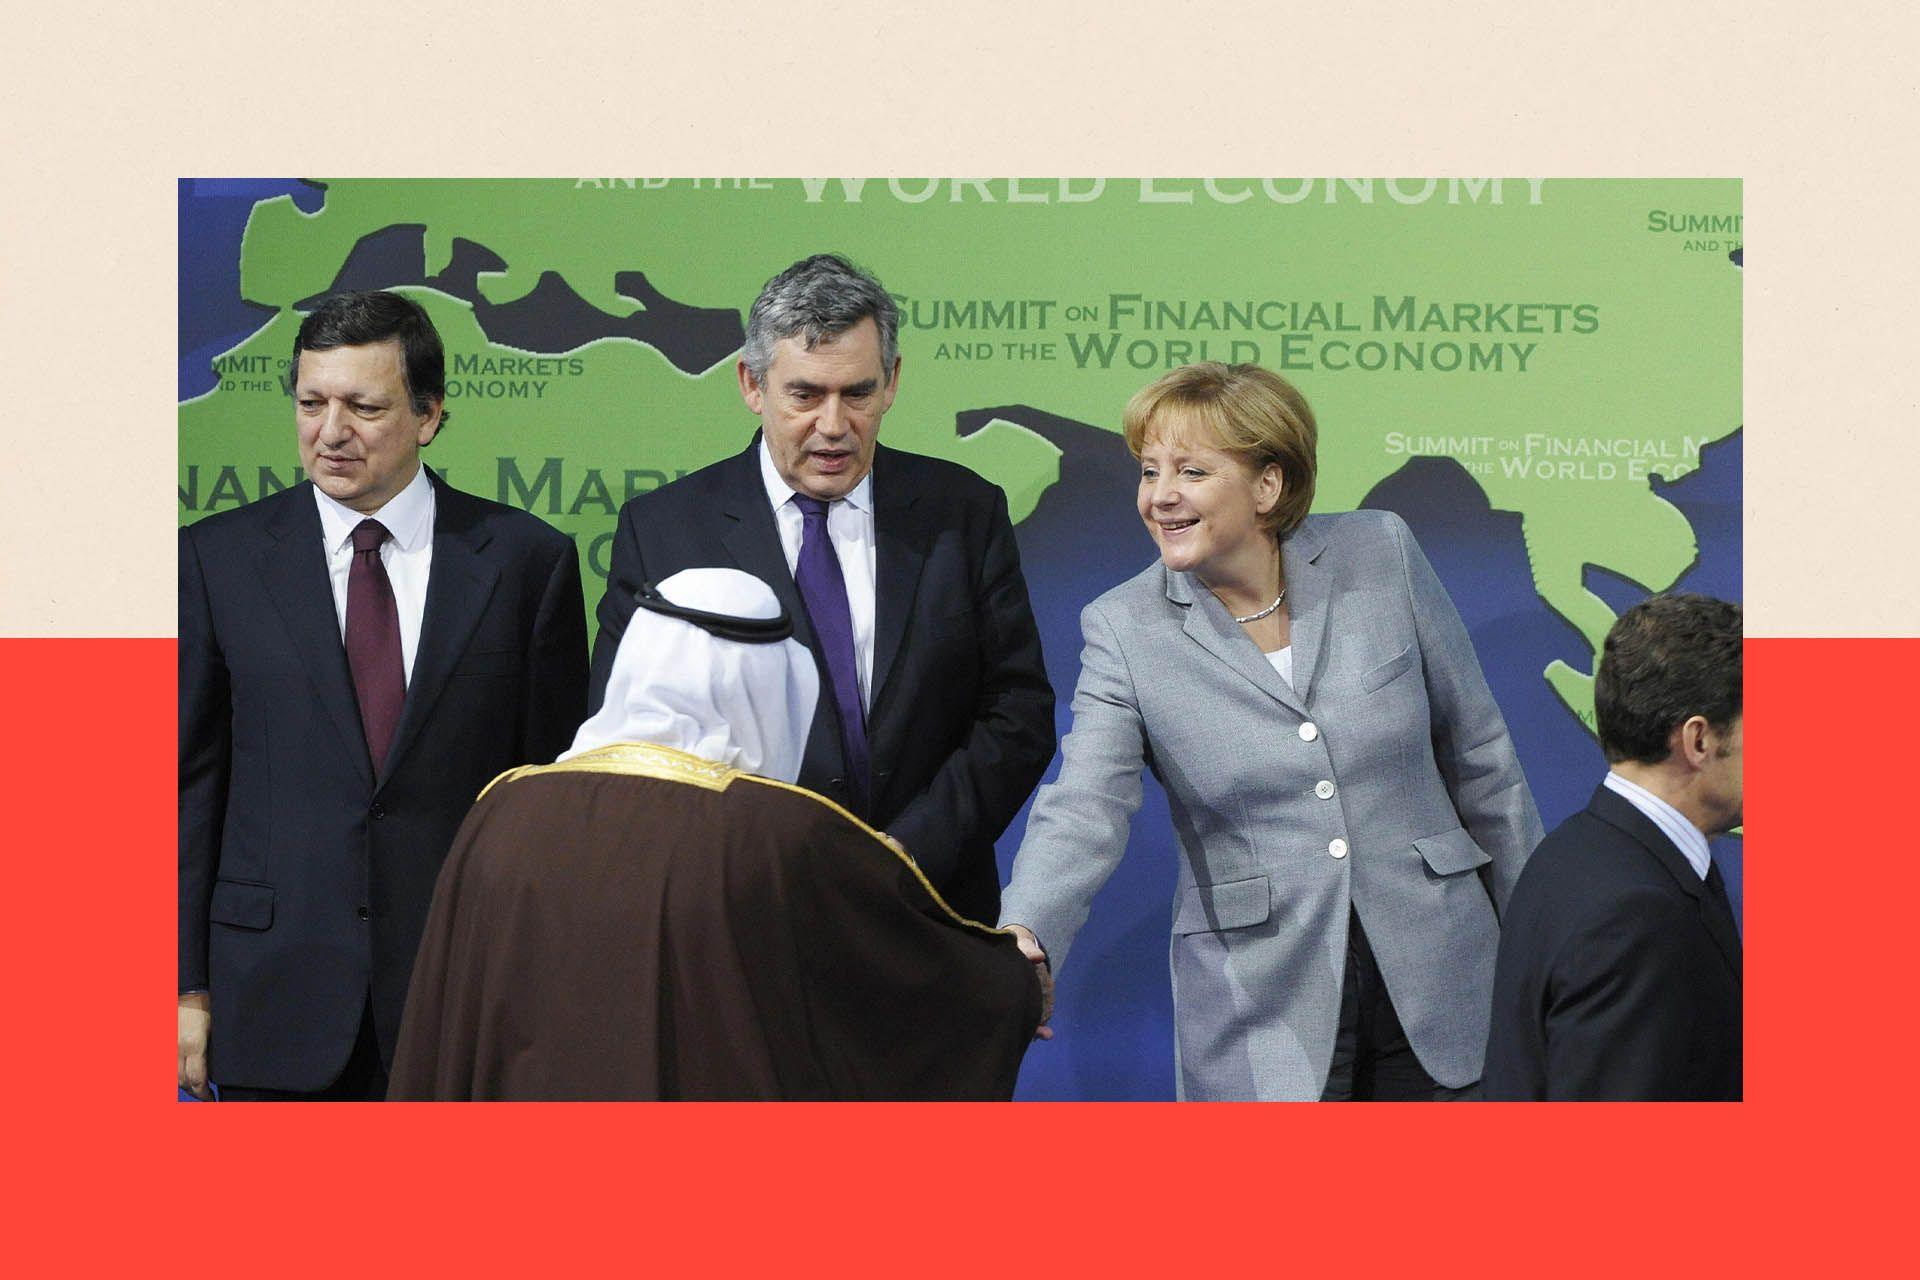
There’s also the poor state of international relations. Amid the 2008 crisis, national leaders met at a series of emergency meetings, including a crucial one in Washington in November 2008, where they hammered out their plan to pour billions into banks; and another in London in April 2009.
Gordon Brown, the prime minister who helped to lead the international response, has said that strong international cooperation is what stopped the crisis from turning into a depression.
Image caption,Amid the 2008 crisis, national leaders met at a series of emergency meetings, including a crucial one in Washington in November 2008
All that could be more difficult today, amid significant disagreements between rich countries over trade policy, Nato, and even the status of Greenland.
Writing earlier this month about the dangers of a financial crisis, the IMF made a point of warning that “international cooperation is weaker” now than in previous years. The implication, perhaps, is that in an era of war in Europe, US-China trade wars, and US President Donald Trump’s “America First” policy, it will prove more difficult for governments to put aside their differences and get around a crisis table in the way they did in 2008.
And Brown has repeatedly warned of the dangers of an isolationist, ‘us versus them’ approach to international affairs.
Financial fragilities
Sarah Breeden, however, gives a note of optimism, arguing that banks have more capacity to absorb shocks than they did in 2008.
She takes comfort from the fact that banks are “much more capitalised now” – in other words, they have higher reserves of cash, rather than relying on borrowed money.
“I don’t think if we get stressed it will be on the same scale,” she says.
Mohammed El Erian agrees – to an extent. “We’re not exactly in 2008 territory because I do not believe that the banking system, and therefore depositors’ money and the payments system, is at risk. But we are in a 2008 moment in that the financial system could aggravate economic fragilities that tip us into recession.”
And if that does happen, he’s in no doubt who will suffer most.
“Economic and financial fragilities tend to expose the most vulnerable segments of the population. They have the least resilience and tend to get [hit] particularly hard.”
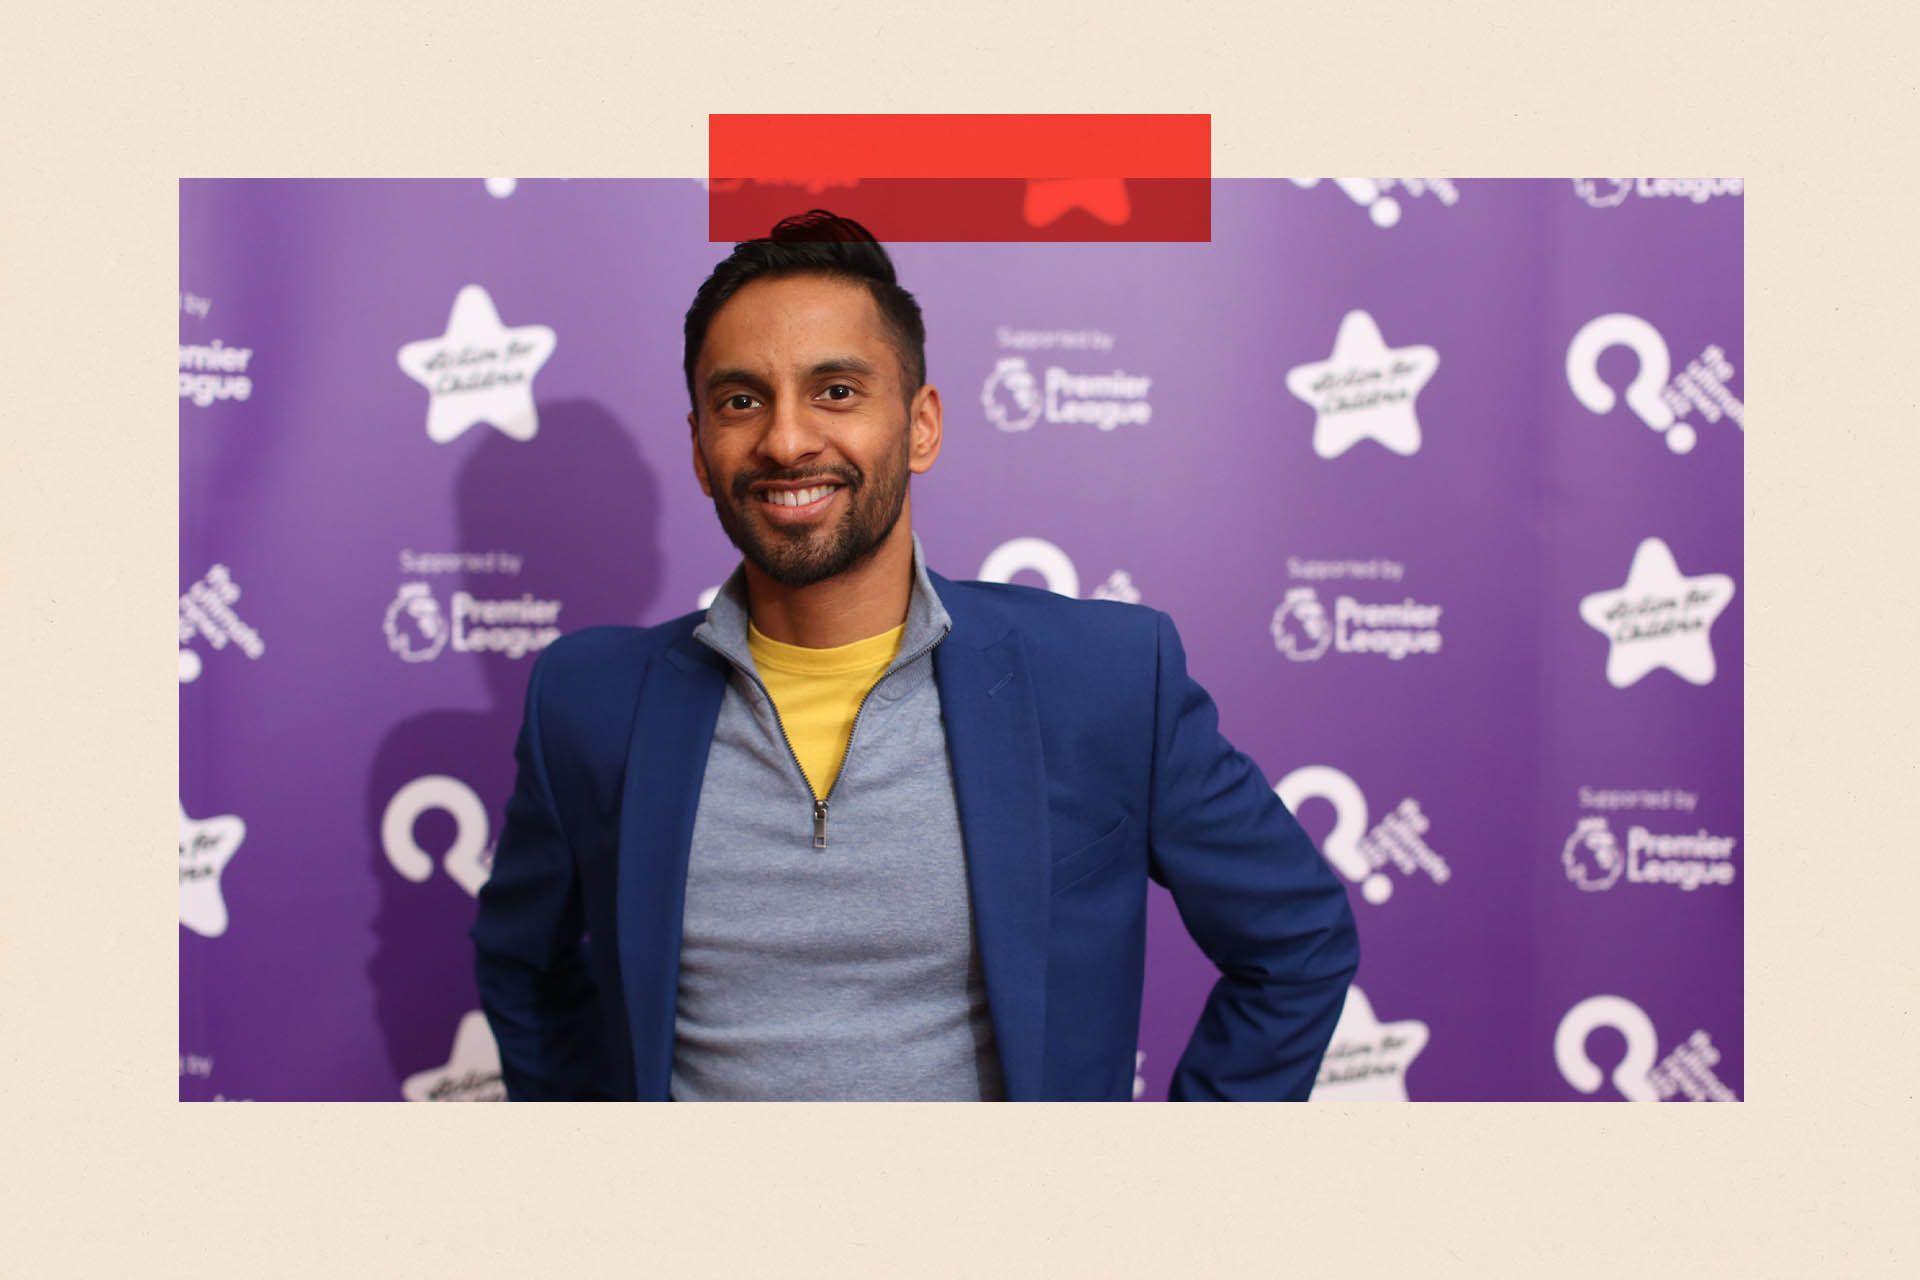
Image caption,Bobby Seagull is now a Maths teacher
Bobby Seagull, now a Maths teacher – says financial markets are even more complex now and you never quite know what nasty surprises are lurking under the surface.
“You’re sort of passing on financial instruments from one person to the other, not sure what’s inside it. And I think the worry is if things happen, they escalate very quickly in financial markets. And that’s where you don’t want to be the last person left holding that package.”
Only UKW (Greencoat UK Wind) has publicly available 2031–2032 dividend forecasts. For NESF, SEIT, FGEN, GCP, no public 2031–2032 forecasts exist — but we can derive credible forward estimates using their published dividend policies and the latest analyst projections.
Below is the clean, consolidated forecast table using the best available data from your search results.
(All figures per share, in pence. Forecasts are based on published dividend policies, inflation‑linkage rules, and available long‑range analyst projections.)
✅ 1. Greencoat UK Wind (UKW) — Only trust with explicit 2031–2032 forecasts
Source: Digrin long‑range dividend model.
2031:20.656p
2032:23.207p
These are based on UKW’s policy of RPI‑linked annual increases, which the trust has delivered for 12+ years.
🟧 2. NextEnergy Solar Fund (NESF)
Latest published projections extend only to 2028:
2026: 8.43p
2027: 8.56p
2028: 8.68p
NESF’s dividend growth trend is ~1.5% per year (inflation‑linked subsidies). Applying that forward:
Estimated (modelled)
2031: ≈ 9.07p
2032: ≈ 9.21p
🟧 3. SDCL Energy Efficiency Income Trust (SEIT)
Latest published projections extend to 2026:
2024: 6.24p
2025: 6.32p
2026: 6.75p
SEIT’s long‑term dividend growth trend is ~2% per year.
All yields use the latest live prices from search:
NESF: 46.30p
SEIT: 43.05p
UKW: 99.18p
FGEN: 73.80p
GCP: 74.40p
Dividend forecasts (from earlier modelling + UKW published long‑range model):
Trust
2031 Dividend
2032 Dividend
NESF
9.07p
9.21p
SEIT
7.45p
7.60p
UKW
20.656p
23.207p
FGEN
8.85p
9.10p
GCP
7.00p
7.00p
📊 Forward Yield Table (Based on Today’s Prices)
2031 Forward Yields
Trust
Price
2031 Div
2031 Yield
NESF
46.30p
9.07p
19.6%
SEIT
43.05p
7.45p
17.3%
UKW
99.18p
20.656p
20.8%
FGEN
73.80p
8.85p
12.0%
GCP
74.40p
7.00p
9.4%
2032 Forward Yields
Trust
Price
2032 Div
2032 Yield
NESF
46.30p
9.21p
19.9%
SEIT
43.05p
7.60p
17.7%
UKW
99.18p
23.207p
23.4%
FGEN
73.80p
9.10p
12.3%
GCP
74.40p
7.00p
9.4%
🏆 Yield Ranking (Highest → Lowest)
2031
UKW – 20.8%
NESF – 19.6%
SEIT – 17.3%
FGEN – 12.0%
GCP – 9.4%
2032
UKW – 23.4%
NESF – 19.9%
SEIT – 17.7%
FGEN – 12.3%
GCP – 9.4%
🔍 Interpretation
UKW dominates due to its RPI‑linked dividend policy and depressed share price.
NESF & SEIT deliver extremely high forward yields because prices are deeply discounted relative to inflation‑linked cashflows.
FGEN sits in the middle: stable, but not explosive.
GCP remains a flat 7p payer, so its yield is purely price‑driven.
Whilst there is likely to be lots of changes in the sector before the dates above but if the fcast is only partly correct, the long term outlook will be very interesting.
The 2032 fcast yield for UKW is 23.4p, a yield on the current buying price. would be 23.5%. IF that is only partly achieved the share price will not be 99p.
Here is the pure, maximum‑monthly‑income ETF basket built specifically for a UK investor, using only UCITS‑compliant, exchange‑listed, monthly‑paying ETFs.
🔥 The Pure Maximum‑Monthly‑Income ETF Basket (UCITS)
Objective: Maximise monthly cashflow, not long‑term growth Style: High‑yield bonds + global dividends + covered‑call income Currency: GBP‑accessible UCITS ETFs Distribution: Monthly (or effectively monthly via staggered holdings)
1) Global High‑Dividend Core (Monthly)
Purpose: Reliable, equity‑based income Yield Range: ~4.5%–6% Role: The “equity backbone” of the income stream
Examples of ETF types in this slot:
MSCI World High Dividend Yield UCITS ETFs
Global Select Dividend UCITS ETFs
These provide global diversification and stable dividend flow.
2) High‑Yield Bond Engine (Monthly)
Purpose: Maximise raw yield Yield Range: ~6%–9% Role: The “income engine” of the basket
These ETFs typically hold:
Global high‑yield corporate bonds
Short‑duration high‑yield bonds
EM government bonds (USD‑denominated)
They are the highest consistent monthly payers in the UCITS universe.
3) Covered‑Call Income Boosters (Monthly / Near‑Monthly)
Purpose: Generate option‑premium income Yield Range: ~8%–12% Role: The “turbocharger” of the basket
Covered‑call ETFs generate income by selling call options on equity indices. They sacrifice some upside for very high monthly distributions.
📦 The Basket Structure (Clean & Powerful)
A) 40% — Global High‑Dividend ETFs (Monthly)
Smooth, diversified income
Lower volatility than pure equities
Anchors the portfolio
B) 40% — High‑Yield Bond ETFs (Monthly)
Highest consistent monthly payouts
Strong income engine
More stable than equities
C) 20% — Covered‑Call ETFs (Monthly / Near‑Monthly)
Could value stocks offer the remedy to an AI bubble?
Thursday, May 7, 2026
Hannah Williford
Content Writer
Related news
The lofty valuations of AI stocks in the past few years have dredged up memories for some of the time before the dotcom bubble burst in 2000.
This burst, which led to steep fall in the MSCI World over a period of two years, was due to overinvestment in internet companies that eventually couldn’t live up to their value despite the internet becoming a part of everyday life. It’s simple to see the similarities to today: even with a general consensus that AI will be a world-changing technology, it’s hard to be clear on the companies which will benefit most.
But a striking phenomenon of the dotcom bubble bursting was the performance of value stocks in the aftermath, which shot up as the rest of the market fell. The past is never a perfect indicator of what will happen to markets in the future, but some investors believe value stocks could deliver the same bumper returns if the AI bubble burst.
Investors can see this through the Fama-French HML Factor Data. This is an educational data measure that shows how value-driven stocks perform in comparison to growth stocks. The chart below shows how dramatically value outperformed growth in the period immediately following the dot-com crash.
What does value really mean?
There is no single definition of what qualifies a stock as ‘value’. Generally, it refers to stocks that are unloved by the market, but if these stocks are worth more than their price will depend on who you ask. This makes it a popular area of the market for fund managers that select their own stocks, because it allows them to use their own strategies to see appeal they think others, or indices, might be missing.
Indices offer value options too, but their performance has differed widely based on criteria. The MSCI World Value index, for example, has lagged behind the standard MSCI World in the past five years, with returns of 65.8% and 76%, respectively. But the MSCI World Enhanced Value Index has beat both with a 101.65% return.
How are these value metrics so different? MSCI World Value Index chooses its holdings based on book value (essentially the value of a company’s assets) divided by share price, dividend yields, and 12-month forward earnings multiples. It then gets a score to sort it between value and growth. But a stock can fall in both of these baskets which means the returns of this index aren’t always so different from the broader market.
MSCI World Enhanced Value, on the other hand, uses different metrics, has stricter criteria, and an all-in or all- out approach for if stocks qualify. This creates a smaller qualifying group and a much different return than the standard MSCI World.
This stricter criteria meant that on a longer- term view, including in the early 2000s, the enhanced value strategy won out. However, in times that were strong for growth, such as the 2010s, this index lagged behind.
Balancing growth and value
Value stocks don’t come without risk, and some are cheap for a reason. By relying them on completely, investors would likely have missed out on some of the most impressive market performers in recent years, such as Nvidia and Alphabet. For this reason, many investors choose to use a blend. Indices like the MSCI World are, by nature, weighted more heavily towards growth. So having a separate portfolio weighting that is aimed specifically at value can be a way to even out this risk.
Some value stocks will present a smoother ride than broader equity markets, as many measures of value include stocks that pay high levels of dividends, which tend to be more mature businesses. But other value stocks are discounted severely because the company has had a difficult period. This does involve risk, but it can still be a diversifier to other parts of your portfolio.
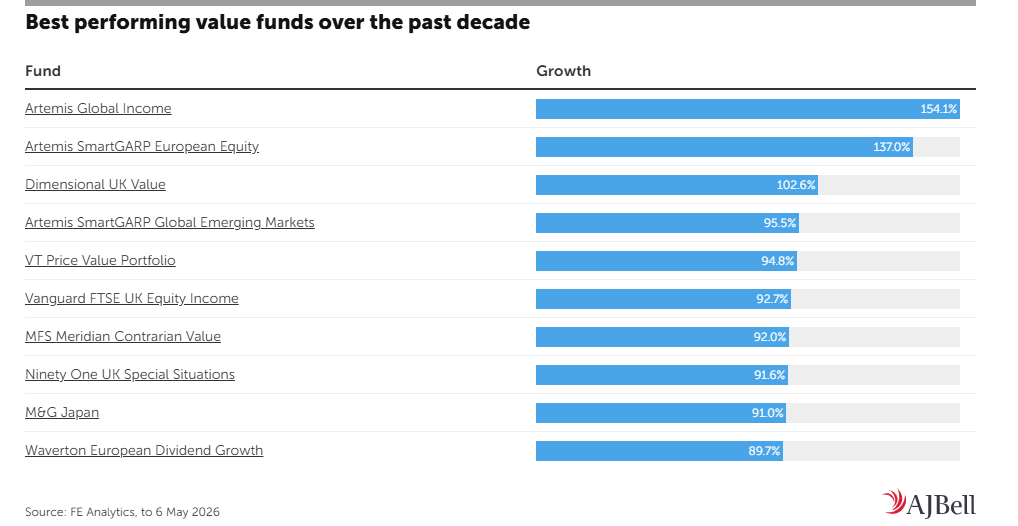
Value investments can be hard to sniff out, because it involves deep analysis of why they are trading more cheaply in the first place, as well as what their potential is for the future. There’s always a possibility of buying a stock that looks good value at the time, but keeps sinking instead of recovering. Some prefer to leave it up to the experts and invest through funds. The table shows the best performing value funds of the past 10 years offered on AJ Bell’s platform. Note that these funds will each have different metrics to constitute value, and past returns don’t guarantee future performance.
Appointment of Investment Manager and Company Secretary
The Board of Murray Income Trust PLC (the “Company”) is pleased to announce that, further to its previous announcements, it has entered into an investment management agreement with Artemis Fund Managers Limited (“Artemis”) as the Company’s new alternative investment fund manager, which has become effective today. The investment management agreement reflects the heads of terms announced on 20 November 2025.
Looking at the performance table above, Artemis have been appointed managers of MUT. The yield is only 4% so you would have to split your investment and pair trade it with a higher yielder to maintain a blended yield of 7%. General advice not trading advice.
Lindsell Train Investment Trust – “Market mispricing AI risk”
07 May 2026
QuotedData
“Market mispricing AI risk”
During periods of global market uncertainty, the companies held by Lindsell Train Investment Trust (LTI) and its manager, Lindsell Train Limited (LTL), have tended to perform well as investors seek durable and resilient cash flows. Whilst some holdings – particularly those in the consumer staple sector – have proven defensive amid volatility linked to the Iran war, growing fears around the impact of artificial intelligence (AI) on software and data businesses has hit LTI and LTL hard.
This has been particularly acute at portfolio holding RELX. LTL argues that the market’s assessment is wrong. In sectors such as legal and financial, the cost of error is extremely high, and regulatory barriers make the datasets valuable and essential for the successful application of AI tools. Reflecting this, LTI used market weakness to initiate a position in US credit scoring giant FICO (which was already held in LTL’s Global strategy) in February.
Whilst funds under management at LTL have continued to fall, the company has launched a new $200m strategy focused on international equities, seeded by its substantial cash pile and a longstanding client.
Maximise returns over the long-term
LTI aims to maximise total returns over the long term, while preserving shareholders’ capital. It invests in a concentrated portfolio of global equities that it has identified as market-leading and that benefit from high returns on equity. It also invests in a range of Lindsell Train-managed funds and the unlisted security of its investment manager, Lindsell Train Limited.
Year ended
Share price total return (%)
NAV total return (%)
MSCI World Index TR (%)
30/04/2022
(11.5)
(4.2)
6.4
30/04/2023
(10.9)
10.1
3.1
30/04/2024
(19.5)
1.8
18.8
30/04/2025
10.7
12.2
5.1
30/04/2026
(23.6)
(17.7)
27.0
Source: Bloomberg, Marten & Co
Fund profile
Concentrated portfolio of 13 global equity stocks plus Lindsell Train funds
Lindsell Train Investment Trust (LTI) aims to deliver long-term total returns while preserving the real value of capital. It invests in a concentrated portfolio of 13 global “heritage” companies, alongside selected Lindsell Train funds and a stake in its manager, Lindsell Train Limited (LTL). The LTL management fee for LT managed funds and other funds that LTL manages are rebated back to LTI, so as to avoid double charging of fees.
As of March 2026, global equities made up 62.4% of NAV, with look-through exposure to 49 holdings. The trust is benchmarked against the MSCI World Index (in sterling) but is managed independently, with an active share close to 100%. LTI was launched in 2001 and is listed on the premium segment of the main market of the London Stock Exchange. LTI’s board of directors is the company’s AIFM and receives no remuneration for doing so.
Investment approach
LTL focuses on holding a small number of high-conviction, high-quality companies for the long term. It believes concentration can reduce risk more effectively than broad diversification. These businesses typically have durable competitive advantages and long histories (average age of LTI’s direct equity holdings of around 147 years).
Symbiotic relationship with LTL
LTI has a symbiotic relationship with LTL, helping seed new funds and benefitting from their growth. Its initial £66,000 investment in LTL grew significantly and stood at £28.2m (as at the end of March 2026), peaking at 48% of NAV in 2021 before declining to 19.8% by March 2026 due to weaker performance and reduced assets under management.
Market backdrop
War in Iran has heightened global geopolitical uncertainty
Global market uncertainty has heightened with the war in Iran intensifying geopolitical tension and upending a global economic recovery. Growth expectations have been lowered on the back of the energy price shock and re-accelerating inflation, with central banks being forced to shelve rate cutting plans as a higher-for-longer interest rate backdrop emerges.
At the same time, investors are also evaluating how artificial intelligence (AI) could reshape entire industries and sectors, distinguishing between likely beneficiaries and those at risk of disruption.
Markets have become highly event-driven and volatile, with concerns about inflation, oil prices, interest rates, and geopolitics all affecting sentiment. The impact of the uncertainty caused by both unstable geopolitics and the threat posed by AI has been great on LTI and LTL’s portfolios. We look at both here.
Geopolitical tension
Defensive stocks back in focus
The war in Iran and wider instability in the Middle East has brought defensive stocks back into focus. While energy, defence/aerospace and selective commodity stocks have made substantial gains, other safe haven sectors, including banking, have also benefitted. LTL’s consumer staples exposure has likewise proven relatively resilient in recent months. Within LTI’s portfolio, beauty and personal care giant Unilever was up double-digits in the year before it was reported that it was selling its food business in March (which we detail on page 9). Meanwhile, snacks behemoth Mondelez and soft drinks manufacturer AG Barr were both up in the weeks following the outbreak of war.
All four boast long-term track records of durable and growing revenues and should continue to reliably compound for years and decades to come. In the last period of significant market volatility – at the start of 2025 when tariff uncertainty and the DeepSeek large language model (LLM) launched – LTI and LTL’s portfolio held up relatively well, while tech-dominated indices, including the S&P 500 and NASDAQ faltered. This is illustrated in Figure 1, which shows LTI’s NAV return relative to the MSCI World Index.
Figure 1: LTI NAV total return relative to the MSCI World Index1
Source: Bloomberg, Marten & Co. Note 1) rebased to 100 at 31 December 2024
The benefits of its defensive positioning were not quite as pronounced in the aftermath of the start of the war in Iran this year, coming at a time when a number of LTL’s data businesses were caught up in the widespread software sell-off.
Software sell-off
Data businesses suffered large sell-off
Following the launch by Anthropic of industry specific plugins for Claude Cowork in January – targeting particular verticals such as legal and finance – a period of indiscriminate selling of data and digital platform businesses ensued. The concern is that cheap AI tools may soon commoditise data provision altogether or at least impact future growth prospects.
A number of LTI and LTL’s holdings were caught up in this, not least London Stock Exchange Group (LSEG) and RELX.
LTL believes that the market has misjudged both companies, underestimating the long-term value of the datasets on which the new AI models depend. In sectors such as legal, risk, financial, and medical, the cost of error is extremely high, while much of the underlying data is protected by clear physical and regulatory barriers, meaning a significant proportion remains entirely unavailable to large language models (LLMs). As a result, trusted, accurate, reference-grade data should remain valuable even as AI tools become more widely adopted.
Figure 2: RELX (GBP)
Source: Bloomberg
RELX, which provides services to the global scientific, legal and insurance industries, already offers similar AI-enabled workflow tools. LTL argues that, whilst new AI applications are being developed, the value is less likely to accrue to the models themselves but more to the owners of the datasets upon which they rely. Both RELX and LSEG possess clear data moats. RELX, for example, has amassed over 100 billion legal documents and grows this data daily – the vast majority of which contain proprietary content. This legal data is rarely more than 1%-2% of a law firm’s cost base, LTL estimates. However, it is critical to their function and does not seem an obvious target for cost savings.
LTL believes that investors have overly discounted the long-term earnings potential of these and other data businesses, creating a buying opportunity. As such, LTI has recently initiated a position in US credit-scoring giant FICO (which we detail on page 10).
Investment process
Investment universe of 150 companies
LTL operates within a small universe of potential investments, typically no more than 150 companies, due to its strict focus on heritage businesses with predictable earnings (supported by pricing power and/or intellectual property), low capital intensity and sustainably high returns on capital. As a result, LTI has maintained a highly concentrated portfolio since its launch in 2001, averaging around 15 holdings (currently 13).
Most qualifying companies tend to fall into a limited number of broad sectors:
Consumer branded goods;
Internet, media, software; and
Financials and networks.
Bottom-up approach without reference to benchmark
The portfolio is constructed on a purely “bottom-up” basis, with no reference to benchmarks. Each potential investment undergoes a rigorous due diligence process (sometimes lasting several years) including meetings with management and detailed industry analysis.
Valuation is assessed using multiple methods. Whilst LTL does not rely on traditionally constructed discounted cash flow (DCF) models, its approach shares many of its core principles, particularly in focusing on the long-term sustainability of returns of a company. Companies identified as offering the best value are selected for inclusion in the portfolio.
ESG integration
Signatory of UN Principles for Responsible Investment
LTI’s manager is a signatory to the United Nations Principles for Responsible Investment, the UK Stewardship Code, and the Net Zero Asset Managers initiative. It actively engages with portfolio companies on ESG issues, including climate change, and measures portfolio-level carbon emissions, footprint (tCO₂e/$m invested), and intensity (tCO₂e/$m sales) to assess exposure to climate-related risks.
LTL believes that companies with strong ESG standards are likely to be more durable and deliver superior long-term returns. Accordingly, ESG analysis is embedded in the investment process and covers environmental factors (including climate change), social, governance (including remuneration and capital allocation), as well as cyber resilience, responsible data use, human rights, anti-corruption, and reputational risks.
ESG factors influence portfolio decisions
Where ESG factors are expected to materially affect long-term prospects, they are incorporated into valuation assumptions, particularly long-term growth rates, and influence portfolio decisions, including whether to initiate, hold, or exit positions.
Consistent with its philosophy, LTL avoids:
capital-intensive sectors such as energy, commodities, and mining, including companies involved in coal, oil, or gas extraction; and
industries considered socially harmful or exposed to regulatory or litigation risk, such as tobacco, gambling, and arms manufacturing.
Active engagement with company management on ESG and stewardship issues is a core part of the strategy. Whilst generally supportive of management, LTL will seek to influence decisions where it disagrees with company actions.
Investment policy and restrictions
LTI can invest globally across a broad range of financial assets, including equities (listed and unlisted), bonds, funds and cash, with no sector or geographic constraints. Individual holdings are limited to 15% of gross assets. It may also invest up to 25% in LTL-managed funds (subject to board approval) and may retain holdings in LTL to benefit from its long-term growth.
The company does not invest for control purposes and will not allocate more than 15% of gross assets to other closed-ended investment funds.
Exits
Low single-digit portfolio turnover rate
LTL maintains a low single-digit portfolio turnover rate, with LTI’s turnover even lower. Investments are typically held for the long term, reflecting its conviction in the value of owning high-quality businesses over extended periods.
Positions are reduced or exited only for compelling reasons, such as a share price exceeding intrinsic value, or erosion of competitive advantages.
Long-term holding avoids transaction fees
This long-term approach minimises transaction costs, which the manager views as a drag on capital, and requires patience and discipline to look beyond short-term market noise. Exit decisions may also be influenced by the availability of alternative opportunities with stronger upside potential, with the manager typically identifying two or three vetted candidates at any given time.
Asset allocation
Figure 3: Breakdown of LTI’s portfolio at 31 March 2026
Source: Lindsell Train Investment Trust
Figure 4: LTI portfolio by location of underlying revenue at 30 Sept 20251
Source: Lindsell Train Investment Trust. Note 1) On a look-through basis, aggregating direct holdings with indirect holdings held by LTL funds
At 31 March 2026, more than 60% of LTI’s portfolio value was invested in global equities, with LTL making up almost 20%. Over a third of underlying portfolio revenue originated from the US (on a look-through basis including positions in LTL), while Europe accounted for a quarter of revenues and the UK just over a fifth.
Figure 5: LTI holdings at 31 March 2026
Stock/holding
Sector
As at 31/03/26 (%)
As at 30/09/25 (%)
Change (%)
Lindsell Train Limited (LTL)
Unlisted security
19.8
24.4
(4.6)
London Stock Exchange Group
Financials
14.4
11.3
3.1
Lindsell Train North American Equity Fund
LTL managed fund
13.5
12.2
1.3
Nintendo
Communication services
11.1
14.0
(2.9)
RELX
Industrials
6.4
7.4
(1.0)
A.G. Barr
Consumer staples
4.7
4.0
0.7
Unilever
Consumer staples
4.6
5.0
(0.4)
Diageo
Consumer staples
4.2
4.4
(0.2)
Thermo Fisher Scientific
Healthcare
3.2
2.5
0.7
Mondelez International
Consumer staples
3.0
3.3
(0.3)
Universal Music Group
Communication services
2.6
3.1
(0.5)
Heineken
Consumer staples
2.4
2.1
0.3
PayPal
Financials
2.2
2.6
(0.4)
Finsbury Growth & Income Trust Plc
Financials
2.1
2.1
0.0
Laurent-Perrier
Consumer staples
2.0
1.7
0.3
FICO
Financials
1.7
–
1.7
Cash & equivalent
–
2.1
0.2
1.9
Source: Lindsell Train Investment Trust, Marten & Co
Universal Music Group (UMG)
Figure 6: UMG (EUR)
Source: Bloomberg
We explained LTL’s investment rationale for UMG, which it bought into at the end of 2023, in detail in our initiation note and the manager says that this has not changed. Its belief that the Euronext Amsterdam-listed company was vastly undervalued has been proven by a £48bn bid for the company by Pershing Square Capital Management. Announced earlier this month, the deal values UMG’s shares at €25 compared to its previous closing price of €17.05.
If it goes ahead, shareholders in UMG will receive €9.4bn in cash and 0.77 new UMG shares as part of the deal, which would see UMG merge with Pershing Square SPARC Holdings, the special purpose vehicle established four years ago to make a large acquisition, and list on the New York stock exchange. Under the transaction, 17% of UMG shares will be bought back and cancelled while preserving the company’s investment grade balance sheet, and a new dividend policy may also be adopted.
UMG’s shares have been depressed since listing in 2021, with concerns over French conglomerate Bolloré Group’s 18% stake, the postponement of UMG’s US listing, under-utilisation of its balance sheet, and the threat of AI deepfakes on music industry revenues weighing on performance.
The LTL team believes that that whilst AI can generate huge volumes of music-like content, it does not change the value of real, established, and in-demand catalogues. UMG’s ownership of major music rights, where it controls roughly a third of the world’s recorded music (ahead of the other two major players Sony and Warner), puts it in a strong position to push for better pricing from streaming platforms such as Spotify, it adds.
The payout model currently used by the platforms – based on a simple pro-rata share of listening – is expected to improve and evolve allowing for minimum payments or fixed-value arrangements tied to the worth of catalogues. This would give UMG leverage to force platforms to absorb higher content costs or raise their own subscription prices. Changes would likely take time to flow through because UMG needs to align terms across multiple streaming partners, the manager says, but the direction of travel is positive.
Unilever
Figure 7: Unilever (GBP)
Source: Bloomberg
FTSE 100 conglomerate Unilever has been a long-term holding for LTL and a consistent presence in LTI’s portfolio. Last month, the group announced it had reached a deal to sell its food business to spice maker McCormick, creating a $66bn company with $20bn of annual revenues.
As part of the cash-and-stock transaction, Unilever shareholders will own 65% of the combined group, with McCormick owning the remaining 35%. Unilever will also receive $15.7bn of cash from McCormick under the deal terms. It has been structured as a so-called Reverse Morris Trust, which allows the parent company (Unilever) to minimise its tax liabilities on the disposal if it retains a majority stake in the divested enterprise.
Unilever says that the deal, which is expected to complete by mid-2027 subject to McCormick shareholder approval, will transform the company from a multi-category conglomerate into a more focused, pureplay beauty and personal care company. The division accounts for a large portion of group revenues and is seen as faster-growing sectors.
Unilever has been pivoting away from food over the past decade to focus on beauty and wellbeing categories – last year spinning-off its Magnum ice cream holding into an independent entity.
Shareholders reacted negatively towards the McCormick deal, with its share price falling heavily since first being reported in March. LTI had reduced its position in Unilever earlier in the year, before the price weakened. The manager believes that the greater attraction of Unilever’s household and personal care portfolio has put selling pressure on the remains of Unilever’s food business. It thinks that it is this, rather than the merits of the deal, that has negatively impacted Unilever’s share price.
FICO
Figure 8: FICO (USD)
Source: Bloomberg
Partly funded by the exit of Unilever’s Magnum ice cream business noted above, LTI initiated a 2% holding in US-listed credit scoring giant FICO in February. It has been a constituent of LTL’s global equity portfolio since 2022, and the manager took advantage of share price weakness linked to the perceived threat from AI to add to its position.
FICO has two core businesses: the credit scores segment and the software arm. LTL notes that much of FICO’s growth has come from pricing power, with significant further room to raise prices after decades of undercharging. It believes that the scores business still has a large growth runway ahead of it, with opportunities to increase pricing and tweak its charging model, as well as capturing more of the value chain. Meanwhile, the software business’s shift to a new cloud-based platform has presented it with greater opportunities to cross-sell its risk and fraud prevention services.
LTL believes the AI disruption fears are misplaced in FICO’s case due to the sensitivity and protection given to the underlying bureau data and the regulatory burden around the scores themselves.
Diageo
Figure 9: Diageo (GBP)
Source: Bloomberg
A major recent development at drinks giant Diageo was the announcement of the halving of its dividend. New chief executive Dave Lewis said the company had taken the decision to reduce the pay-out in order to strengthen its balance sheet and drive long-term growth.
Lewis had been appointed earlier this year to turnaround the ailing company, which owns some of the best-selling premium spirit brands globally but has suffered a collapse in its share price since its peak in 2021. The dollar-based company declared an interim dividend of 20 cents per share in half-year results, down from 40.5 cents. Going forward, it said it would target paying 30-50% of earnings with a minimum annual dividend of 50 cents.
LTL says that it supports the dividend cut, providing it helps protect the balance sheet and avoids more damaging actions like selling valuable assets. Whilst acknowledging the disappointment, it believes that the core long-term strengths of the business remain intact: strong brands, durable market positions, and growth potential in markets such as India.
Diageo’s share price weakness has been exacerbated recently, with the company being uniquely hit by Trump’s tariffs, as a significant portion of its products are imported into the US from Mexico and Canada. Another concern for shareholders stems from the fact that people are drinking less. The manager says that the data points to a more nuanced story, however.