Investment Trust Dividends

Real Estate Credit Investments Limited (the “Company”)
Ordinary Dividend for RECI LN (Ordinary shares)
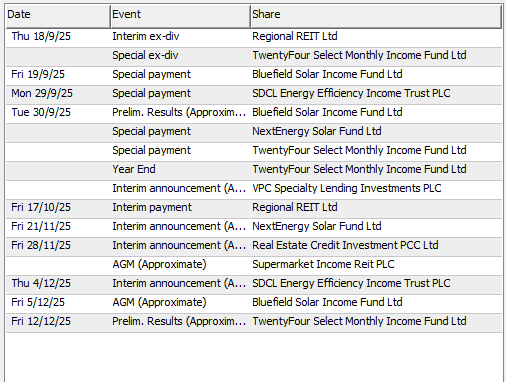
Real Estate Credit Investments Limited announces today that it has declared a first interim dividend of 3.0 pence per Ordinary Share for the year ending 31 March 2026. The dividend is to be paid on 17 October 2025 to Ordinary Shareholders on the register at the close of business on 26 September 2025. The ex-dividend date is 25 September 2025.

If you buy SUPR today the fcast dividend is 6.18p per share.
The current price to buy is 78.9p a buying yield of 7.75%.
The yield should gently increase, although there are never any guarantees.

So in around ten years time, if the Trust still trades, you should have received all your capital back.
You would have achieved the holy grail of investing in that you would be receiving income from a share that sits in your account at a zero, zilch cost.
If you re-invest the earned dividends into another high yielding trust you will also be earning income a blended yield of around 15% plus on your seed capital.
If you are lucky enough to have another ten years to invest, you can do it all over again but with a much shorter time scale.

If you do buy, remember the rules of the Snowball.
A home for your hard earned as you wait for markets to fall, which they will but the timing is the unknown.

| Company Name | Place change | |
| 1 | Royal London Short Term Money Mkt Y Acc | Unchanged |
| 2 | Artemis Global Income I Acc | Unchanged |
| 3 | Vanguard LifeStrategy 80% Equity A Acc | Unchanged |
| 4 | L&G Global Technology Index I Acc | Up three |
| 5 | HSBC FTSE All-World Index C Acc | Unchanged |
| 6 | Vanguard FTSE Glb All Cp Idx £ Acc | Up three |
| 7 | Vanguard LifeStrategy 100% Equity | Up one |
| 8 | Ranmore Global Equity | New |
| 9 | Scottish Mortgage Ord SMT0.45% | New |
| 10 | Greencoat UK Wind UKW0.96% | Down four |
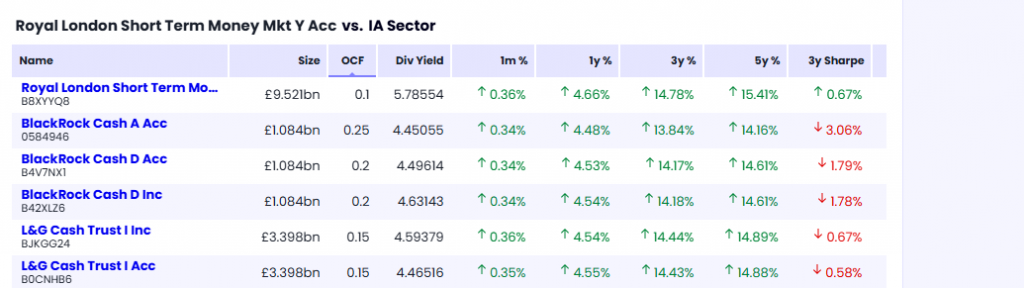
For the past four weeks our top three funds have remained the same, with Royal London Short Term Money Mkt Y Acc still in pole position. The fund offers a “cash-like return”, with its yield closely linked to the Bank of England’s base rate. As well as low-risk income, the Royal London fund can be seen as a place to park cash while awaiting new opportunities.
In second place was Artemis Global Income. This value-focused fund is light on US exposure, holding just under one-third of its portfolio in the country. In contrast, the MSCI World Index, which follows the ups and downs of 1,320 global stocks across 23 developed markets, holds 72% in US companies. The Artemis fund launched 15 years ago, and the same stock picker – Jacob de Tusch-Lec – remains at the helm.
Tracker fund Vanguard LifeStrategy 80% Equity held on to third place. It was joined by another fund from the same stable, Vanguard LifeStrategy 100% Equity, in seventh place.
There were two new entries, although both are no strangers to the top 10. Scottish Mortgage Ord
0.45%, which invests in high-growth global companies, re-entered the table in ninth place. It was joined by Ranmore Global Equity, another global actively managed fund in 10th place. The value-focused Ranmore fund is also light on US exposure (with around a 20% weighting). It has been a stellar performer over the past three and five years, up 91.7% and 161.1%, while the average global fund has returned 31% and 53.2%,
The value investment style involves selecting stocks that appear to be trading at prices lower than their true value. Such out-of-favour companies tend to have a low price/earnings (PE) ratio, which compares a company’s value with its profits. If the company pays dividends, it will tend to have a high dividend yield.
Such companies tend to be found in sectors that are more economically sensitive, including finance, energy and materials. Value stocks are cheaper than growth stocks, with valuations more reflective of current earnings rather than future potential.
UK dividend investment trust City of London and global tracker Fidelity Index World both exited the table this week.
Funds and trusts section written by ii’s Kyle Caldwell.


As a military retiree, I’ve developed a soft spot for retirees of the traditional retirement age. Although I have a long way to go before reaching the age to be able to withdraw my dividends tax-free, this is an advantage traditional retirees have over us younger investors.
Moreover, with the plethora of covered call funds in recent years, this makes it easier for those of age to withdraw tax-free if you own a tax-advantaged account like a Roth IRA. If this is you, then you may want to consider this covered call duo for reasons I’ll discuss later.
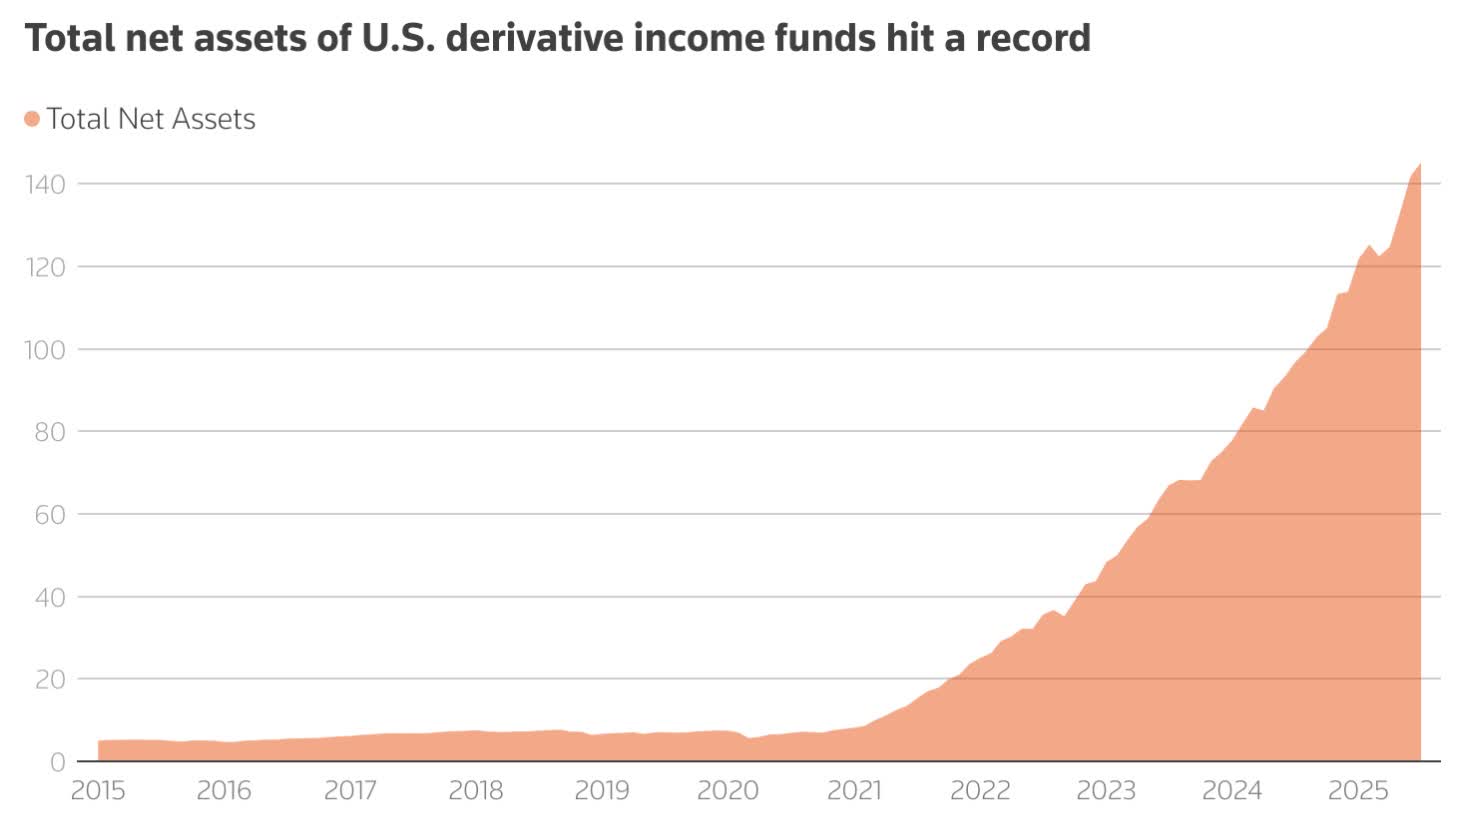
Below you can see the chart of the growing popularity of derivative income among investors. Until around 2021/2022, inflows remained flat but rose rapidly over the past 4 years or so, likely due to high inflation.
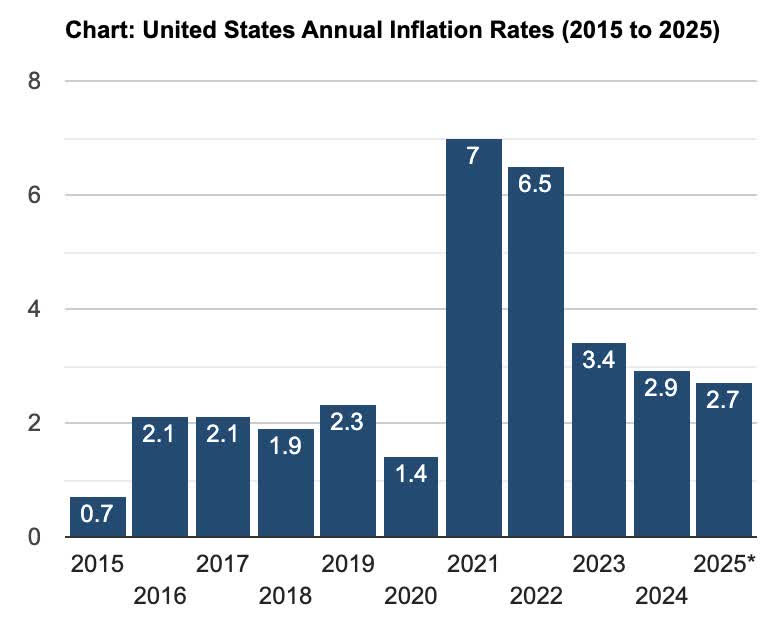
With inflation increasing since the pandemic and forcing the Fed to raise interest rates as a result, consumers have definitely felt the impact, increasing the need for more income.
Below you can see inflation spiked in 2021, causing rates to rise. Since then, inflation has slowly come back down, currently sitting at 2.7%, closer to the Federal Reserve’s target of 2%.
With unemployment rising and risks growing of a recession, rate cuts appear imminent, although uncertainty remains due to tariffs. I do think we’ll see at least one rate cut this year, something I’ve echoed over the past year.
And while consumers are likely to feel relief from lower rates, the need for additional income won’t likely decrease as a result.
Moreover, if you’re a retiree currently living off income, then covered call ETFs may be worth considering. And for reasons I’ll lay out below, this duo may be suitable for your tax-advantaged accounts.
First on the list is the covered call ETF by asset manager Goldman Sachs (GS). For starters, I’ll say I haven’t been much of a fan of their BDC, Goldman Sachs BDC (GSBD), but their covered call ETFs seem solid so far.
For one, they’re actively managed instead of passively. And their main goal is to provide income with the potential to see capital appreciation, perfect if you’re a retiree. If you’re of age, it’s likely you focus more on income vs. capital appreciation, which is why covered call funds may be a good fit for your portfolio.
GPIQ looks to track the performance of the Nasdaq-100, so it’s obvious the fund is highly concentrated in the Technology (XLK) sector. They currently have 107 holdings and use an overwrite strategy to write calls on a varying percentage of the portfolio, usually between 25% and 75%.
Additionally, they use Flex Options, which allows management to change the options strike prices and dates, mitigating downside risks somewhat. This also allows them to participate in potential upside, not capping it like a lot of covered call ETFs do.
Something else I also like about GPIQ is that their expense ratio is more reasonable when compared to other premium income ETFs at just 0.29%. This means for every $10,000 invested, you’re paying an annual fee of roughly $30.
Some peers have expense ratios closer to 1%, or even above. For comparison, the NEOS NASDAQ-100(R) High Income ETF (QQQI) has an expense ratio of 0.68%, more than twice that of GPIQ.
JPMorgan Nasdaq Equity Premium Income ETF (JEPQ) and Roundhill Innovation-100 ODTE Covered Call Strategy ETF (QDTE) were higher at 0.35% and 0.97%, respectively.
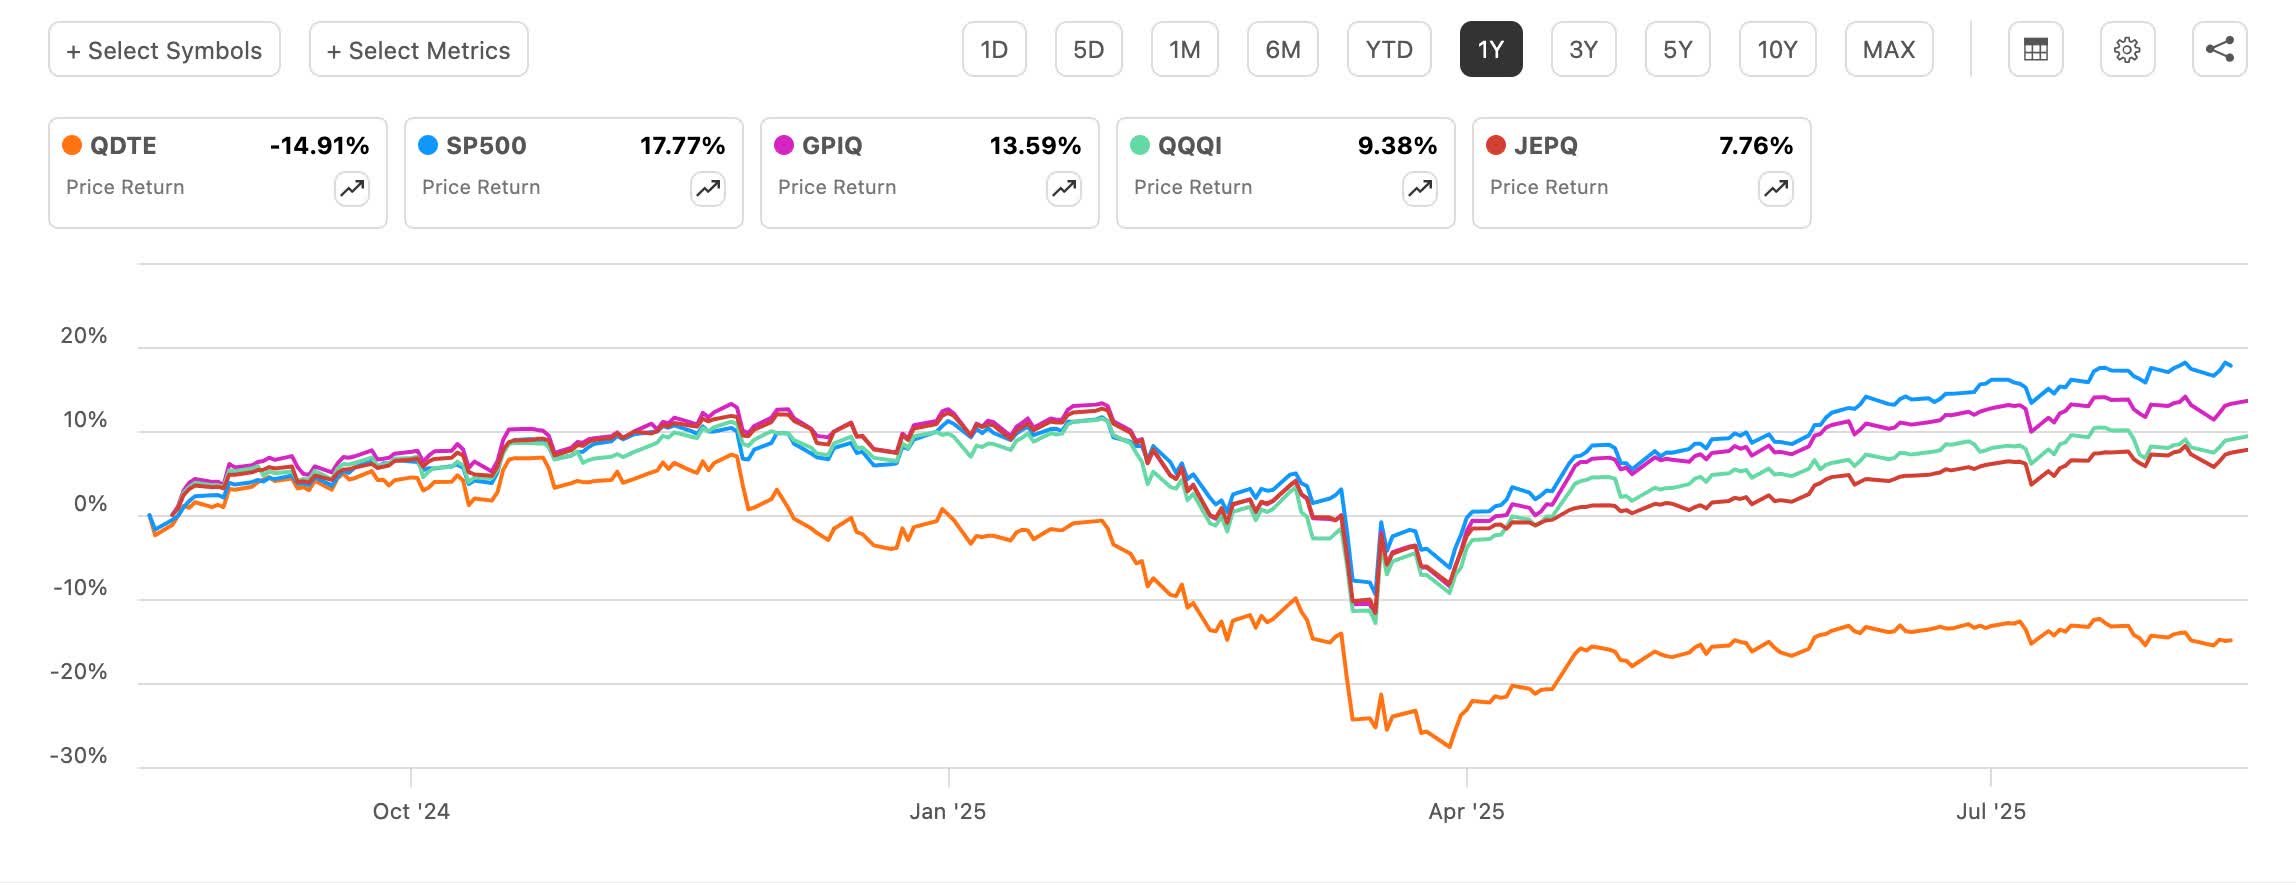
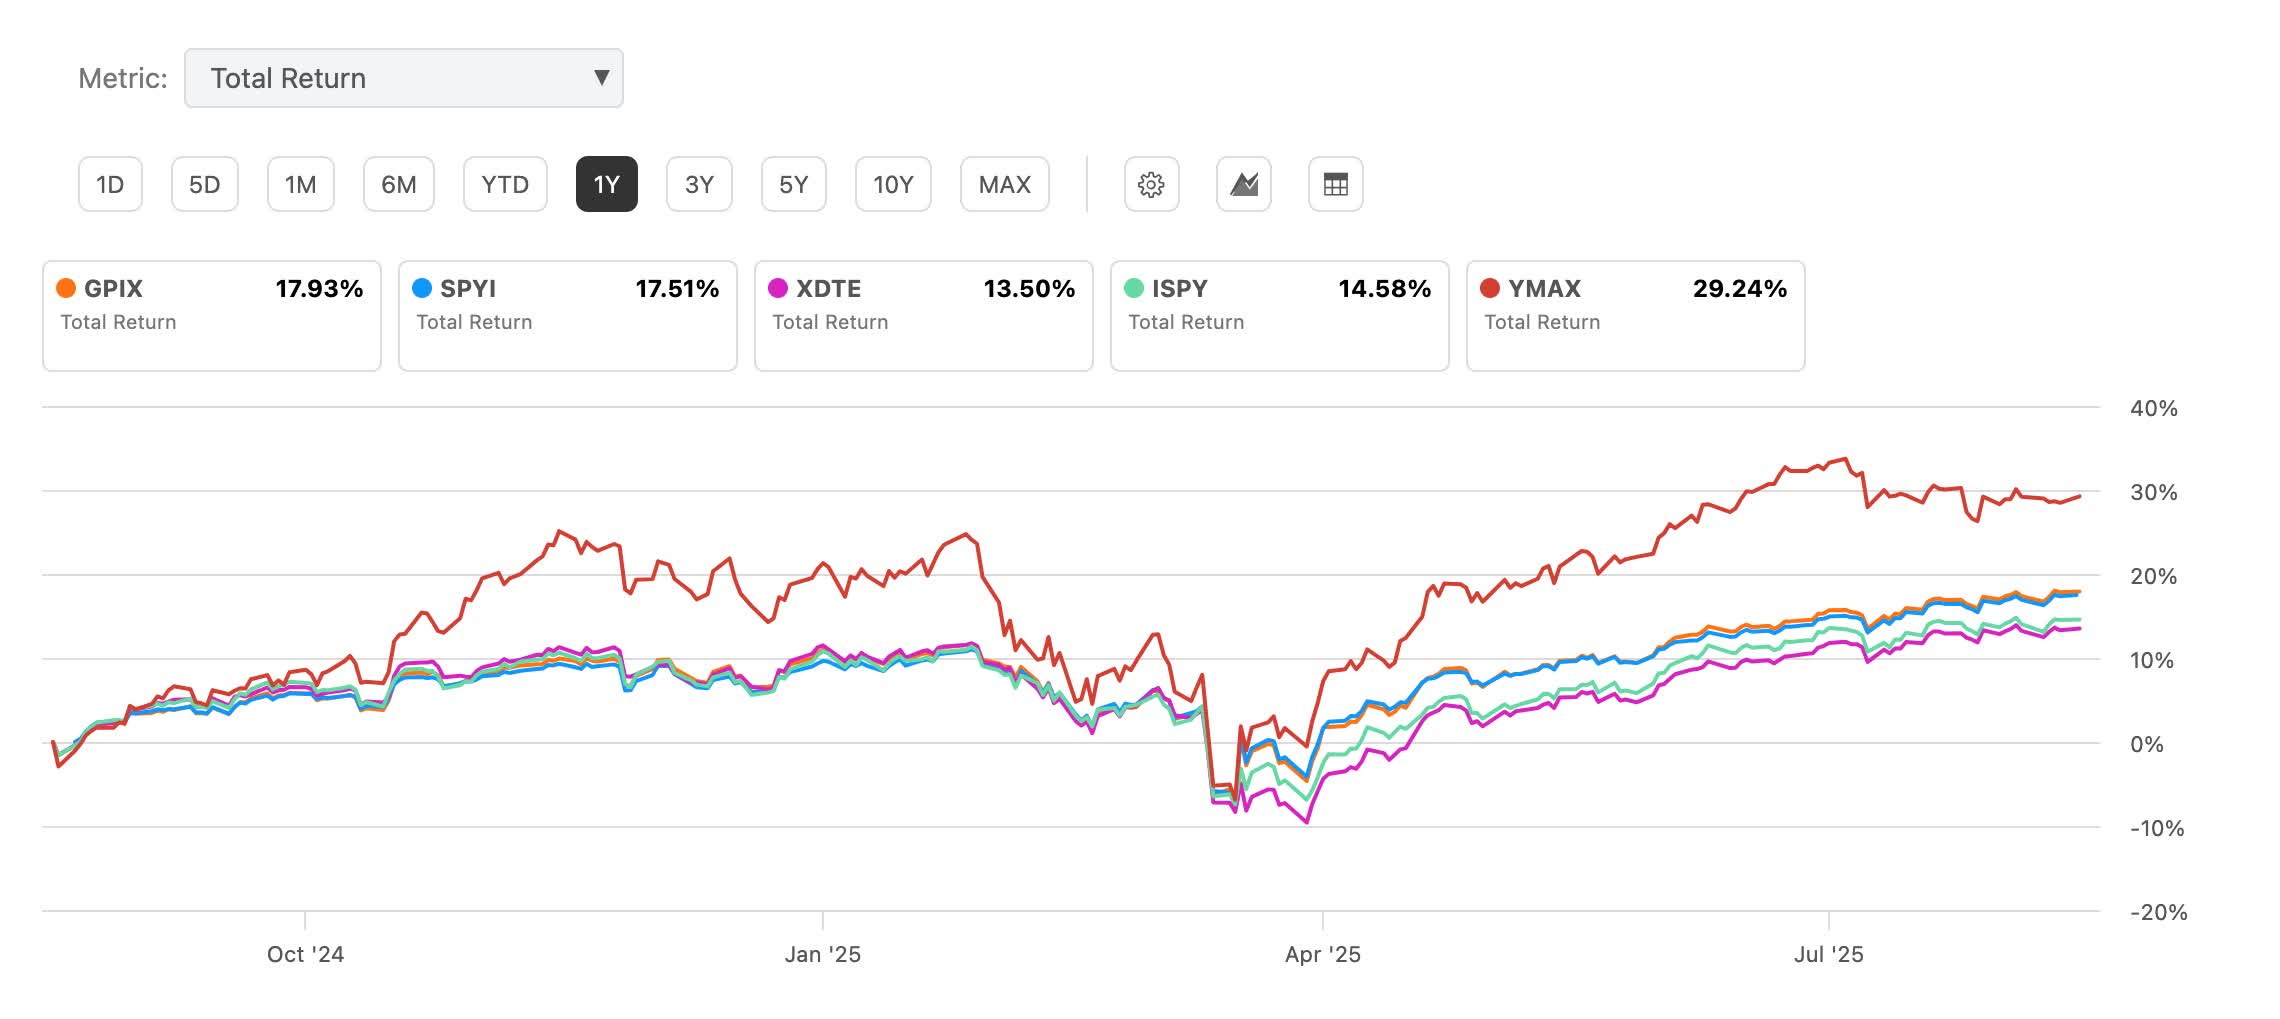
Below is how each fund performed over the past year in comparison to the S&P (SP500). GPIQ outperformed, up 13.59% in price returns.
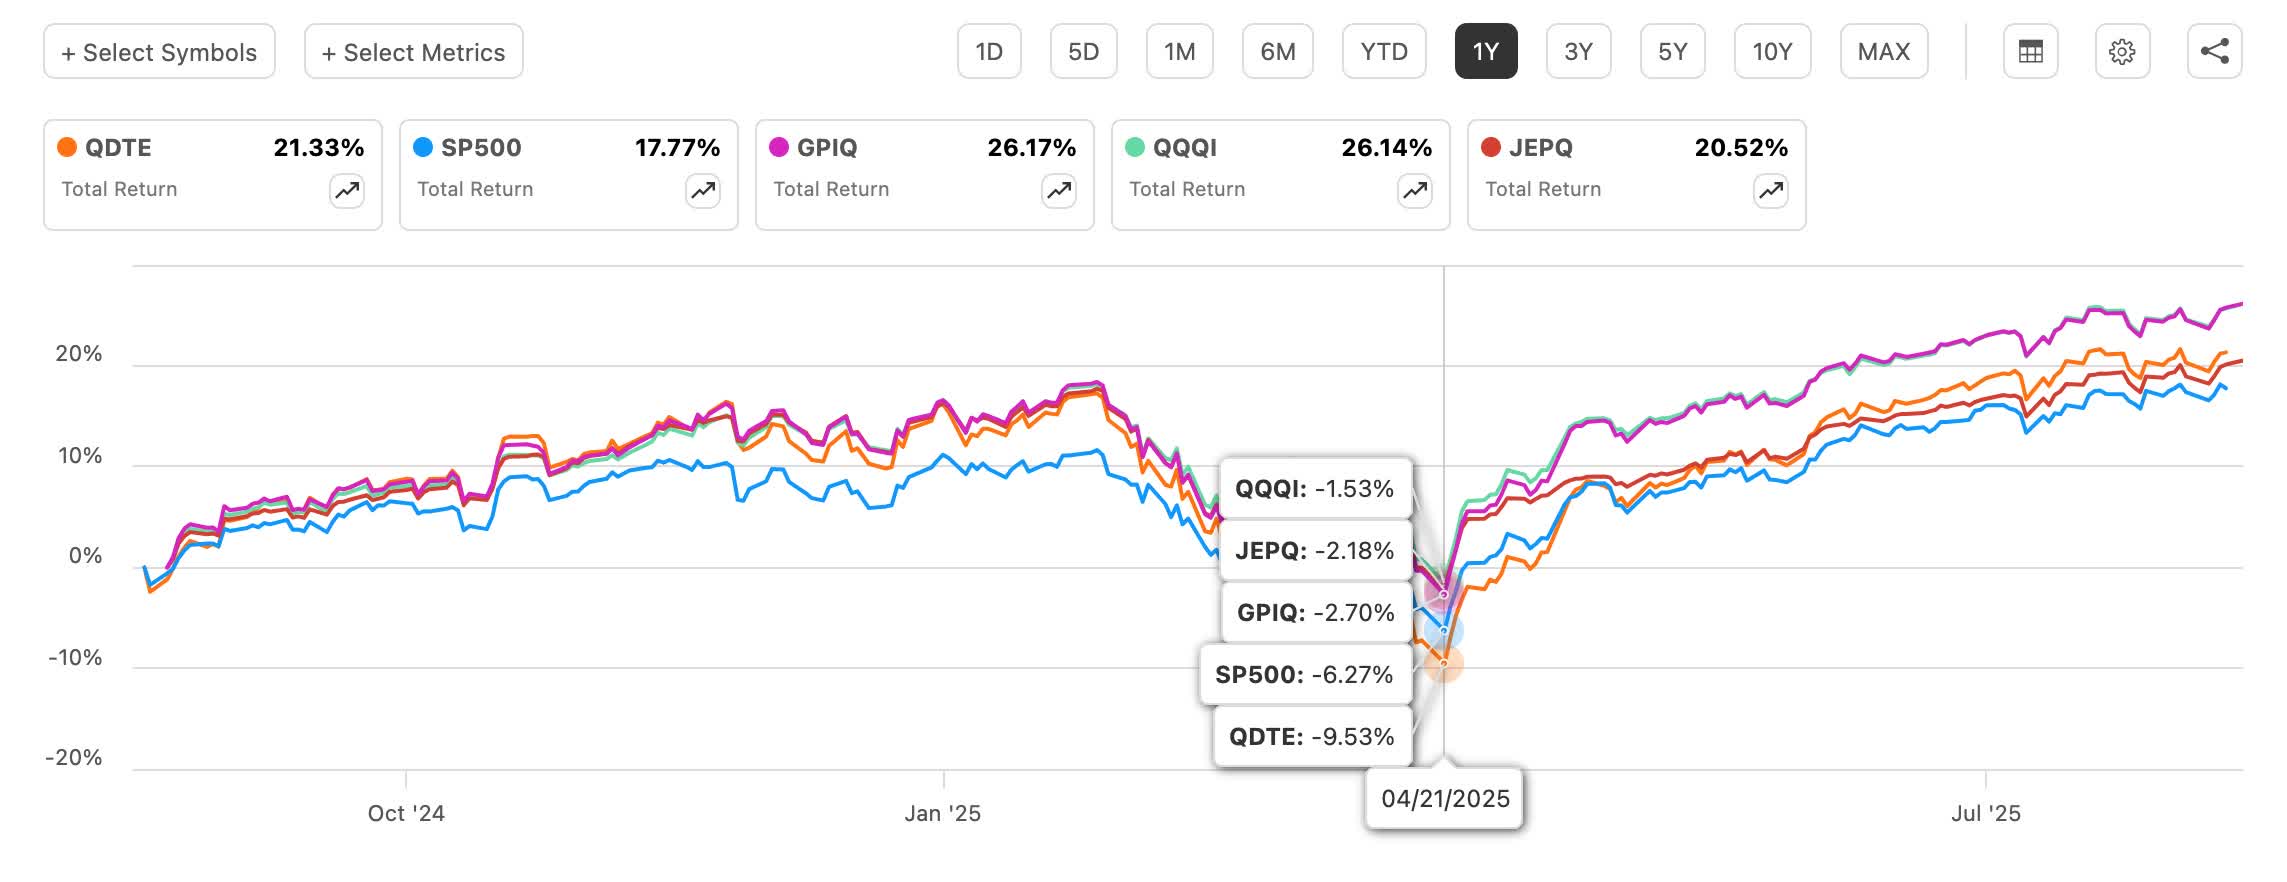
When adding in distributions, GPIQ also outperformed, although only slightly when compared to QQQI. While GPIQ managed to beat QQQI, the latter saw less of a dip during April’s Liberation Day, down 1.53% compared to 2.70% for GPIQ.
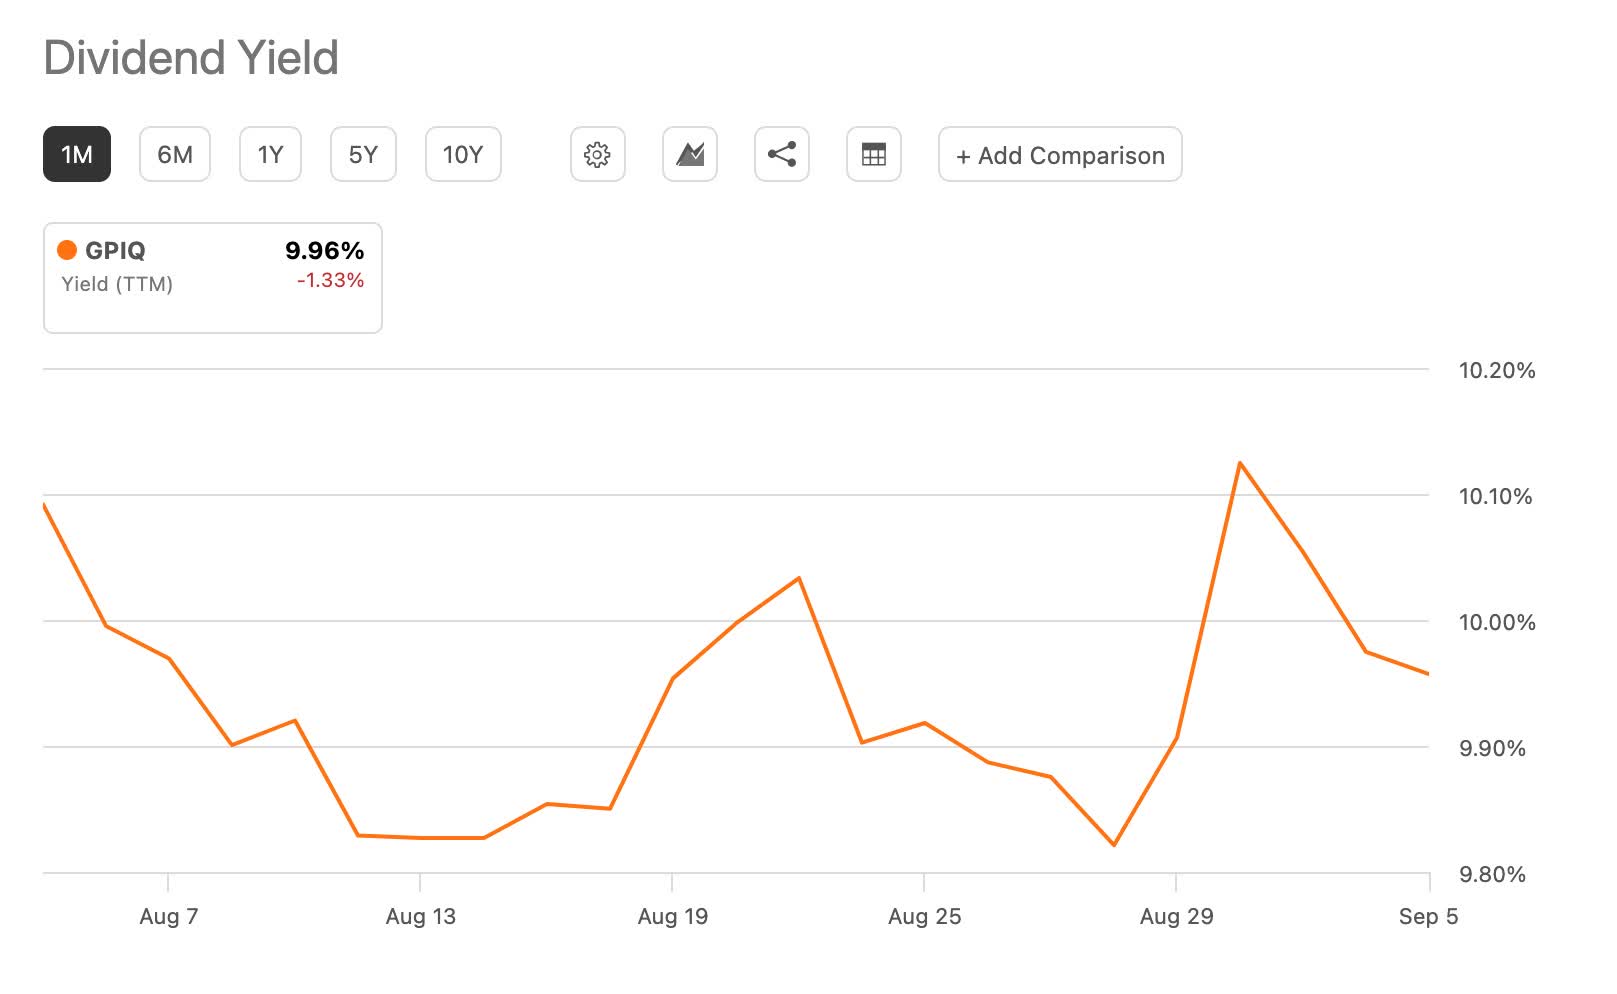
With a distribution yield of nearly 10%, GPIQ does have the lowest amongst the peer group. But their lower cost structure and better performance may be an attractive trade-off.
The other half of the duo is another fund by the asset manager, GPIX. Although both funds have a lot of the same holdings, like NVIDIA (NVDA), Microsoft (MSFT), Apple (AAPL), and Amazon (AMZN), GPIX has Berkshire Hathaway (BRK.A) (BRK.B) in its top 10 holdings.
And since they track the S&P, they have a significantly larger portfolio with 508 holdings currently. Both GPIQ and GPIX share the same active strategy, expense ratio, and inception date of October 24, 2023.
The difference is GPIX doesn’t have as high a concentration in the technology sector, with this making up 33.29% of its portfolio compared to 53% for GPIQ. The Financial (XLF) sector is GPIX’s second largest sector, while Communication Services (XLC) is GPIQ’s second largest.
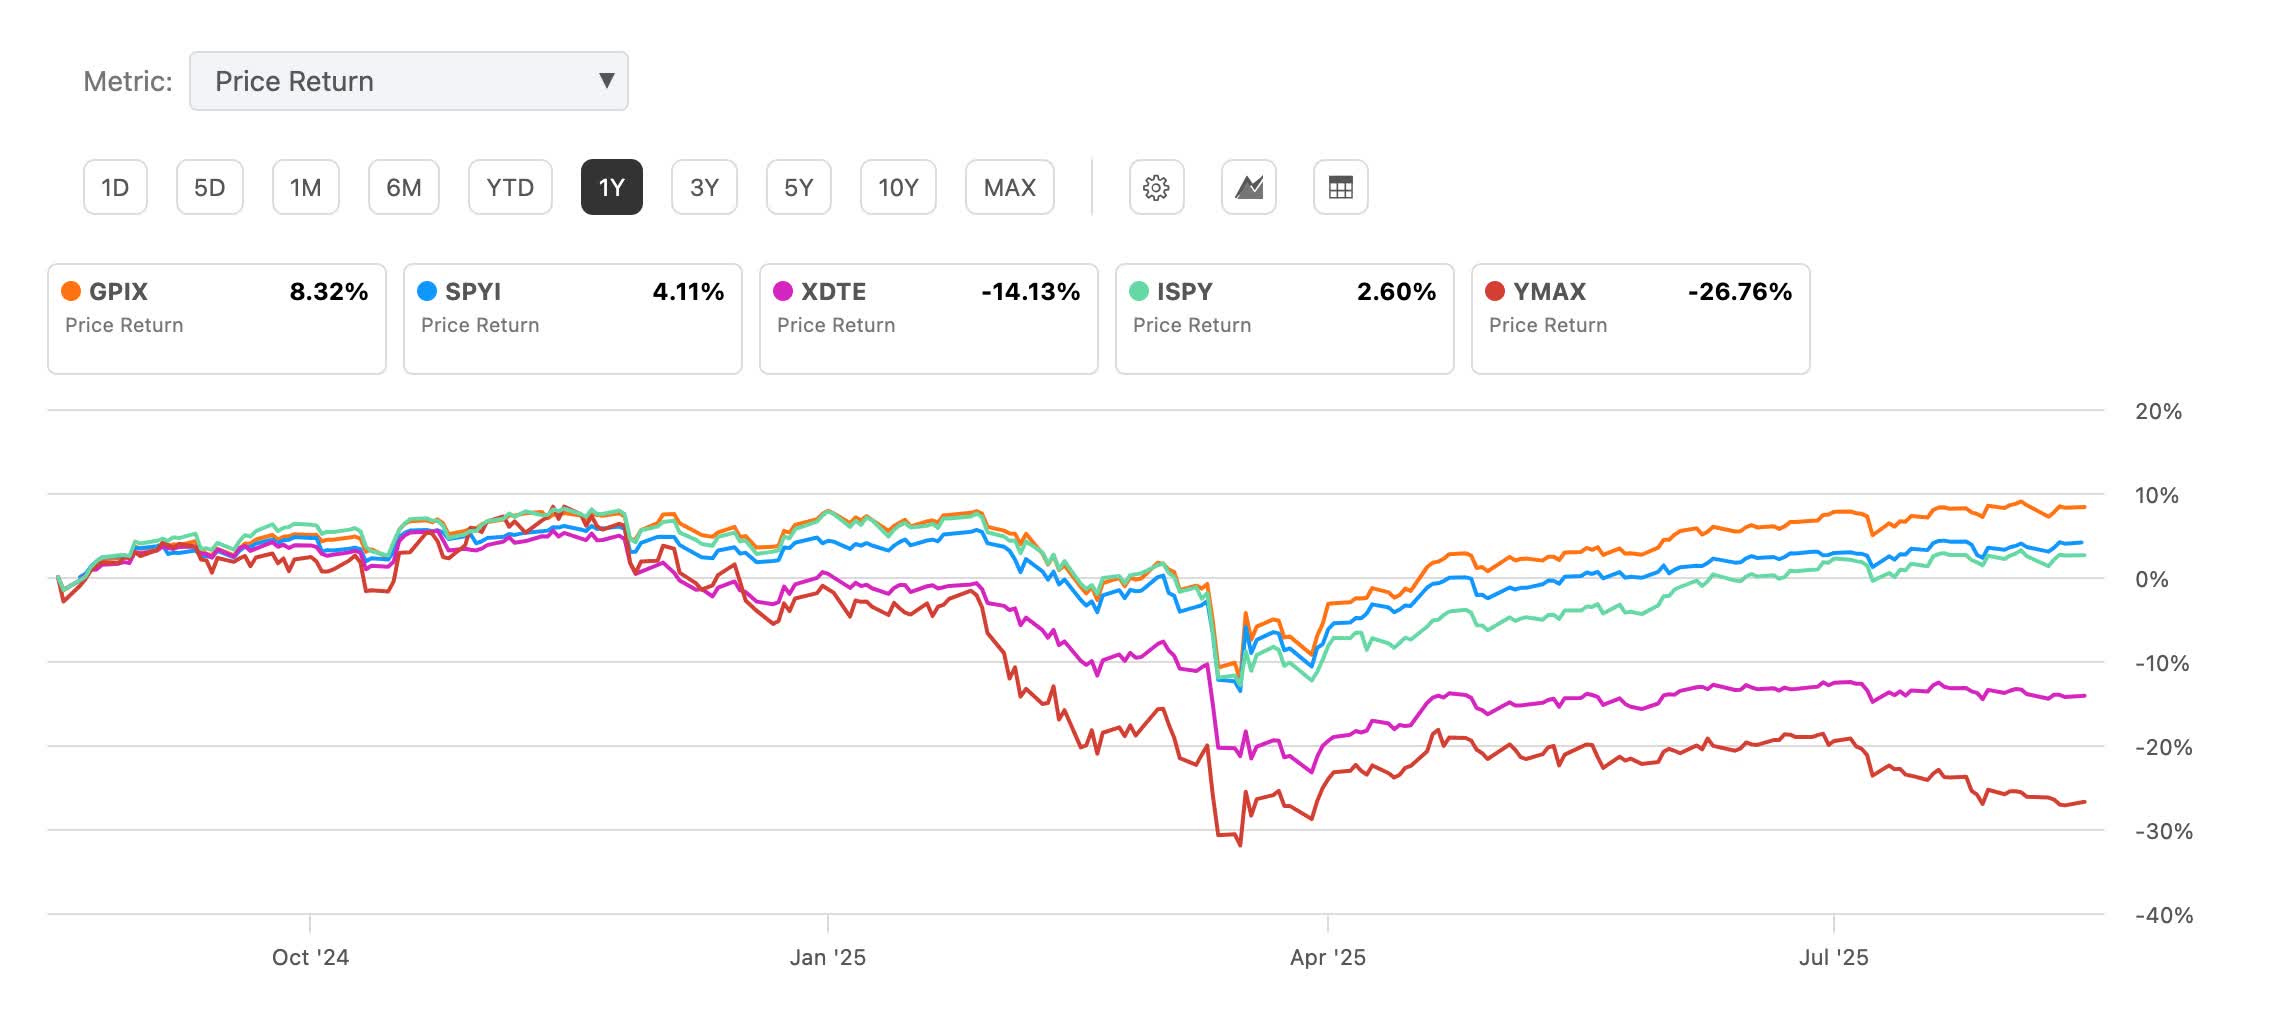
GPIX has outperformed its peer group, even the popular NEOS S&P 500(R) High Income ETF (SPYI), up 8.32% in the past year compared to the latter’s 4.11%.
In total returns, GPIX managed to again edge out SPYI, but the YieldMax Universe Fund of Option Income ETFs (YMAX) bested the entire peer group in total returns. But this is due to their ridiculously high yields. YMAX’s current distribution yield sits above 67%, compared to 8.16% for GPIX and 11.83% for SPYI.
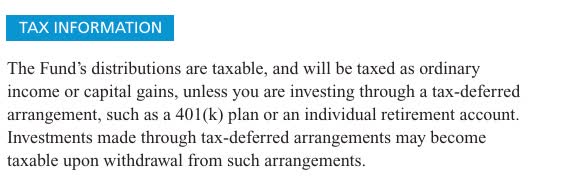
While many covered call ETFs’ distributions are considered return of capital, both GPIQ’s and GPIX’s distributions are mostly ordinary income or capital gains. Meaning, they’re better held inside a tax-sheltered account like a Roth IRA. Return of capital distributions are tax-deferred until sale, making them more appealing to younger investors with taxable accounts.
Below is what you’d collect monthly if you invested $100,000 split between both funds using their average distributions through the first 9 months. Investors should also be aware that distributions can vary.
But both funds’ distributions have stayed relatively similar to previous months. At the current price of around $51/$52 a share for both at the time of writing, you’d collect $744 on a monthly basis. While this may not be enough to cover something like a mortgage, this could be used for medical expenses, car payments, or unexpected bills.
| Fund | Share Price | Share Count | Avg distribution | Monthly Payout |
| GPIQ | $51.49 | 971 | $0.4210 | $409 |
| GPIX | $51.57 | 969 | $0.3456 | $335 |
Furthermore, there are covered call funds, like many of YieldMax’s, with much higher yields, but the risk with these is continued NAV erosion, which leads to price decay over time.
So far, both GPIQ and GPIX have performed well as a result of NAV growth. And because they are both actively managed, management will rebalance its portfolio to mitigate underperformance.
Technology stocks have continued to perform well and carry the market overall. But both funds are subject to downside if the tech sector enters into a correction. Because the sector has performed well recently, it could underperform going forward if the market experiences a crash or correction.
For investors looking to buy, it may be prudent to wait for a potential pullback like the one we saw in April. If you just want steady income and don’t care much about price, then GPIQ and GPIX may be suitable investments due to their cost advantages and outperformance vs. peers.

FY26 target dividend increased to a minimum of 6.18 pence per share

Current share price 78.9p a yield 7.75%
GCP Infrastructure – Substantive progress
| % of total assets 31/03/25 | Cashflow type | Project type | |
|---|---|---|---|
| Cardale PFI | 13.4 | Unitary charge | PFI/PPP (18 projects) |
| Gravis Solar 1 | 9.4 | ROC/FiT | Commercial solar |
| GCP Programme Funding S14 | 5.7 | ROC/RHI/Merchant | Biomass |
| GCP Bridge Holdings | 5.1 | ROC/PPA | PPE – Energy-from-waste / Energy efficiency |
| GCP Biomass 2 | 5.0 | ROC/PPA | Biomass |
| GCP Programme Funding S10 | 4.9 | Lease | Supported living |
| GCP Social Housing 1 B | 4.0 | Lease | Supported living |
| Gravis Asset Holdings H | 4.0 | ROC/RHI | Onshore wind |
| GCP Green Energy 1 | 3.8 | ROC/PPA | Commercial solar/onshore wind |
| GCP Rooftop Solar Finance | 3.7 | FiT | Rooftop solar |
Source: GCP Infrastructure Investment
The list of revenue counterparties is not much changed since we last published. ENGIE Power Limited has entered the list replacing Total Gas and Energy Limited. In the list of project service providers, Veolia ES (UK) Limited, Urbaser, and Gloucester County Council have replaced Pentair, Atlantic Biogas, and Thyson.
| Firm | % of total portfolio |
|---|---|
| Ecotricity Limited | 9.4 |
| Npower Limited | 7.3 |
| Viridian Energy Supply | 7.2 |
| Statkraft Markets GmbH | 5.9 |
| Bespoke Supportive Tenancies Limited | 5.1 |
| Office of Gas and Electricity Markets | 4.7 |
| Smartestenergy Limited | 4.5 |
| Good Energy Limited | 4.5 |
| Gloucestershire County Council | 4.2 |
| ENGIE Power Limited | 4.0 |
Source: GCP Infrastructure Investments
| Firm | % of total portfolio |
|---|---|
| WPO UK Services Limited | 20 |
| PSH Operations Limited | 13 |
| Solar Maintenance Services Limited | 10 |
| A Shade Greener Maintenance | 9 |
| Vestas Celtic Wind Technology Limited | 8 |
| Veolia ES (UK) Limited | 5 |
| Cobalt Energy Limited | 5 |
| Urbaser Limited | 4 |
| Gloucester County Council | 4 |
| 2G Energy Limited | 4 |
Source: GCP Infrastructure Investments
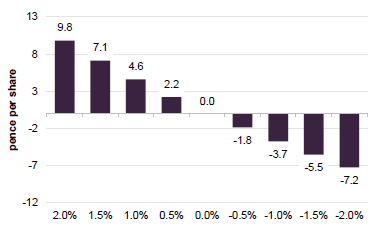
The investment adviser also provides a sensitivity analysis for its cash flows. Based on a total fair value for GCP’s assets, a 0.5% increase in its discount rate would take about 3.0% off the total fair value. A 0.5% decrease in discount rates would add 3.2%.
Source: GCP Infrastructure Investments
Source: GCP Infrastructure Investments
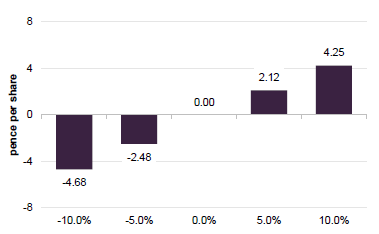
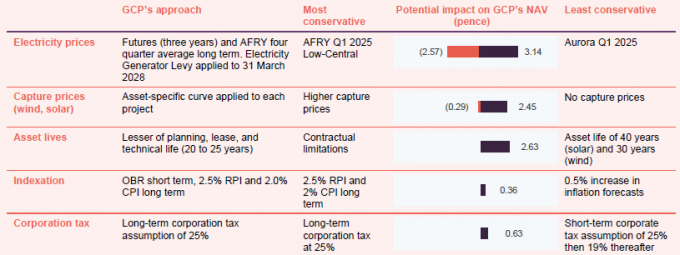
Clear evidence of reduced sensitivity to power prices
One of GCP’s aims for its capital recycling efforts is to reduce the portfolio’s sensitivity to fluctuations in power prices. Based on the numbers in Figure 10, it is achieving this. As at end March 205, a 10% fall in power price forecasts would take 4.68p off GCP’s NAV. Back at the end of September 2025, before the rooftop solar and onshore windfarm sales, that figure was 9.11p.
Higher inflation would be good news for GCP. Recent inflation figures suggest things are going its way in this respect. However, the quid pro quo for this tends to be higher for longer interest rates, which influence the discount rate. At end June 2025, the weighted average discount rate on the portfolio was 8.33%, marginally lower than the 8.36% number for end March. That just reflects principal and interest payments across the portfolio.
As in previous reports, we have included a table (Figure 14) showing the impact of GCP’s conservative valuation assumptions on its NAV. The range shows what would happen to the NAV were GCP to adopt the most conservative or least conservative assumptions of peers when calculating its NAV. Whilst the sensitivity to power prices has fallen, it is still an important consideration. GCP uses the average of the last four quarterly power price curves produced by AFRY (a specialist consultancy that provides energy market forecasting and modelling used for long-term infrastructure valuations).
Source: GCP Infrastructure Investments
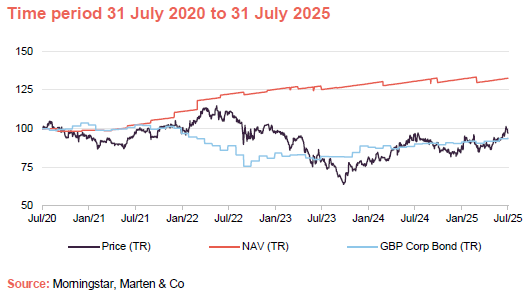
Despite the many headwinds facing the company in recent years, GCP’s NAV total return has remained positive and has held up fairly well, relative to the return from sterling corporate bonds as shown in Figure 16.
Source: Morningstar, Marten & Co

Source: Morningstar, Marten & Co
It is encouraging to see the impact of a narrower discount on GCP’s share price returns, but there is hopefully even more to come.
| 3 months (%) | 6 months(%) | 1 year(%) | 3 years (%) | 5 years (%) | |
|---|---|---|---|---|---|
| GCP share price | 5.3 | 8.6 | 0.3 | (13.9) | (3.2) |
| GCP NAV | 1.7 | 0.5 | 1.6 | 8.4 | 31.9 |
| Sterling corporate bonds | 3.1 | 3.5 | 5.6 | 8.7 | (4.7) |
Source: Morningstar, Bloomberg, Marten & Co
The next section looks at what has been driving GCP’s NAV return since we last published.
The largest negative move relates to a change to the assumed life of a portfolio of gas-to-grid anaerobic digestion assets. GCP has an equity exposure to these assets after the borrower experienced problems.
| Driver | Description | Impact (£m) | Impact (pence per share) |
|---|---|---|---|
| Inflation forecast | Inflation movements in the period | 6.9 | 0.81 |
| O&M budget update | Revised operating budget reflecting improved forecast cash flows | 3.1 | 0.36 |
| Other upward movements | Other upward movements across the portfolio | 5.1 | 0.60 |
| Asset specific revaluations | Revised long-term availability forecast for a gas-to-grid anaerobic digestion portfolio | (24.5) | (2.87) |
| Actual performance | Lower-than-forecast renewables generation | (12.7) | (1.49) |
| Discount rates | Higher discount rates | (3.5) | (0.41) |
| Other | Other, including the impact of hedging | (0.4) | (0.05) |
| Total | (26.0) | (3.05) |
Source: GCP Infrastructure Investments
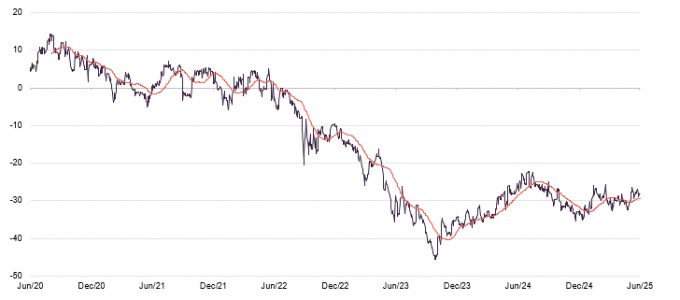
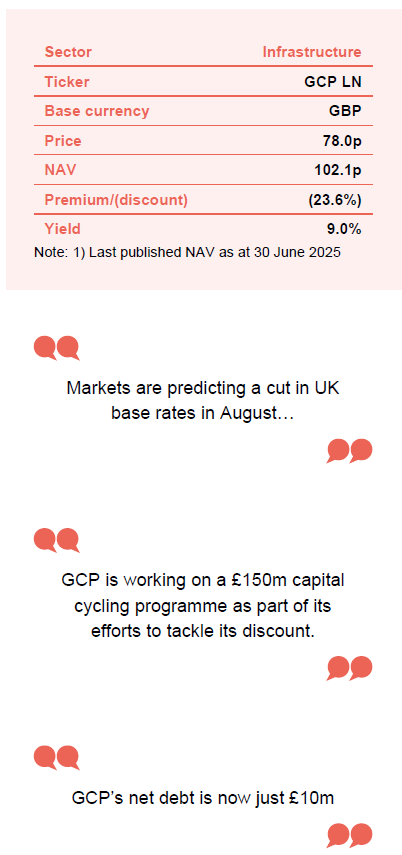
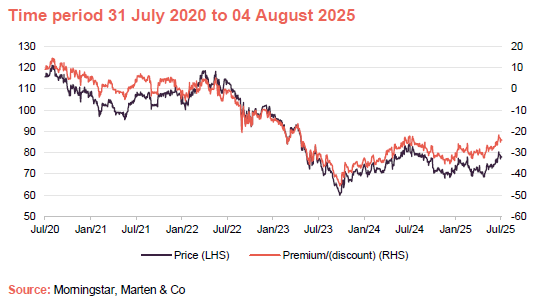
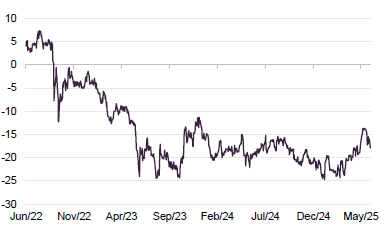
Over the past 12 months, GCP’s shares have traded on an average discount of 29.1%, a high of 22.2%, and a low of 35.3%. As of publishing, the discount stood at 23.6%.
Source: Morningstar, Marten & Co
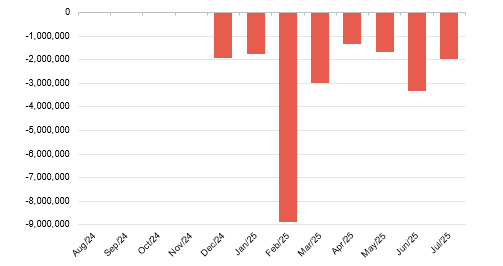
As discussed in previous notes, GCP’s discount widened over 2021 and 2022 as interest rates began to rise. The discount has narrowed somewhat since helped by share buybacks (as shown in Figure 20) and a capital recycling programme aimed at providing solid evidence of the validity of the NAV; improving the overall quality of the portfolio (in particular, reducing the sensitivity to power price fluctuations); and providing cash to both fund returns to investors and to reduce its floating rate debt. We believe that the discount ought to narrow further from here.
As Figure 20 illustrates, in pursuit of the capital recycling programme, GCP has now bought back over 23.8m shares, worth about £18.8m,
Source: Marten & Co
| Strengths | Weaknesses |
|---|---|
| Diversified portfolio across a range of infrastructure subsectors and borrowers | Relatively illiquid portfolio |
| Public-sector backed cashflows | Historically, GCP has exhibited more sensitivity to factors such as power prices than might be expected of a debt fund |
| Low gearing | Need to tackle persistent wide discount is preventing it from making new investments |
| Responds positively to higher inflation | |
| Conservative valuation assumptions | |
| Opportunities | Threats |
| Discount narrowing potential | Rising UK interest rates |
| Government needs private capital to fund infrastructure | While discount persists, vulnerable to activist investors |
Source: Marten & Co
| Bull | Bear | |
|---|---|---|
| Performance | Despite the odd setback, NAV has been relatively stable since launch | NAV returns have been on the low side in recent years, dragging down long-term averages |
| Dividends | Dividend looks increasingly reliable and headline yield is very attractive | Dividend cut in 2020 and flat dividend since at odds with rising returns from other debt investments |
| Outlook | Should be set fair if it can continue to deliver on its capital recycling programme | Need to see progress on social housing disposal that was flagged some time ago. Further delay/NAV writedown could undermine confidence |
| Discount | Discount appears to be on narrowing trend and there is more to go for | If confidence in UK economy and government finances was shattered, discount could widen again |
Source: Marten & Co


Since interest rates began to rise to tackle inflation, GCP Infrastructure (GCP) has, like many similar investment companies, been afflicted by a wide share price discount to net asset value (NAV). The board and the investment adviser have been working to tackle this through a policy of capital recycling. This aims to free up £150m to materially reduce the drawn balance on the revolving credit facility (RCF), return at least £50m to shareholders, and rebalance the portfolio to improve its risk adjusted returns.
As we discuss in this report, share buybacks have stepped up a gear, the discount is narrowing, the RCF has been reduced to just £10m, and the portfolio’s sensitivity to electricity prices has been cut significantly.
There is more to do, but – perhaps attracted by the high dividend yield and improving outlook – investors appear to be waking up to GCP’s attractions once again.
GCP aims to provide shareholders with sustained, long-term distributions and to preserve capital by generating exposure primarily to UK infrastructure debt or similar assets with predictable long-term cashflows.
| Domicile | Jersey |
|---|---|
| Inception date | 22 July 2010 |
| Manager | Philip Kent |
| Market cap | 657.4m |
| Shares outstanding (exc. treasury shares) | 842.783m |
| Daily vol. (1-yr. avg.) | 1.343m shares |
| Net gearing | 1.2% |
GCP’s discount has narrowed somewhat since helped by share buybacks and a capital recycling programme aimed at providing solid evidence of the validity of the NAV; improving the overall quality of the portfolio (in particular, reducing the sensitivity to power price fluctuations); and providing cash to both fund returns to investors and to reduce its floating rate debt. We believe that the discount ought to narrow further from here.
Despite the many headwinds facing the company in recent years, GCP’s NAV total return has remained positive and has held up fairly well, relative to the return from sterling corporate bonds.
It is encouraging to see the impact of a narrower discount on GCP’s share price returns, but there is hopefully even more to come.
| 12 months ended | Share price total return (%) | NAV total return (%) | Earnings1 per share (pence) | Adjusted2 EPS (pence) | Dividend per share (pence) |
| 30/09/2020 | (2.0) | (0.2) | (0.08) | 7.65 | 7.6 |
| 30/09/2021 | (7.9) | 7.2 | 7.08 | 7.90 | 7.0 |
| 30/09/2022 | 3.8 | 15.7 | 15.88 | 8.30 | 7.0 |
| 30/09/2023 | (25.2) | 3.6 | 3.50 | 8.58 | 7.0 |
| 30/09/2024 | 28.2 | 4.6 | 2.25 | 7.09 | 7.0 |
Source: Morningstar, Marten & Co. Note 1) EPS figures taken from 30 September each year. Note 2) Adjusted earnings per share removes the impact of unrealised movements in fair value through profit and loss
Regular, sustainable, long-term income
GCP Infrastructure Investments Limited (GCP) is a Jersey-incorporated, closed-ended investment company whose shares are traded on the main market of the London Stock Exchange. GCP aims to generate a regular, sustainable, long-term income while preserving investors’ capital. The company’s income is derived from loaning money, predominantly at fixed rates, to entities which derive their revenue – or a substantial portion of it – from UK public-sector-backed cashflows. Wherever it can, it tries to secure an element of inflation protection.
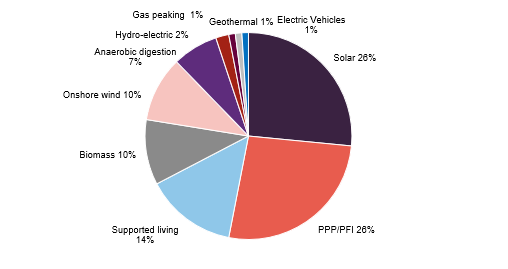
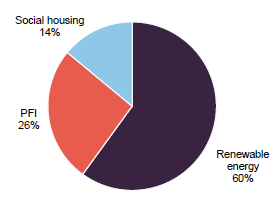
In practice, GCP is diversified across a range of different infrastructure subsectors, although its focus has shifted more towards renewable energy infrastructure over the last few years. It has exposure to renewable energy projects (where revenue is partly subsidy and partly linked to sales of power), PFI/PPP-type assets (whose revenue is predominantly based on the availability of the asset), and specialist supported social housing (where local authorities are renting specially-adapted residential accommodation for tenants with special needs).
The board is targeting a full-year dividend of 7.0p per share for the financial year ended 30 September 2025. At the half-year mark, the trust was on track to achieve this, having declared dividends totalling 3.5p per share.
GCP had driven down the RCF balance to £41m by the end of March…
As we highlighted on the front page, GCP is working on a £150m capital cycling programme as part of its efforts to tackle its discount. Money freed up is being used to reduce GCP’s leverage. Drawings on the revolving credit facility (RCF) totalled £43m at end June 2025, down from £57m at end September 2024.
In its latest NAV announcement, GCP revealed that it had reached a settlement agreement in respect of the contractual claim relating to the accreditation of a portfolio of solar projects under the Renewables Obligation scheme (there was a question mark over whether some solar projects were eligible to receive government subsidies). This has been rumbling on for some time – we flagged it in our January 2021 note, for example.
…but with an influx of money from the settlement of a claim, GCP’s net debt is now just £10m
GCP had accrued an amount in the NAV for the anticipated settlement, and so this did not have much impact on the NAV. However, following receipt of the money, GCP’s net debt has fallen to about £10m, equivalent to gearing of just 1.2%.
GCP also intends to return at least £50m of capital to shareholders. We show its recent share buyback activity on page 12.
Markets are predicting a cut in UK base rates in August, but persistent inflation and low/negative growth numbers are weighing on sentiment
UK economic growth numbers have been weak, with a fall in GDP reported for May, following on from another monthly contraction in April. In such an environment, the predictable income provided by GCP might seem all the more attractive.
The Bank of England cut its base rate to 4.25% in May 2025, but inflation figures have been coming in higher than expected, with UK CPI running at 3.6% and RPI (which is still used to inflate renewable energy subsidies) coming in at 4.4% in June. We could still see another interest rate cut in August, but until inflation is looking better-controlled, more aggressive rate-cutting seems unlikely.
10-year gilt yields, which arguably have a bigger influence on the rating of funds such as GCP than short-term rates, have been fairly flat this year. A number of commentators are concerned about levels of UK government debt, which may be influencing long-term bond yields.
Source: Bloomberg
Source: Morningstar, Marten & Co
BBGI bid underscored the attractive valuations on offer in the infrastructure sector
As illustrated in Figure 2, discounts on infrastructure trusts have narrowed from lows. One catalyst for this was the bid for BBGI Global Infrastructure (a portfolio of equity stakes in PFI/PPP-type infrastructure projects) at a premium to its NAV. GCP still has about 27% of its portfolio exposed to debt funding for PPP/PFI projects.
Plenty for GCP to do if it returns to making investments, but the discount will be fixed first
Talk is growing that a cash-constrained UK government will take a fresh look at PFI-type structures to fund much-needed infrastructure investment in areas such as schools, hospitals, and prisons. This could open up new opportunities for GCP, were it to return to making new investments. The GCP board has been quite clear that it will not consider doing do so until the discount has narrowed to a point where returns on new investments are higher than the return on investing in the existing portfolio through buybacks.
While we wait for decisions on the way forward for PFI, GCP has highlighted the considerable opportunity in financing the transition to a world of net zero greenhouse gas emissions. The UK government’s latest auction round for CfD finance for renewables projects – AR7 – is underway. In this auction round, more capital has been allocated, and fixed-price energy deals are available at higher prices and for longer periods.
The government’s review into electricity markets decided against adopting zonal pricing for electricity. The decision has been welcomed by most investors in generation assets, but it does mean that additional investment will be needed in energy storage and in grid infrastructure, as much of the UK’s energy generation is not in the same parts of the country as energy demand.
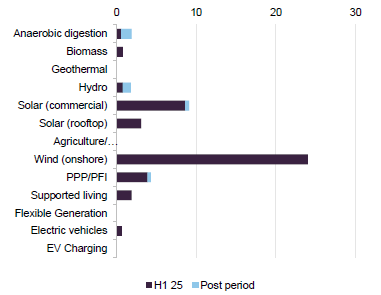
As of 30 June 2025, there were 48 investments in GCP’s portfolio (down from 50 when we last published). The average annualised portfolio yield was 7.9% (up from 7.8%), and the portfolio had a weighted average life of 11 years.
No new loans were made over H1 25, as the adviser was focused on GCP’s capital recycling programme. GCP does have commitments to advance loans to existing borrowers, however, and these totalled £13m over the first half of GCP’s financial year (H1 25), the six-month period ended 31 March 2025.
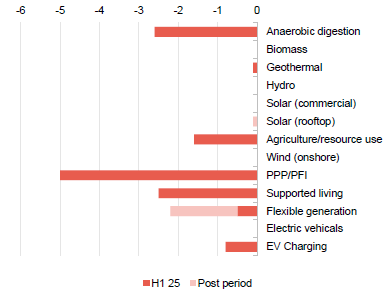
In terms of money coming back from the portfolio, the two big items were the sale of some rooftop solar assets for £6.8m in November 2024 (as referred to in our last note) and the sale of interests in two onshore wind farms in January 2025.
GCP had owned the windfarms since 2017. They fetched an initial £16.5m plus £1.3m of contingent proceeds and £1.0m of realised tax benefits. Although the proceeds were lower than the valuation in GCP’s end-September 2024 NAV, on average the company made a return of about 9.7% per annum on these assets.
Source: Gravis Capital Partners
Source: Gravis Capital Partners
The disposals have had some effect on the split of GCP’s portfolio as shown in Figure 3, with the percentage exposure to onshore wind falling from 13% to 10% since we last published.
Source: GCP Infrastructure Investments
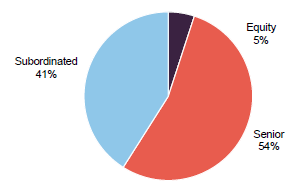
In terms of the sector split shown in Figure 5, renewables have fallen in favour of the other two sectors (as the pie shrinks). The portfolio also has slightly more exposure to higher ranking senior loans and less exposure to equity or equity like positions (which typically carry higher risk and return potential but rank lower in repayment priority).
The missing piece of the capital recycling programme is the planned disinvestment from GCP’s social housing exposure. We still expect that to happen.
Source: GCP Infrastructure Investments
Source: GCP Infrastructure Investments
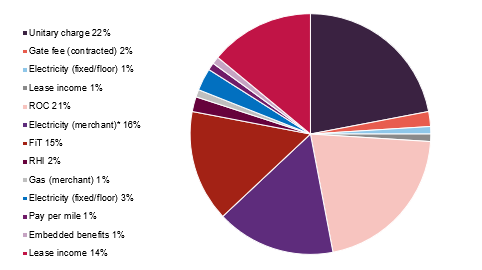
There was no significant change to the breakdown of GCP’s sources of income.
Source: GCP Infrastructure Investments

JPMorgan US Smaller Companies reports 12.4% first half fall; Riverstone Energy makes first disposal in its managed wind-down; Sirius Real Estate taps borrowers for more money; plus updates from HgCapital, Augmentum Fintech, RTW Bioscience and Sequoia Economic Infrastructure Income.
JPMorgan US Smaller Companies (JUSC) is having a difficult year, reporting a 12.4% fall in the first half of 2025 that underperformed the 10.3% decline in its Russell 2000 index benchmark. The £227m trust managed by Don San Jose, Daniel Percella and Jonathan Brachle at JP Morgan Asset Management, blamed volatility around US tariff policy and stock selection in industrials and consumer staples. Freshpet, a pet food supplier, suffered a slowdown in sales and Aaon, an air conditioning and heating equipment manufacturer, experienced supply chain issues. JUSC shares stand around 9% below net asset value, wider than the 6.6% one-year average discount.
Riverstone Energy (RSE) has sold a C$90m stake in listed Canadian oil and gas explorer Whitecap Resources at a 1.9% discount. The block sale paves the way for a US$115m return of capital via a compulsory share redemption, its first distribution under the wind-down of the company approved by shareholders last month.
Sirius Real Estate (SRE), the owner of business parks in the UK and Germany, has borrowed another €105m for its acquisition pipeline with the issue of loan notes that it will consolidate with its existing €359.9m of 1.75% bonds due in November 2028. The new notes were priced in line with the current trading of these. This follows strong demand for the company’s €350m seven-year bond issued in January.
HgCapital (HGT) has made new commitments to invest €350m in the Hg Genesis 11 fund and €150m in Hg Mercury 5 with the first capital calls expected in 2027. Half-year results from the private equity investor confirm last month’s trading statement which showed a flat start to the year with net asset value (NAV) per share slipping 0.4% to 539.5p in the six months to 30 June 2025. Since then NAV per share has lifted 0.3% to 541.2p at 31 August. The interim dividend has been held at 2p per share.
Augmentum Fintech (AUGM) chief executive Tim Levene says last week’s $3.3bn flotation of Gemini, the US cryptocurrency exchange and custodian bank which accounts for 3.4% of the growth capital fund, was an “important milestone” for the company, whose shares trail on a 42% discount, and the fintech ecosystem. “We are pleased to see strong investor demand for the offering, which validates the progress Gemini has made in building a regulated and trusted platform for crypto trading and custody. The IPO provides further evidence of the increasing maturity of the digital assets sector.”
Rumours that Novartis might bid for Avidity Biosciences helped RTW Bioscience Opportunities (RTW) gain 7.8% in August ahead of the 3.9% rise in the Nasdaq Biotech index but slightly behind the 8% advance in the smaller company Russell 2000 Biotech benchmark. Net asset value per share stood at $1.98 at 31 August. Avidity shares rallied 27% to represent 8.4% of net assets. “Having undertaken some €300m of acquisitions this year, including the recently announced £101.1m acquisition of the Hartlebury Trading Estate which was transformational for our BizSpace platform in the UK, we continue to see attractive opportunities to scale our business in both Germany and the UK. This additional funding will help support that growth,” said chief financial officer Chris Bowman.
Sequoia Economic Infrastructure Income (SEQI) says net asset value (NAV) per share of its £1.5bn debt portfolio rose 0.66p to 92.48p from 91.82p in August. It says it is well positioned to benefit from current high interest rates with 58.5% invested in fixed rate loans. Following the Bank of England’s 0.25% cut in base rate to 4% last month, just one more rate reduction is expected this year, reflecting persistent inflationary pressures and potential tax increases in the Budget in late November. The company bought back 1.6m of its 8.9%-yielding shares currently on a 16% discount. It made four new loans and received £50m from the full repayment of a senior loan to water infrastructure provider Workdry.
Investment Company (INV), the £6m UK smaller companies investment trust, says it is “actively working” with fund manager Chelverton Asset Management to grow the company as quickly as possible so that CAM no longer has to effectively subsidise the company by working within a 2% annual expenses cap. Net asset value fell by 0.85% to 79.62p per share in the year to 30 June with the share price declining 10.06% to 63.5p.
Global Smaller Companies Trust (GSCT) has agreed a £35m one-year unsecured multicurrency revolving loan facility with Royal Bank of Scotland International replacing a previous facility of the same size.

© 2026 Passive Income Live
Theme by Anders Noren — Up ↑