My Top Dividend Bargains For April 2026
Rida Morwa Investing Group Leader
Summary
- Plant widely this spring; more income “seeds” mean a richer harvest.
- Don’t put all your eggs in one basket. Diversify for a steady income stream from your holdings.
- Our top picks to grow your income this spring; yields over 7%.
- Looking for more investing ideas like this one? Get them exclusively at High Dividend Opportunities.

Co-authored with Hidden Opportunities
Spring is here! This is the season when we spend more time in the beautiful outdoors. Gardening enthusiasts will head back to their backyards, ready to create wonders from the soil. The more seeds you sow, the merrier the garden becomes, and the more meaningful the harvest will be for you and your family. A single plant may produce enough to perhaps feed you once, but many plants together can fill the fridge with produce and feed your family throughout the season.
There is also reality. There could be infestations, imbalances in soil nutrient profile, the soil’s water retention capability, or unfavorable weather conditions, which could lead to losses in your garden and diminish overall returns. But even with these setbacks, a well-diversified garden with appropriate care can produce an abundant, dependable harvest.
Our Income Method follows the exact same logic.
At High Dividend Opportunities, we plant widely. We accumulate a large, diverse collection of income-producing holdings so that even if a few underperform or experience infestations through price volatility, economic shifts, or sector-specific headwinds, our portfolio continues to deliver a strong, steady harvest throughout the year.
As April begins, two holdings stand out as reliable income producers in our income garden, resilient, productive, and built to nourish your portfolio through all seasons.
Let’s dive in.
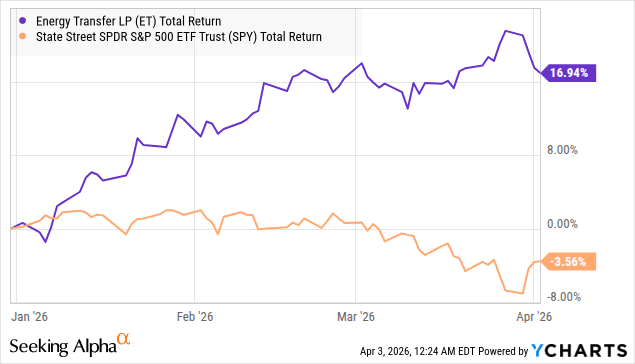
Pick #1: ET – Yield 7.1%
Not everything has been selling off amidst escalating tensions in the Middle East. To our subscribers, we outlined days before the beginning of the military operations against Iran that this involves a region quite critical for the global energy movement.
“The tension between the U.S. and Iran will influence oil prices more profoundly, as the Strait of Hormuz is the most critical oil chokepoint in the world, with 20 million barrels of oil per day passing through it.” – HDO Article, February 26th
The U.S. shale revolution gained momentum after 2005, significantly transforming the American energy landscape from a mindset of scarcity (as seen in the 1973 oil crisis) to one of abundance. The United States is currently the largest producer (and one of the largest exporters) of crude oil and natural gas.
Without a reliable supply of energy and the infrastructure to move it from extraction to processing, storage, and end users, a nation cannot achieve energy independence. This problem is clearly seen from the LPG (Liquefied Petroleum Gas) shortage in India and the closure of a substantial number of gas stations in Laos and Cambodia. Energy security is national security, and robust infrastructure is essential to supporting the industry and protecting the economy against geopolitical shocks.
Energy Transfer LP (ET) is a highly diversified midstream company with well-balanced business segments. ET is one of the largest midstream operators in North America.
Note: ET is a Master Limited Partnership that issues a Schedule K-1 to shareholders.
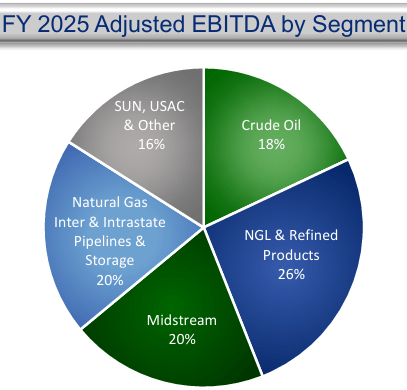
ET’s 2025 Adj. EBITDA represents a well-balanced business model, equally distributed between the following core segments.
- Crude Oil (18%) – Transports, stores, and markets crude oil through its pipelines and terminals.
- NGL & Refined Products (26%) – Transports, stores, and fractionates NGL (Natural Gas Liquids) and refined fuels.
- Midstream (20%) – Gathers, processes, and treats natural gas.
- Natural Gas Interstate & Intrastate Pipelines & Storage (20%) – Transports and stores natural gas across assets located nationwide.
- SUN, USAC & Other (16%) – Includes 100% ownership of Sunoco LP (SUN) fuel distribution and 39% ownership of USA Compression Partners (USAC) natural gas compression services.
ET holds higher debt levels compared to other midstream companies, expecting 2026 leverage between 4.0 and 4.5x Adj. EBITDA. This is due to significant CapEx (~$5.0-$5.5 billion earmarked for 2026), the majority around natural gas and NGL projects. ET has greater involvement in last-mile delivery to data centers, and the company has over 6 billion cubic feet/day of contracted pipeline capacity with a weighted-average life of 18 years, expected to generate over $25 billion in revenues from transportation fees. ET supplies natural gas to over 185 power plants across the country and has signed agreements with Oracle to provide natural gas to three data centers.
ET expects 2026 Adj. EBITDA between $17.45 and $17.85 billion, and targets a 3-5% annual distribution growth rate over the long term. About 90% of ET’s Adj. EBITDA is linked to fee-based contracts, implying that the company is not a direct beneficiary of higher commodity prices but is well-positioned to bring its newer assets to full capacity due to higher overall demand for midstream services.
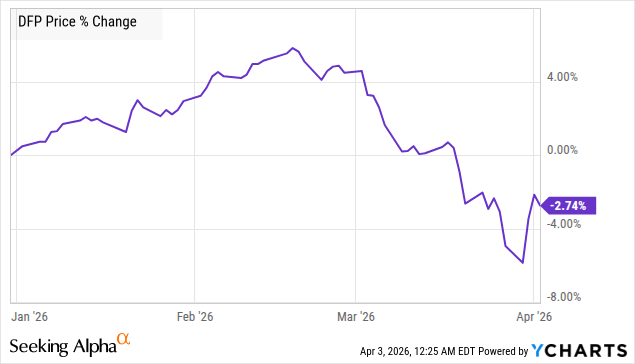
Pick #2: DFP – Yield 7.5%
Flaherty & Crumrine Dynamic Preferred and Income Fund (DFP) experienced a dramatic few weeks since the beginning of the armed conflict between the U.S. and Iran.
DFP holds publicly traded preferreds, mostly issued by banking, insurance, utility, and energy companies, with 70% of them based in the U.S., 10% in Canada, and the rest in the E.U. and the U.K. Source
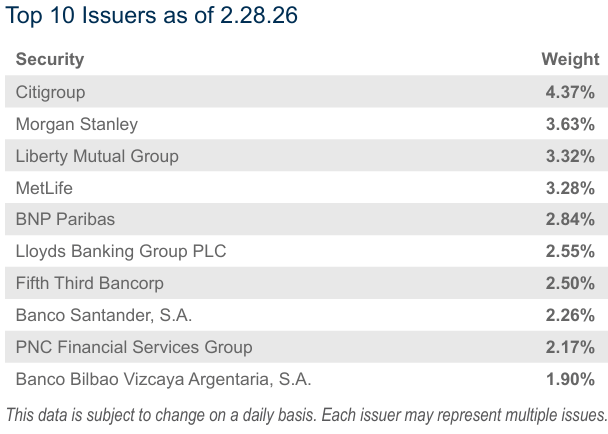
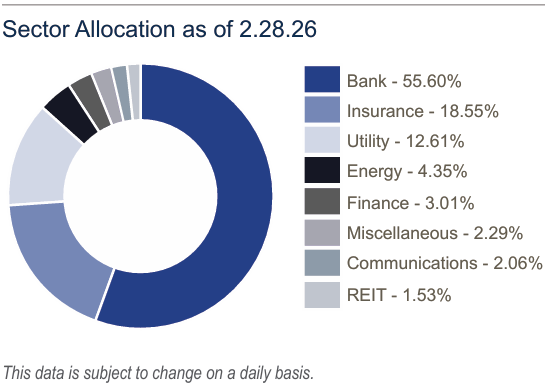
What do they have to do with oil prices and the Middle East? Not much, but preferreds are sensitive to interest rates, and the market’s fear of the worst (rate hikes to combat higher inflation) is catching up on this relatively steady asset class. Notably, over 53% of DFP’s portfolio holdings are investment grade.
DFP operates with a 37% leverage at a borrowing cost of SOFR + 0.90%, and the CEF ended FY 2025 (November 30, 2025) with a weighted-average interest rate of 5.2%. This positions the fund for lower borrowing costs with every rate cut.
But what happens when rates rise?
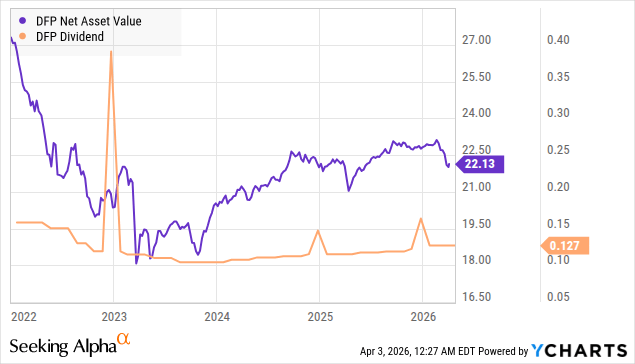
Borrowing costs rise, straining the 89% of DFP’s portfolio that is fixed-to-float securities, meaning that a substantial portion of this fund’s holdings will experience a reset in their coupon at staggered intervals. Looking at DFP since the rate hikes began in 2022, its NAV and distributions experienced a decline, followed by a steady rise as we continued to navigate through a declining rate cycle.
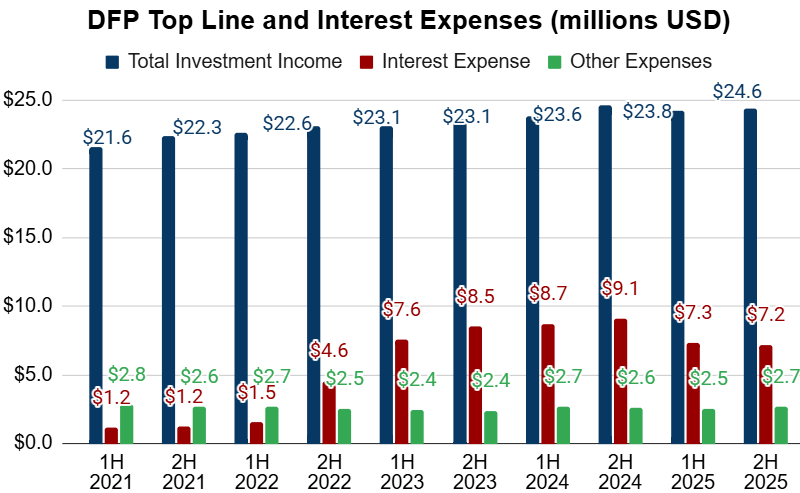
The higher allocation to rate-reset-type securities has resulted in a growing top line for the CEF as rate hikes intensified. Despite this, higher borrowing costs weighed down on funds available for distribution.
In recent years, DFP’s distributions have mostly been Qualified Dividends, making it highly efficient from a taxation standpoint. Wall Street’s fear about rate hikes to combat inflation will yet again be an opportunity for investors to buy fixed income on the cheap. To make things appealing, DFP trades at an 8% discount to NAV, letting you buy into the fixed-income space at a bargain.
Conclusion
A successful harvest isn’t built from a single plant; it’s built on many. At High Dividend Opportunities, we apply the same principle to our portfolio. We invest across several sectors and asset classes, including fixed-income positions. Our comprehensive bond ladder ensures that every year, a steady stream of capital matures and returns fresh cash to reinvest into the best opportunities the market offers, whether it’s a bull run or a downturn.
Our Rule of 42 enables our portfolio to benefit from an abundant, reliable flow of dividend and interest income. This is how we stay hungry and keep growing, even if market sentiment is weak. This is the power of income investing.

Leave a Reply