NextEnergy Solar Fund, a leading specialist investor in solar energy and energy storage, is pleased to announce the Board has approved a maintained dividend target of 8.43p per Ordinary Share for the financial year ending 31 March 2026.
The Board believes that this maintained dividend target appropriately balances the interests of the Company’s shareholders and other stakeholders with the Company’s available uses of capital. The Company’s dividend target offers an attractive c.12% dividend yield which is fully covered, representing one of the largest dividend yields in the FTSE 350 based on the Company’s closing share price on 14 May 2025.
The dividend target is forecast to be covered in a range of 1.1x – 1.3x by earnings post-debt amortisation, supported by a high degree of visibility of the Company’s revenues. As of 15 May 2025, the Company’s forecasted total revenues for the year ending 31 March 2026 are 94% fixed through its RPI-linked government-backed subsidies and the Company’s active power hedging strategy.
Irradiance across the period has been lower than we have seen in recent years, however, pleasingly the months that follow this quarter have benefited from excellent weather and we look forward to this being reflected in portfolio numbers in future updates.
Having done your own research, you can only own trust the management until they are proved wrong, it could be market forces outside their control or they may have been too optimistic with their fcast
You may want to buy the yield but are still nervous because the yield is above the market average, so you could pair trade with a lower yielding Gilt or U$ Treasury, both are risk free if held until maturity.
If you had 10k to invest.
5k in NESF would provide yield of around 12%
5k in a government gilt, held withing a tax free wrapper.
A blended yield of 16%, so a yield 8% a year to re-invest back into your Snowball.
Helen Mahy, Chairwoman of NextEnergy Solar Fund Limited, commented:
“Geopolitics and macroeconomic events continued to create uncertainty over the quarter. In addition, we have seen a reduction to short-term power prices which contributed to a slight reduction to the Company’s NAV over the Q4 period. Despite this volatility, NextEnergy Solar Fund continues to show resilience as a company, and solar as a reliable and tested asset class. The Board and the Company’s Investment Adviser meet regularly to discuss strategy and efficient discount control mechanisms to narrow the Company’s share price discount to NAV. Maximising shareholder value and return remains a key priority and we are pleased that good progress has been made with the share buyback programme with the purchase of £3.4m worth of ordinary shares in the period. Today, NextEnergy Solar Fund has also declared its fourth interim dividend bringing the total declared dividends for the financial year ended 31 March 2025 to 8.43p per Ordinary Share, in line with our guidance whilst being 1.1x cash covered, post amortisation of debt.”
Fourth Interim Dividend Declaration
NextEnergy Solar Fund, a leading specialist investor in solar energy and energy storage, is pleased to announce its fourth interim dividend of 2.11p per Ordinary Share for the quarter ended 31 March 2025.
The fourth interim dividend of 2.11p per Ordinary Share will be paid on 30 June 2025 to Ordinary Shareholders on the register as at the close of business on 23 May 2025. The ex-dividend date is 22 May 2025.
This dividend announcement brings the total declared dividends for the financial year ended 31 March 2025 to 8.43p per Ordinary Share and represents the Company’s eleventh successive year of successfully meeting its dividend guidance.
Ross Grier, Chief Investment Officer of NextEnergy Capital said:
“Despite the current share price discount and a slight softening in NAV,NextEnergy Solar Fund’sportfolio of operational assets continues to perform in line with budget, providing a reliable and visible stream of cash flows from the sale of generated electricity. Irradiance across the period has been lower than we have seen in recent years, however, pleasingly the months that follow this quarter have benefited from excellent weather and we look forward to this being reflected in portfolio numbers in future updates. To date,NextEnergy Solar Fundhas deployed approximately 11% of the UK’s total ground-mount solar operating capacity making it a key vehicle in helping to increase UK energy security whilst contributing heavily towards net zero goals.”
Regional REIT Limited (LSE: RGL), the regional property specialist, announces the following trading update for the period from 1 January 2025 to 31 March 2025 and a dividend declaration for the first quarter of 2025.
Stephen Inglis, Head of ESR Europe LSPIM Ltd., Asset Manager commented:
“I am pleased to report that Regional REIT has been able to maintain positive leasing momentum in the first quarter of the year and rent collections remained strong.
“There is an emerging supply and demand imbalance outside of London for high quality, sustainable office space that meets the needs of today’s occupiers. Regional REIT is committed to addressing this gap. This commitment gives us confidence that whilst market conditions continue to be challenging, with both occupational and investment markets remaining subdued, these challenges will subside allowing us to deliver future rental and capital growth for our shareholders.
“Furthermore, with our transformed balance sheet, Regional REIT is well placed to take advantage of the significant opportunities ahead for value creation within the portfolio. The business is implementing these initiatives and will continue to pursue our strategic disposals programme. While the fruits of our efforts may not translate into our financial statements before 2026, the business is doing all the right things today operationally to deliver value to shareholders. In the meantime, we continue to reward our investors with an attractive covered dividend.”
Valuations across portfolio
· 125 properties, 1,244 units and 744 tenants, totalling c.£622.8m* of gross property assets value (2024: £622.5m)
Continued operational delivery
· Rent roll of £57.3m (2024: £60.7m); ERV £83.0m (2024: £83.2m)
· EPRA Occupancy (by ERV) 78.8% (2024: 77.5%) ; 31 March 2025 like-for-like (versus 31 March 2024) EPRA occupancy was 78.8% (77.6%)
o EPRA Occupancy by portfolio segmentation: Core 88.5%, CAPEX to Core 80.8%, Value Add 63.3%, and Sales at 29.9%
· Total rent collection for the quarter as at 1 May 2025 97.3% compared with 97.2% for the equivalent period in 2024
· 14 lettings to new tenants and renewals/regears in the period across 114,888 sq ft delivering £1.6m of annualised rental income
· Post quarter end a further 7 new lettings and renewals/regears have been achieved across 21,673 sq ft providing £0.4m of annualised rental income
Maintaining balance sheet discipline while pursuing updated strategy
· Progressing value accretive capex programme
· Cash and cash equivalent balances £54.0m (2024: £56.7m)
· Net loan-to-value ratio c. 42.0%* (2024: 41.8%)
· Gross borrowings £315.3m (2024: £316.7m)
· Group cost of debt (incl. hedging) 3.4% pa (2024: 3.4% pa) -100% fixed and hedged ensuring the maximum cost of debt in 2025 will not exceed 3.4%
· Disposals in the period amounted to £1.6m (before costs), 4.9% above pre-sale valuation and reflecting a net initial yield of 7.3%
· 2 disposals completed post quarter end totalling £6.2m (before costs), 2% below pre-sale valuation.
The current disposal programme comprises of 40 sales totalling c. £106.2m
· 1 disposal contracted for c. £2.5 million
· 3 disposals totalling c. £8.6 million under offer and in legal due diligence
· 5 further disposals totalling c. £8.9 million are in negotiation
· 19 further disposals totalling c. £41.7 million are on the market
· 12 potential disposals totalling c. £44.5 million are being prepared for the market.
*Gross property assets value based upon Colliers valuations as at 31 December 2024, adjusted for subsequent acquisitions, disposals and capital expenditure in the period.
Capital expenditure programme update and highlights:
As previously announced the Company has identified c. 20 sites where there are clear value add opportunities. These may include planning applications being submitted to change the use to alternatives such as student accommodation, residential or hotel use ahead of a sale, to maximise value for shareholders. It is anticipated that this programme will deliver good shareholder value over the medium term.
In addition, currently the total capital expenditure investment amounts to £23.9m:
· 11 capital projects underway for £8.5m
· 9 projects scheduled to commence on-site works by the end of H1 ’25 for £6.4m
· 10 projects that have been identified for £9.0m
Q1 2025 Dividend Declaration
The Company declares that it will pay a dividend of 2.50 pence per share (“pps”) for the period 1 January 2025 to 31 March 2025, (1 January 2024 to 31 March 2024: 1.20pps**). The entire dividend will be paid as a REIT property income distribution (“PID”).
Owning just a handful of stocks to achieve a second income is dangerous at the best of times. Right now, the risks are even greater, with trade tariffs cooling the global economy and putting corporate profits under strain.
Diversification across dozens or more companies means the negative impact from one or two dividend shocks won’t derail an investor’s entire income strategy.
Yet spreading capital across a broad mix of stocks doesn’t have to mean investors settle for poor returns. Indeed, a £20,000 lump sum invested equally in the following assets would yield an £1,940 passive income this year alone, if broker forecasts are accurate.
Here’s why this FTSE 100 share, an exchange-traded fund (ETF), and this investment trust could be great buys to consider for a second income.
The ETF
Dividend yield: 11.2%
The Global X SuperDividend ETF (LSE:SDIP) offers exceptional diversification in its own right. It holds shares in “100 of the highest dividend paying equities” spread across industries in both developed and emerging markets.
This GlobalX fund does lean more closely to US equities, with 29% of the fund tied up in Stateside stocks. This could leave it more vulnerable to regional issues than funds with greater global diversification.
But overall, I think it’s a highly attractive way to spread risk. I also like its long record of making monthly distributions, giving investors access to their dividend income sooner.
The investment trust
Dividend yield: 8.8%
Alternative Income REIT‘s (LSE:AIRE) designed to prioritise delivering reliable dividends to investors. Under real estate investment trust (REIT) rules, it must pay at least 90% of annual rental profits out this way.
Group profits here might be affected by adverse interest rate movements that depress asset values. However, I think this risk is baked into its low valuation (it trades at a 15% discount to its net asset value per share).
Please note that tax treatment depends on the individual circumstances of each client and may be subject to change in future. The content in this article is provided for information purposes only. It is not intended to be, neither does it constitute, any form of tax advice.
The FTSE 100 share
Dividend yield: 9%
Nearing double-digit percentages, the yield on Phoenix Group (LSE:PHNX) is the second highest on the FTSE index today.
Yet unlike many high-yield shares, this UK blue-chip offers large dividends that have proven sustainable over time. Indeed, its dividend yield has averaged 8.6% over the last five years.
As with any income share however, future dividends are never guaranteed, and especially large ones. Payouts here could disappoint if economic conditions weaken, for instance, damaging demand for its financial services.
Still, a strong shareholder capital coverage ratio of 172% provides this year’s dividend forecasts with substantial strength. Phoenix is a highly cash generative business, and I expect dividends to grow strongly over the long term as demographic factors drive retirement product demand.
Capital protection trusts: The perfect vehicle for nervous investors
12 May 2025
Annabel Brodie-Smith looks at the historic performance of these low-risk trusts. Are they really as good as they sound?
By Annabel Brodie-Smith
The Association of Investment Companies
Stock markets around the world have been thrown into chaos during the first few months of this year as investors reacted to Donald Trump’s volatile policymaking and, most recently, the tariffs he announced on ‘Liberation Day’ on 2 April.
As a result, many investors are likely to have experienced some gut churning volatility and a significant hit to their portfolios since the new president took office.
Indeed, it’s precisely this type of market mayhem that has dyed-in-the-wool cash savers wagging their fingers and chiding “that’s why I don’t invest in the stock market!”
However, there are a number of investment trusts that are designed specifically for nervous investors and volatile times like these; they aim to preserve the value of investors’ capital during market downturns while providing cash-beating returns when stock markets are rising.
In the wake of the recent market volatility, I decided to take a closer look to see if their claims stood up to scrutiny.
One of the most prominent funds is Capital Gearing Trust. Founded in 1973, it has been a steward of investors’ capital through booms and busts, market crashes, global economic crises and a pandemic. Despite these hurdles, since Peter Spiller started managing it in 1982, the trust has only lost money in two years, with the worst annual loss being 4% in 2022.
Even so, if you had invested £10,000 at launch you would now have £2.2m sitting in your portfolio today, and with very little stress along the way.
For some more recent context, let’s look at the period of tariff-induced volatility caused by Trump’s tariff announcements. In the four weeks between 2 April and 29 April, the average investment trust rose by 1.8%, although that figure masks a wide disparity; the average North America trust is down by 6.8% and the average China trust down by 9.8% in those four weeks alone, while the average trust in the Global sector was down by 3.4%. Yet Capital Gearing Trust was exactly unchanged.
Analysing performance over more meaningful periods shows that wealth preservation trusts have successfully protected investors’ savings through market wobbles, busts, corrections and crashes. All while passing on at least some of the upside when stock markets are doing well. Indeed, even during times of extreme market stress such as the financial crisis or the Covid pandemic, some of these trusts actually made money.
So how do they do it?
The truth is that there is more than one way to build a resilient, gravity defying portfolio, and each of these trusts takes a different approach. The one thing in common is a diversified pool of assets, at least one segment of which is designed to rise in value when equities are having a tough time. That might be gold, bonds, derivatives or a combination of the three. Either way, they interact with the rest of the portfolio in a way that protects the bulk of investors’ capital.
Spiller explains his method of dividing Capital Gearing into three pots: “We put approximately one third in risk assets such as equities, another third in index-linked bonds and another third in cash or cash equivalents such as high-quality government bonds, which pay a better return than cash on deposit.
“The result has been remarkably consistent. We sailed through the dotcom crash in 2000 and made money when the markets crashed during the global financial crisis and again during the Covid downturn,” he said.
The trust is not bulletproof, however. “A really big fall in US equities could still hurt us and there are no guarantees we won’t lose money,” Spiller acknowledged. “But our long-term record of safely growing our investors’ savings speaks for itself.”
Ruffer Investment Company also focuses on capital preservation and has performed well in turbulent markets, said manager Jasmine Yeo. “The strategy retains a defensive bias with powerful protections but we’ve also got high conviction growth ideas and lots of liquidity to take advantage of the opportunities which volatility bring. We’re trying not just to preserve and grow capital in real market stress, but to use profits from our protections and other liquidity to buy assets to drive the next cycle of returns,“ she explained.
“Our approach has been successful in helping us to protect our clients through the dotcom bust, the credit crisis and Covid-19. The portfolio was defensively positioned going into ‘Liberation Day’ holding potent derivative protections that contributed meaningfully to performance as volatility spiked, offsetting the falls in the portfolio’s equities, while our yen and precious metals exposure allowed us to make positive headway.”
Personal Assets Trust takes a different approach, according to its manager, Sebastian Lyon – focusing on high-quality equities but avoiding the derivatives used by Ruffer. “All the wealth preservation trusts do things in different ways, so I see us as complementary rather than in competition,” he said.
“We dismiss a huge pool of equities because they are too cyclical, too high risk. If you look back through history and see the companies that tend to fall a lot in a recession, there is a theme: time and again it tends to be highly geared companies like retail banks, whether during the Asian currency crisis in 1997 or after ‘Liberation Day’; HSBC, Standard Chartered, Barclays – all went down by around 10% in April.
“That’s why we don’t own these stocks. Nor do we own companies reliant on receiving new capital such as housebuilders or airlines because when things go wrong, profits can collapse really sharply, like they did during Covid, and they are forced to ask for more money at the bottom of the market,” he explained.
“What do we own? Consumer staples. Unilever is our largest holding. It’s boring and predictable and we have held it for 20 years. We like to stick to the middle ground where companies have a tailwind. We have owned Microsoft for many years and we like Visa and Amex because there is a clear tailwind in the trend away from cash.”
Personal Assets also has 11% in gold and gold-related investments. “We love gold because it has risen during every crisis, providing a fantastic safe haven as we’ve seen recently as it has hit successive record highs,” Lyon said.
So take your pick. As you can see from the graphics, all of these trusts have done remarkably well over the long term, smoothing out returns at times of extraordinary volatility, and giving investors a more profitable, arguably less stressful alternative to cash. So for those who want to sleep at night whilst preserving the value of their nest egg, these trusts are most certainly worth considering.
Annabel Brodie-Smith is communications director at the Association of Investment Companies. The views expressed above should not be taken as investment advice.
The current blended minimum yield for the snowball is 7%.
If you wanted to buy a higher yielding Trust, you can remove some of the risk by Pair Trading with a less risky Trust.
Or, if you wanted to buy a less risky Trust, you could Pair Trade it with a higher yielding Trust.
Evidence suggests DIY pension investors are looking to strike a balance between stability and a few select growth opportunities. We look at the most popular SIPP investments right now.
(Image credit: Luke Chan via Getty Images)
By Laura Miller
Cash. Cash. Cash. The funds that made up the top three among Fidelity SIPP investors in April were all cash funds. The kind of funds investors pile into when they are worried about which way the wind is blowing.
And with April seeing sky high tariffs and trade wars emanating from the United States rocking stock markets around the world, the fear of a hurricane brewing has been intense.
Ed Monk, associate director at Fidelity International, says: “SIPP investors continue to prioritise stability with funds like the Royal London Short Term Money Market Fund and Legal & General Cash Trust holding prominent positions.
Stay ahead of the curve with MoneyWeek magazine and enjoy the latest financial news and expert analysis, plus 60% off after your trial.
“These cash and money market funds are sought after in times of uncertainty due to their ability to preserve capital and offer liquidity.”
This aligns with recent research from Fidelity which shows a marked shift towards caution, with 41% of investors now describing their outlook on the market as ‘pessimistic’, up from 24% in February.
At the same time, heading up the investment trust chart during the period was GCP Infrastructure Investments and International Public Partnerships, taking first and second place respectively – both infrastructure investments, as even SIPP investors not choosing cash funds retreated to cash-like safety.
“The popularity of cash funds and infrastructure trusts shows a clear preference for defensive strategies in uncertain markets,” says Monk.
Likewise that old favourite in troubled times, gold. Gold’s performance in 2025 underscores its value as a safe haven, with the Ninety-One Global Gold Fund climbing into the top holdings among SIPP investors in April.
Fidelity’s research also supports this, revealing 28% of investors now see gold as a key opportunity. “The growing interest in gold reflects the broader trend of investors looking for assets that can provide both safety and long-term value,” Monk says.
Yet SIPP investors are striking a balance between stability and selective growth opportunities. While not as popular as cash and infrastructure, global equity and index funds held their own in the top 10, showing investors’ ongoing appetite for diversification.
“We’re seeing selective interest in growth sectors, with funds like the Fidelity Index World Fund and Allianz Technology Trust attracting attention, showing that there’s still room for optimism in certain areas of the market,” says Monk.
Finally, the return of Scottish Mortgage Investment Trust to the top ranks suggests that some investors are cautiously dipping back into the growth space.
But, says Monk, that is occurring with a keen eye on balancing these exposures with more defensive holdings elsewhere.
Most popular SIPP investments
Fund
Shares
Investment trusts
Royal London Short Term Money Market Fund
BP
GCP INFRASTRUCTURE INVESTMENTS LTD
Legal & General Cash Trust
HSBC HOLDINGS PLC
INTERNATIONAL PUBLIC PARTNERSHIP
Fidelity Cash Fund
LEGAL & GENERAL GP
ALLIANZ TECHNOLOGY TRUST PLC
Fidelity Multi Asset Alloc Growth W-Acc
GLENCORE PLC
JPMORGAN GLOBAL GROWTH & INCOME PLC
Fidelity Index World Fund
DIAGEO PLC
SDCL ENERGY EFFICIENCY INC TST PLC
BNY Mellon Multi-Asset Balanced Fund
M&G PLC
F&C INVESTMENT TRUST PLC
Fid FIF Global Dividend Fund
ASHMORE GROUP
CQS NEW CITY HIGH YIELD FUND LTD
Legal & General Global Equity Index Fund
ABERDEEN GROUP PLC
SCOTTISH MORTGAGE INV TRUST
Ninety One Global Gold Fund
GREATLAND GOLD
POLAR CAPITAL TECHNOLOGY TRUST PLC
Fidelity Global Aggregate Bond Feeder Fund
BURBERRY GROUP
LAW DEBENTURE CORP
Source: Fidelity International Personal Investing Platform Net SIPP sales 01.04.25-29.04.25
Inflation? Slowdown? This 10% Dividend Wins Either Way
Brett Owens, Chief Investment Strategist Updated: May 13, 2025
Are we careening towards a recession, or is a pickup in inflation the big threat to the stock market?
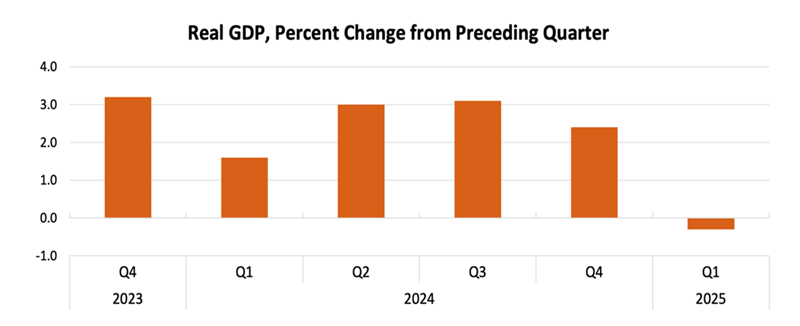
The negative first quarter GDP print has recession fears in the financial headlines. Meanwhile, Fed Chair Jay Powell remains fixated on inflation.
Ironically, both may come to pass. Which means we must prepare our portfolios for a slowdown that is quickly followed by a pickup in prices.
Let’s put one smart lender on our “Goldilocks” watch list. This ticker yields 10% today (with some nice “dividend insurance” we’ll talk about in a moment). But the key point is that it profits as inflation—and interest rates—tick higher.
Let’s talk about the “slowdown-inflation two-step” I see coming—and how it’s set to open the door on this 10% dividend opportunity.
Slowdown Now …
Let’s start with the slowdown, which, as we discussed last week, is already upon us. The evidence: A 0.3% decline in first-quarter GDP:
Source: Bureau of Economic Analysis
But the underlying numbers were actually more bullish than the headlines suggested.
That’s because the pullback was in large part due to a spike in imports as retailers stocked up ahead of Trump’s tariffs—and imports are calculated as a drag on GDP. That trend is likely to fade. Government spending also fell in light of DOGE cuts (though as we’ll discuss next, this will likely be fleeting), while consumer spending largely held up.
We’ll happily take a GDP dip caused by temporary factors! But a slowdown is still likely. There were hints of this in the April employment report, which, while better than expected, still showed a slight slowdown from March.
… Inflation Next
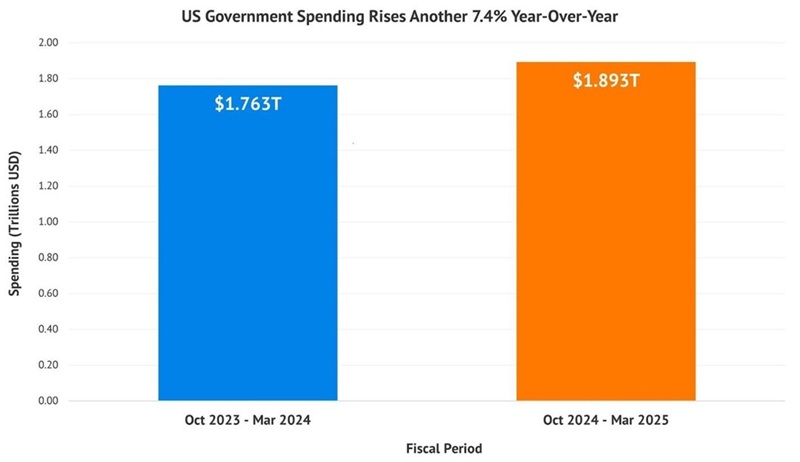
Meantime, despite DOGE’s efforts, government spending rose 7.4% year-over-year for the first six months of this fiscal year (which began October 1, 2024).
Tax receipts, by the way, are not up 7.4%. And remember that most of federal spending is untouchable: Messing with Social Security, Medicare or Medicaid is political suicide. Defense spending seems “secure” given the current state of the world.
That makes it far more likely that a future Fed Chair (remember that Jay Powell’s term is up in a year) will resort to money printing quantitative easing (and with it, sustained, or rising, inflation and rates in the longer term).
Enter Our 10%-Paying “Floating-Rate” Lender
Enter commercial mortgage real estate investment trusts (mREITs), which stand to see higher income from their floating-rate loans as inflation—and interest rates—hold at current levels or tick up.
When most people think of REITs, they think of those that own physical properties, like shopping malls, hotels and apartments. Instead, mREITs buy and originate mortgages on these properties. (But like their property-owning cousins, they get a hall pass on their corporate taxes so long as they pay out 90% of their income as dividends.)
mREITs’ lending operations make money by borrowing at low short-term rates, then lending that cash out in the form of mortgages based on long-term rates. They then pocket the difference.
This business model prints money when long rates (i.e., those on the 10-year Treasury) are steady or, better yet, declining, as we’ll likely see in the coming slowdown. That’s because, when long-term rates drop, mREITs’ existing loans become more valuable because new loans pay less. That’s the setup we’re likely to see in the coming months.
But what about when rates rise? That can hurt mREITs because their existing mortgage portfolios fall in value. But remember that they do see rising income from those floating-rate loans.
Moreover, the best mREITs are run by experienced managers and have their hands in businesses beyond commercial lending, helping them navigate any rate environment.
Starwood: Much More Than a Mortgage Lender
Which sets up the 10%-yielding stock we’re going to talk about today: Starwood Property Trust (STWD). It really is the poster child for mREITs. For starters, its loan book is 98% floating-rate. And as we’ll see below, it’s diversified into other businesses that help hedge it against inflation.
Starwood is managed by Barry Sternlicht’s Starwood Capital, which he founded with $20 million in 1991. Today, Starwood Capital manages over $120 billion in assets.
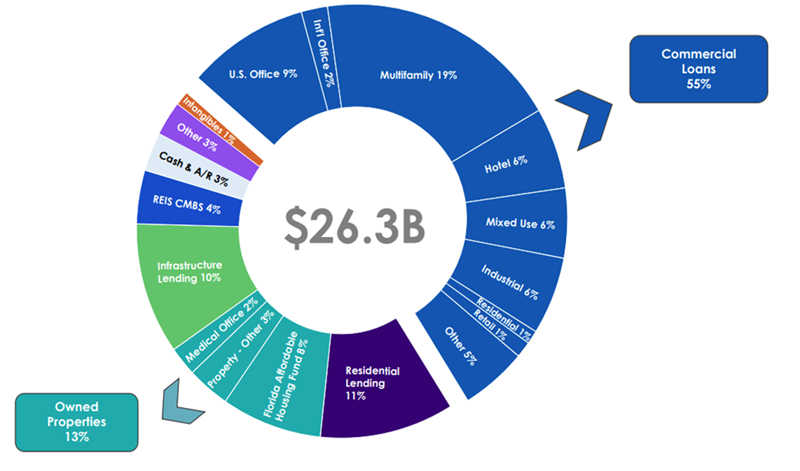
These folks know the credit and real estate markets, and they’ve built STWD to thrive in all rate setups: Beyond commercial lending, which is about 55% of assets, STWD holds residential loans (11%) and devotes about 13% of its assets to owned properties.
It also makes loans in the growing infrastructure space (a keen focus of the company) and originates, acquires and manages mortgage-backed securities. In addition, it runs LNR Partners LLC, which focuses on resolving distressed mortgages. Since its launch in 1993, LNR has resolved some $94.5 billion worth of such loans.
On the commercial loan side, the company’s loan book is as diverse as they come, with mortgages spread across office, housing, hotel, industrial, infrastructure, mixed-use properties, international properties and more.
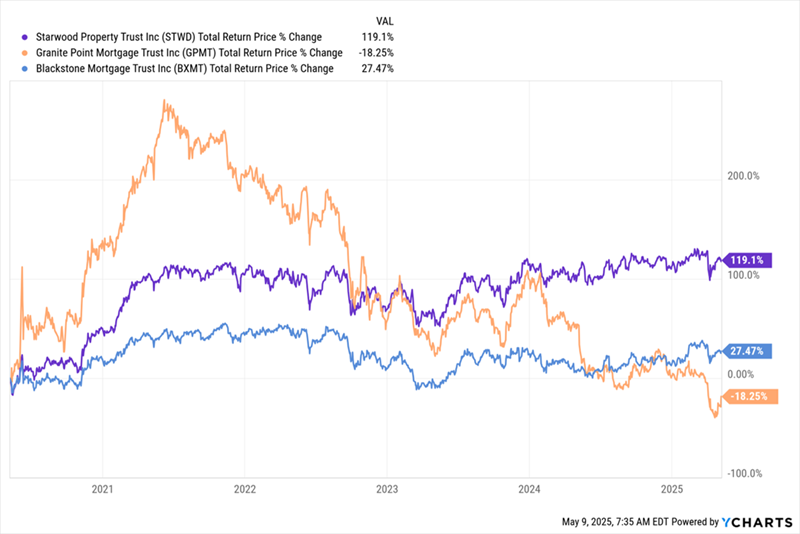
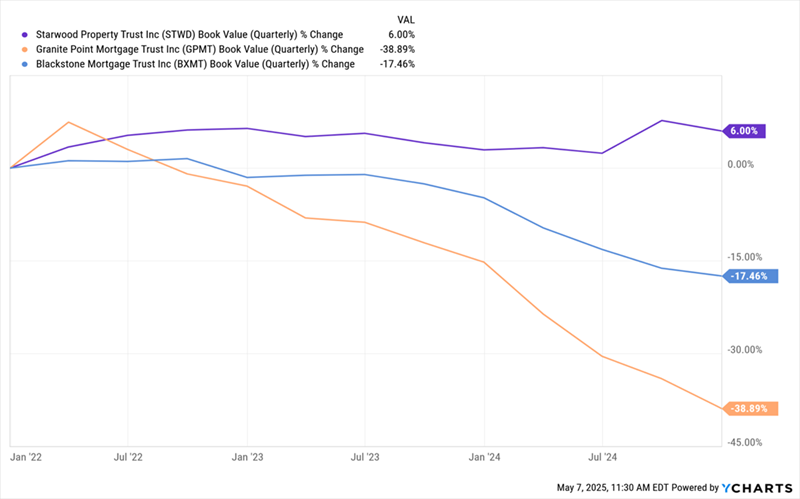
All of this has helped this “ironclad” mREIT blow past competitors Blackstone Realty Trust (BXMT) and Granite Point Mortgage Trust (GPMT) in the past five years—through COVID, plunging rates, rising rates and the trade war—and with far less drama, too:
Starwood Soldiers Through the Wild 2020s
That share-price gain is deserved. Just look at how STWD’s book value grew from the start of the rising-rate period, in January 2022, to the end of 2024—when 10-year Treasury rates shot up from 1.5% to 4.6%. At the same time, the book values of BXMT and GPMT plummeted:
Starwood Shakes Off Rising Rates, Grows Its Assets
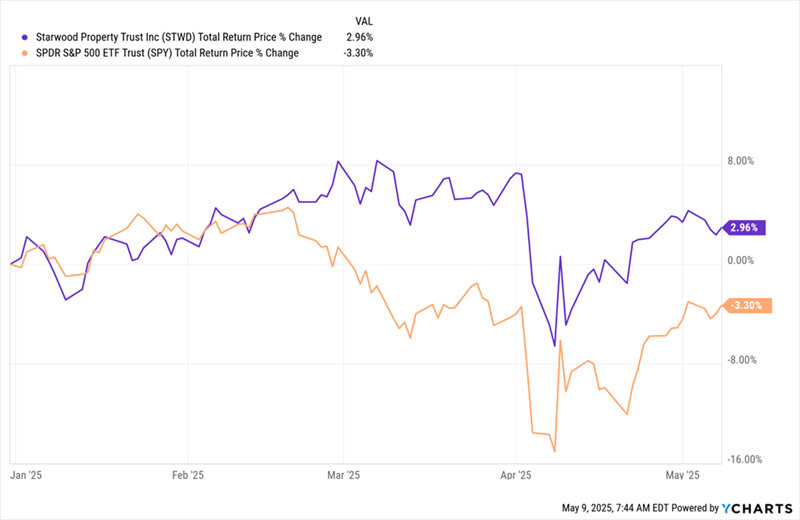
And this year? Despite concerns about inflation/recession, Starwood has posted a total return of roughly 3% and has only barely slipped into the red this year, while the S&P 500’s total return remains underwater, with volatility that’s gone through the roof:
“Tariff Tantrum” Fails to Dent Starwood
On the dividend front, Starwood raised the payout after its 2009 IPO and has held it steady, at $0.48 quarterly, for the past decade. And that payout looks safe: Management says it has $1.5 billion (or $4.53 a share) in unrealized distributable earnings from property gains to put toward the payout.
That’s nearly 2.5 years of payouts, based on the current annualized rate.
Slowdown Could Give Us a Better Deal on Starwood
So why are we putting Starwood on our watch list and not our buy list, now? It goes back to book value: Right now, Starwood trades “at book,” which isn’t bad—but I expect a slowdown to pull the stock below book by a bit. That’s what happened in March 2023, when the collapse of Silicon Valley Bank and friends sent recession fears soaring.
Back then, STWD traded at 82% of book. And with another slowdown likely, I expect another chance to buy for less than book value in the coming months (though likely not quite at that 18%-off deal we saw in 2023!).
Hello are using WordPress for your blog platform? I’m new to the blog world but I’m trying to get started and create my own. Do you need any html coding knowledge to make your own blog? Any help would be greatly appreciated!
Word Press and you don’t need any coding knowledge.