The Most Important Thing You Can Do for Your Kids (and Grandkids) in 2026
By Brett Eversole, Daily Wealth
Since the pandemic, we’ve seen two separate economies emerge. They’re moving in different directions. One is thriving… while the other is struggling.
We call this the “K-shaped economy.” And it was one of the biggest topics in finance and economics last year…
Folks in the higher-income portion of the economy are doing incredibly well. They’ve seen their wages rise. And more important, their assets have grown. These folks are much better off today than they were five years ago.
Lower-income Americans have experienced the opposite. Their wages haven’t grown as fast. They haven’t benefited from the stock market boom. And inflation crushed them during the post-pandemic era.
Most people believe the K-shaped economy is an income-disparity problem… They say that some people make a lot while others don’t make enough. That’s a compelling idea politically – but it doesn’t explain what’s happening.
In America, we’re seeing a K-shaped economy for a single reason…
One group of Americans owns assets… and the other group doesn’t.
Now, there’s a way to ensure your kids and grandkids belong to the asset-owning portion. And acting on it is the most important thing you can do for them this year…
A New Opportunity to Get Ahead
It’s not politics. It’s economics. This divide is all about owning assets and having them work for you – or not.
If you’re in the asset-owning category, chances are you’ve done darn well over the past five years. And that’s almost regardless of your personal income or employment situation. Asset growth has been so strong that it has dwarfed the pain of inflation.
It’s another story for those who don’t own assets. For them, it’s almost impossible to get ahead.
The simplest way to fix this problem isn’t through political jockeying. We just need to move more folks into the asset-owning category.
And now, thanks to one piece of legislation, there’s a new opportunity to jump-start asset ownership for members of your family.
It’s called the Invest America Act. It became law as part of the One Big Beautiful Bill Act last year – and it went into effect on January 1.
The Invest America Act allows you to open a tax-deferred investment account for anyone under the age of 18.
For the pilot portion of the program, the government will also fund accounts belonging to children born between January 1, 2025 and December 31, 2028 with $1,000.
These accounts are a type of individual retirement account (“IRA”). The difference is that traditional IRAs are mostly off-limits for minors, since you must have income to fund one.
By contrast, these accounts are open to all children. And just about anyone can fund them up to the $5,000 annual limit. They’re the perfect way to make your child or grandchild an asset owner right now… and help them join the upper portion of the K-shaped economy.
I’m sharing this because I believe setting up your children and grandchildren for long-term financial success is one of the most important gifts you can give them…
Investing is all about putting your money to work for you. The longer you’re able to do that, the better off you’ll be. You want compounding to work in your favor… And that means starting early.
How I’ll Set My Kids Up for Success
Everyone’s situation is different. But here’s what I plan to do for my two young daughters, aged 8 and 4…
I’m going to prioritize maxing out each of these accounts ($5,000 a year) for at least the next 10 years. Assuming an 8% annual return, they’ll each have about $72,000 saved a decade from now.
That might not sound like much… I’ll have contributed $50,000 to each account. The funds will have grown by less than 50%. But compounding will have only begun to work in our favor.
From there, my girls will have roughly 45 years until retirement. And that’s where the magic happens…
Over that time, those $72,000 accounts will compound to roughly $2.3 million.
For just $5,000 a year for a decade, I can effectively fund each of my children’s retirements. That’s incredible.
Again, each situation is different. But if you’re reading this, you’re likely an investor who wants to make your money work for you. And if you’ve got children in your life, you probably want to see them in the upper part of the “K.”
That means taking advantage of these new accounts is the most important thing you can do for your children and grandchildren in 2026.
While you can open one right now, funding doesn’t begin until later this year. In the meantime, figure out your contribution plan… Maybe you can’t max out multiple accounts each year, but even small contributions will grow dramatically over decades.
If you can only contribute $2,500 a year for the next decade, the account should grow to nearly $1.2 million. Even investing just $1,000 per year for the next 10 years would mean a final balance of nearly half a million dollars.
The point is, a small investment now will lead to life-changing returns in the future. Invest now so your children will be able to thrive in the future.
This simple step is how you ensure your kids or grandkids are in the upper part of the K. And I urge you to take advantage of it.
Again, each situation is different. But if you’re reading this, you’re likely an investor who wants to make your money work for you. And if you’ve got children in your life, you probably want to see them in the upper part of the “K.”
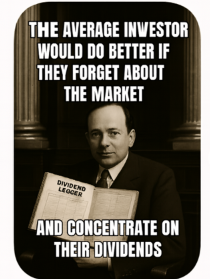
If you have a dividend re-investment plan, you should be able to live off the natural income and leave your capital, to whoever you wish.
Pure-play energy refiners receive little investor attention. When people think about energy stocks, they usually think of large, global, full-spectrum players like Exxon Mobil (XOM) and Chevron (CVX); however, income-focused investors are aware of midstream companies with attractive yields and growing dividends.
Refining companies, which turn crude oil into fuels, are referred to as downstream energy companies. Pure-play refiners operate in a highly interesting energy subsector. For a refiner, both its inputs (crude oil) and its products (fuels like gasoline and jet fuel) have prices set in the commodity markets. As a result, refiners need to be highly efficient to remain profitable when commodity prices are unfavorable.
There are just three large refining companies:
Marathon Petroleum Corp. (MPC), with a $53 billion market cap
Phillips 66 (PSX), with a market cap of $57 billion
Valero Energy Corp (VLO), with a $55 billion market value
Marathon Petroleum released fourth-quarter and full-year results, with some outstanding numbers. For reference, MPC currently trades for $190 per share.
For 2025, MPC reported net income of $4.0 billion, or $13.22 per share. This was up nicely from $10.08 per share for 2024. Cash from operations totaled $8.3 billion.
Marathon Petroleum’s management is focused on returning cash to investors. For 2025, $4.5 billion was paid out in dividends and share buybacks. From 2020 through 2025, the number of shares outstanding decreased by over 50%. Fewer shares automatically produce growing earnings per share.
Marathon Petroleum has consistently grown its common stock dividend by 10% annually. The company owns more than 60% of MPLX LP (MPLX), an energy midstream company. The growing distributions from MPLX to MPC are expected to fund MPC’s 2026 dividend and standalone capital.
For investors, MPC is a solid dividend growth stock. When profits are high, shares are repurchased, EPS continues to grow, and dividends are increased.
Three historically reliable signals are flashing at the same time – and that rarely ends well.
The bullish narrative may be masking deeper structural cracks beneath the surface.
Here’s how I’m positioning before the next potential market reset unfolds.
Looking for a portfolio of ideas like this one? Members of High Yield Investor get exclusive access to our subscriber-only portfolios. Learn More »
mesh cube/iStock via Getty Images
While the S&P 500 (SPY) and NASDAQ (QQQ) have been on tremendous bull runs since 2023, there are three historically reliable warning signs emerging simultaneously that indicate that the market could be due for a significant correction in the near future. While I am not a market timer and I’m not predicting a correction in the near term, I do think it is important that investors, especially more risk-averse ones, keep these risks in mind and monitor them closely as they build their portfolios today. In this article, I will detail these and share how I am positioning my portfolio in the current environment.
The S&P 500’s Most Dangerous Valuation Setup In Decades
The first warning sign is that valuations and equity exposure are at stretched levels. In fact, the S&P 500 has gotten so overvalued that Howard Marks recently pointed out that J.P. Morgan research reveals that whenever the S&P 500 has reached its current valuation level, the next decade has always yielded real annualized total returns of around 0%. Additionally, there are numerous other metrics that indicate the S&P 500 is significantly overvalued right now.
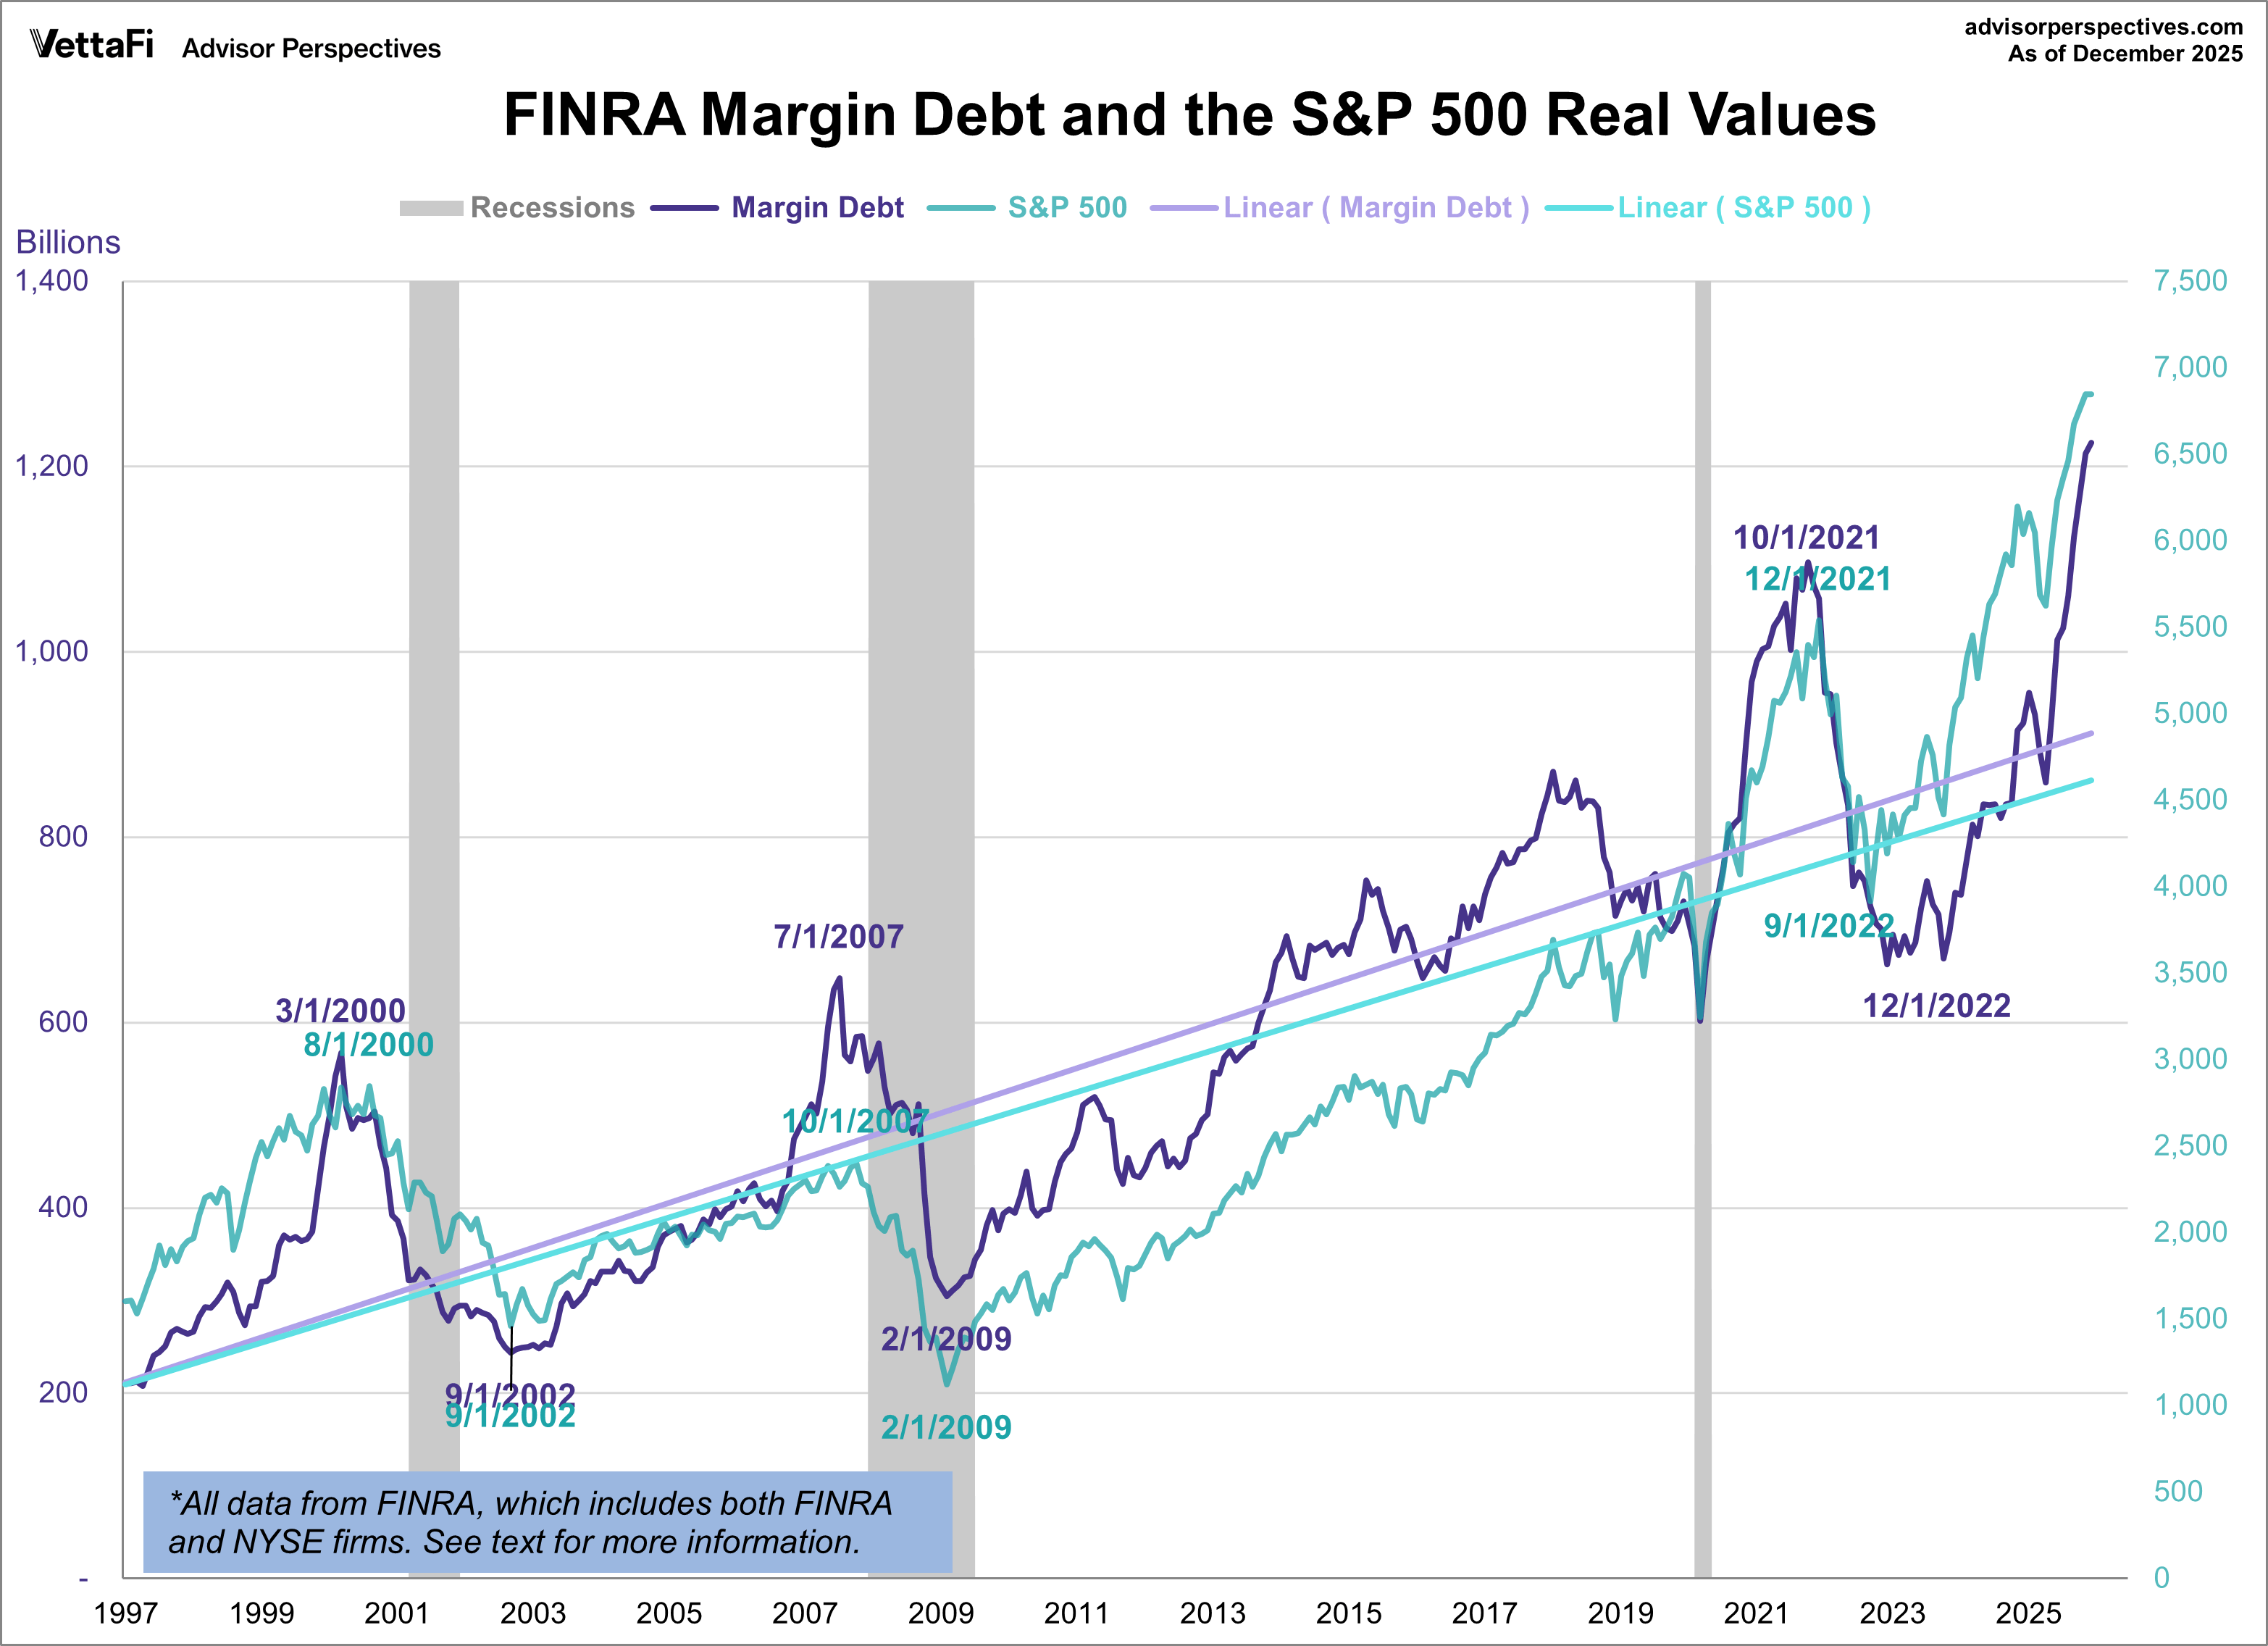
Margin Debt At Extreme Levels: A Classic Late-Cycle Warning
Not only that, but the positioning of market participants is also indicating a very bullish, if not complacent, market sentiment. For example, household allocation to equities has reached near-record levels, and this has typically indicated that the market is late in a bull-run cycle. This makes sense simply because, from a mechanical perspective, the more people in the market, the greater the number that could be pulling out, or at the very least withdrawing their positions relative to new entrants and new additions being made. Not only that, but margin debt is at elevated levels. This typically indicates that investors are feeling too optimistic about the market and, should sentiment turn, could lead to an outsized downturn as investors flee to safety by closing margin positions, leading to outsized selling.
advisorperspectives.com
Additionally, studies have shown that when margin debt reaches levels similar to where it is today, it can help. It is often an early indicator that a sharp market pullback is ahead, which again makes sense given that falling prices can result in margin calls, which lead to forced selling, which then leads to deeper drawdowns in the market than would otherwise be seen. Not only that, but buying stocks on margin tends to lead to elevated valuations relative to what would otherwise be seen, therefore requiring a further pullback in stocks simply to achieve a proper valuation.
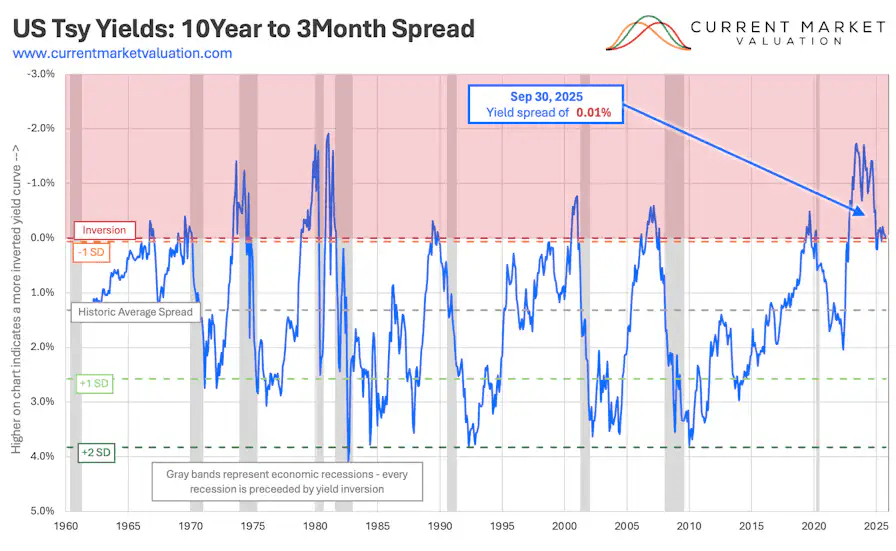
The One Yield Curve Signal Investors Ignore At Their Own Risk
The third warning sign is an inverted yield curve. This is an important indicator because, while an inverted yield curve does not mean that a recession is guaranteed to happen, historically, yield curve inversion has been a very reliable indicator of an upcoming economic recession, as the chart below illustrates.
currentmarketvaluation.com
Given that the yield curve recently inverted quite sharply, that means that we may well be in store for a recession. This is because yield curve inversion tends to signal that monetary policy is too tight and, therefore, credit creation slows. This, in turn, can lead to both a stock market correction and a contracting economic environment. It also signals a risk-off environment because it means that investors are fleeing to longer-term bonds (TLT), which are traditionally a safe haven, as a way of hedging against a sharp economic downturn.
While the yield curve has since uninverted, this too is typical before a recession hits, as the chart above illustrates, indicating that the recession could be imminent.
AI Boom Or False Comfort? Why The Bull Case May Be Misleading
Sure, there is a bullish case for the market today, namely that we are on the cusp of an AI productivity boom as well as a manufacturing renaissance in the United States, both of which, if successful, could lead to enormous gains in economic activity, and where manufacturing-related job increases could help to offset some of the lost jobs due to AI. Additionally, the one big beautiful bill act from last year implemented tax and regulation changes that are overwhelmingly pro-business in nature.
However, as these indicators show, there is a strong case to be made for a sharp stock market correction, whether it be due to a recession, as the recent inversion of the yield curve seems to point to, or simply due to the fact that markets are overvalued and overleveraged. At the very least, with valuations and leverage at the levels they are at, any sort of speed bump, the AI boom, and/or material disappointment in economic activity in the United States could send markets substantially lower.
On top of that, there are significant geopolitical risks that could trigger a drawdown, including a major war involving the United States and Iran, an escalation of the war in Europe, which at the moment is relatively confined to Russia and Ukraine, but could conceivably expand beyond that, and/or a conflict involving Taiwan in the Far East, especially if the U.S. were to be drawn into that conflict in a major way.
How I’m Structuring My Portfolio For What Could Be A Major Reset
Given this outlook, how am I positioning my portfolio?
First of all, I am avoiding the major indexes because of the significant drawdown risk. That being said, I’m not completely running for the hills and going all in on cash and cash equivalents (SGOV).
Instead, I’m remaining well diversified with a significant allocation to gold bullion (GLD) leases that provide the safe haven hedge that gold tends to provide in uncertain environments, while still generating attractive income for my portfolio. Additionally, I’m investing aggressively in durable and defensive real asset businesses that pay out attractive yields and trade at deeply undervalued valuations. These include several leading blue-chip midstream infrastructure companies (AMLP), as well as several mission-critical, deeply undervalued REITs (VNQ) with attractive dividends and strong balance sheets, as well as senior secured debt from high-quality underwriters and several other highly attractive infrastructure investments (UTG).
This approach has served me well, especially when combined with an opportunistic capital recycling strategy that has enabled me to achieve total return outperformance over the past five years since launching High Yield Investor, along with a 7% to 8% dividend yield and below-market beta.
Editor’s Note: This article covers one or more microcap stocks. Please be aware of the risks associated with these stocks.
The current bull run continues, until ‘Buy the Dips’ fail
If you think of your portfolio as money lending business and as long as the company continues to pay you interest, you are willing to lend it’s your hard earned.
If one of your customers fail to pay their interest payment, close the loan arrangement and move on.
Be watchful that the fire doesn’t melt your Snowball
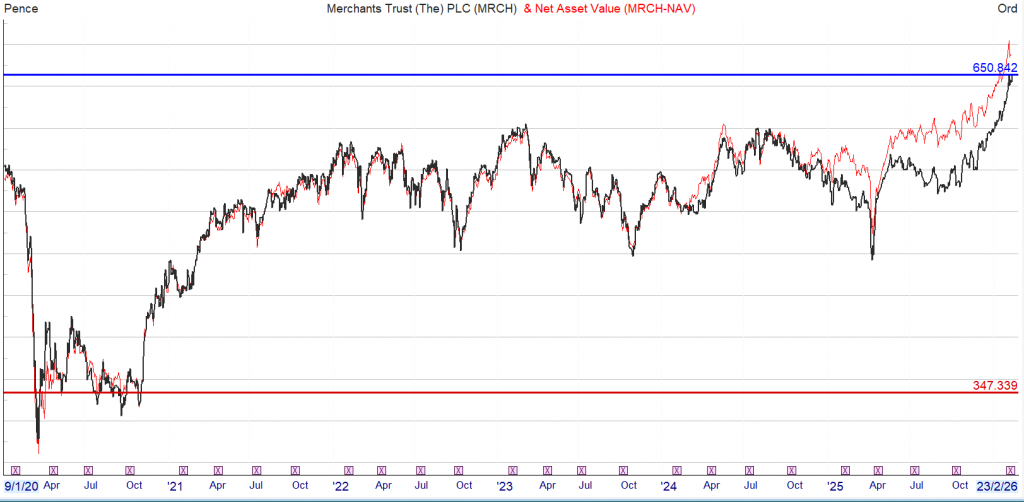
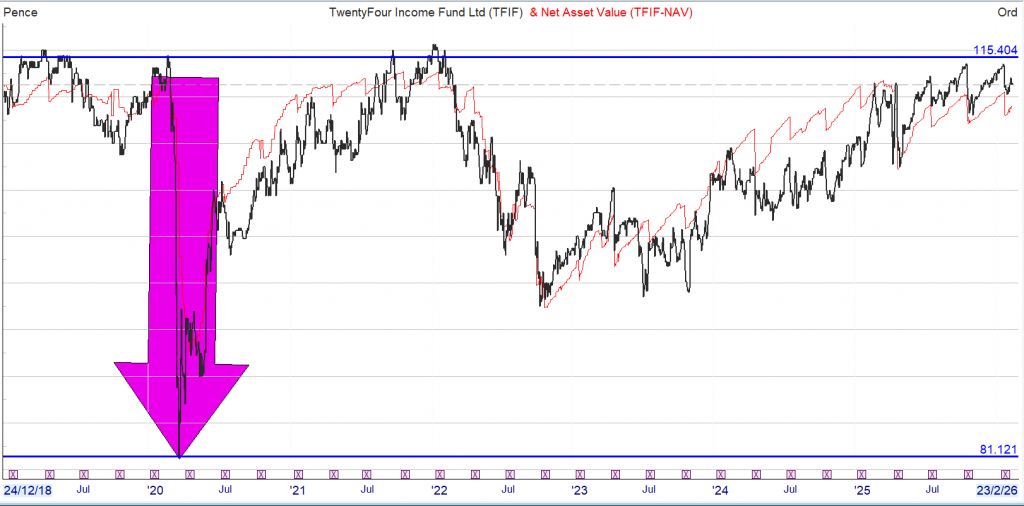
TwentyFour Income Fund Limited (“TFIF” or “the Company“), the FTSE 250-listed investment company whose investment objective is to deliver income for shareholders by investing in less liquid asset-backed securities (“ABS”), is pleased to announce its Interim Results for the six-months ended 30 September 2025.
TwentyFour Select Monthly Income Fund Limited (“SMIF” or “the Company”), the listed, closed-ended investment company that pays a monthly dividend to shareholders by investing in a diversified portfolio of credit securities
Similar companies but not identical, SMIF pays a monthly dividend which could be useful to balance your monthly outgoings.
TFIF
SMIF
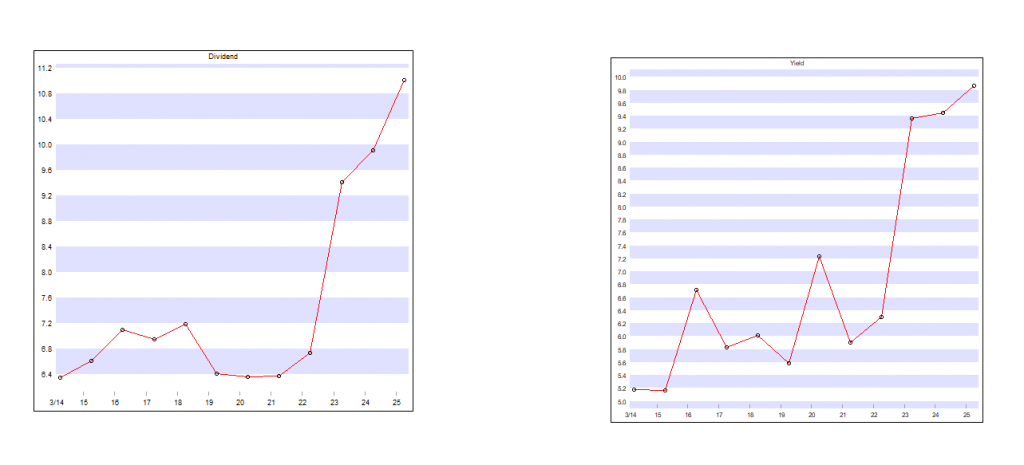
TFIF currently pays a quarterly dividend of 2p
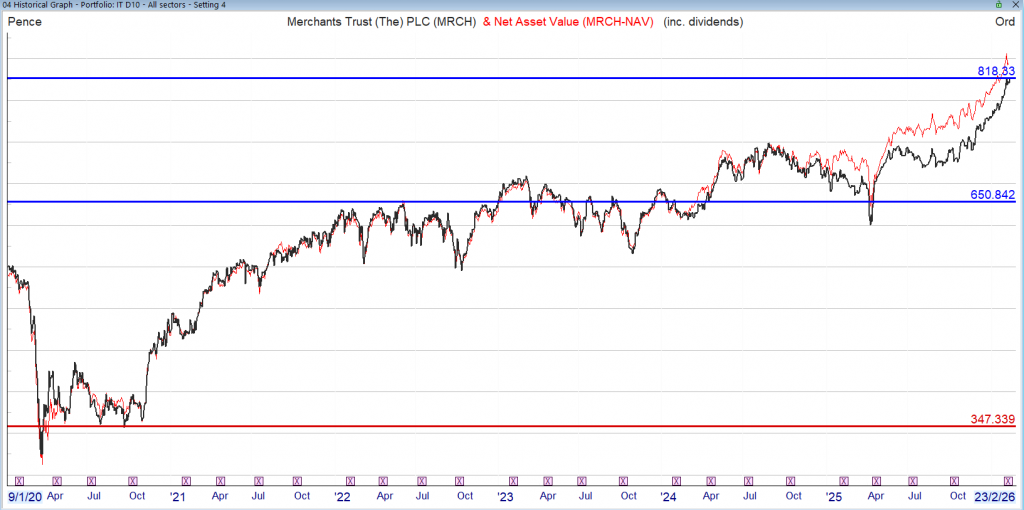
SMIF currently pays a monthly dividend of 0.5p
Both funds may pay out any surplus income as a special dividend, which complicates the yield graph above.
As interest rates fall the higher dividends become more attractive so both shares trade at small premium.
The Income Method: How To Use Cash Flow To Fund Your Retirement
Feb. 09, 2026
Rida Morwa Investing Group Leader
Summary
We prioritize investments that pay us to wait, ensuring our retirement isn’t dependent on “finding a fool” to buy our shares at a higher price.
By targeting a 9% average yield, we align our portfolios with historical total market returns while receiving our profits in cash.
Diversification is our “only free lunch.” Holding 42-plus individual securities ensures that a single dividend cut is a minor speed bump rather than a catastrophic event.
Automatic compounding: We advocate for reinvesting at least 25% of all distributions, allowing your “paycheck” to grow year-over-year without additional labor.
Business ownership mindset: Like a landlord collecting rent, we judge our success by the total income collected, not the fluctuating liquidation value on the screen.
Co-authored with Beyond Saving
We sit here writing about investments every day. For those of us who are deep into the investment world, it’s easy to lose sight of the reality that most people face: Managing your own investments is intimidating.
You worked your whole life in a business that probably had nothing at all to do with investing. You honed your skills and became an expert at something, which meant that you probably weren’t spending much time learning the difference between EPS, adjusted earnings, FCF, FFO, AFFO, CFFO, EBIT, EBITDA, and the rest of the alphabet soup that we investment nerds throw around.
Then you start thinking seriously about your retirement, and it’s important to you. It’s literally your quality of life that is at stake. It’s something that feels too important to just put into the hands of some stranger. So you make the decision that you’re going to manage your own investments.
You’re a smart person, so you do some reading, and you find yourself being pulled in numerous directions. For every stock that you find, someone is screaming that it’s a wonderful buy, and someone else is screaming that it’s a horrible pick. And they’re throwing out numbers and alphabet soup to prove their point.
The result that we often see is that people end up with directionless portfolios. They buy whatever ticker caught their eye, without any clear purpose. Many people can’t answer the question, “How is this investment helping you achieve your goals?” Many can’t even succinctly answer the question, “What are your goals?”
One of the things we’ve really emphasized here at High Dividend Opportunities is communicating our strategy and why we do what we do. Yes, we provide picks like every other service out there, but we believe that teaching members to fish is every bit as important as throwing out a shopping list.
The Income Method 101
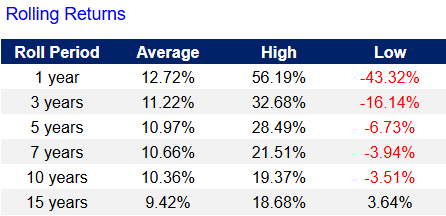
It has been an incredible 15 years for the equity markets. If we examine the annualized three-year return for the S&P 500 since 2012, it has consistently been above 10% and is currently over 20%.
That’s a long time for the equity markets to be consistently up. Investors have started accepting that such returns from equities are “normal” and that they should be expected. Yet, history tells us a different story. Consider that the all-time average for the S&P 500 is near 10%. In other words, returns from equities in the S&P 500 have been above average for 15 years and counting.
Many investors enter retirement with the plan of selling stocks for higher prices than they paid and using those gains to fund their lifestyle. The risk is that if prices decline, investors won’t have as much money as they think they have when they retire.
Equities Have Outperformed Recently
Here’s a look at rolling returns of the S&P 500 as measured by Vanguard 500 Index Fund;Investor (VFINX) since January 1985:
Portfolio Visualizer
The current 15-year return is 14.86%. History doesn’t tell us this is normal. History tells us that this is well above average. For many investors today, 15 years accounts for the entirety of their experience in the market. Many investors, even on Wall Street, have never known anything different.
As a result, investors today feel invincible. They have accepted that the stock market “always goes up.” It’s something I’ve seen a few times over the decades. In the 1990s, there was a similar sentiment. In the 2000s, everyone was buying real estate and lending at 140% loan-to-value on houses because real estate would “always go up” – nothing “always goes up.” That simply is not how the real world works.
It’s important to keep in perspective that stock prices can go up in two ways. First, they can go up because the company is earning more money per share. That’s great because it means the company itself is growing, and whether it keeps going up is dependent upon the company’s ability to continue growing.
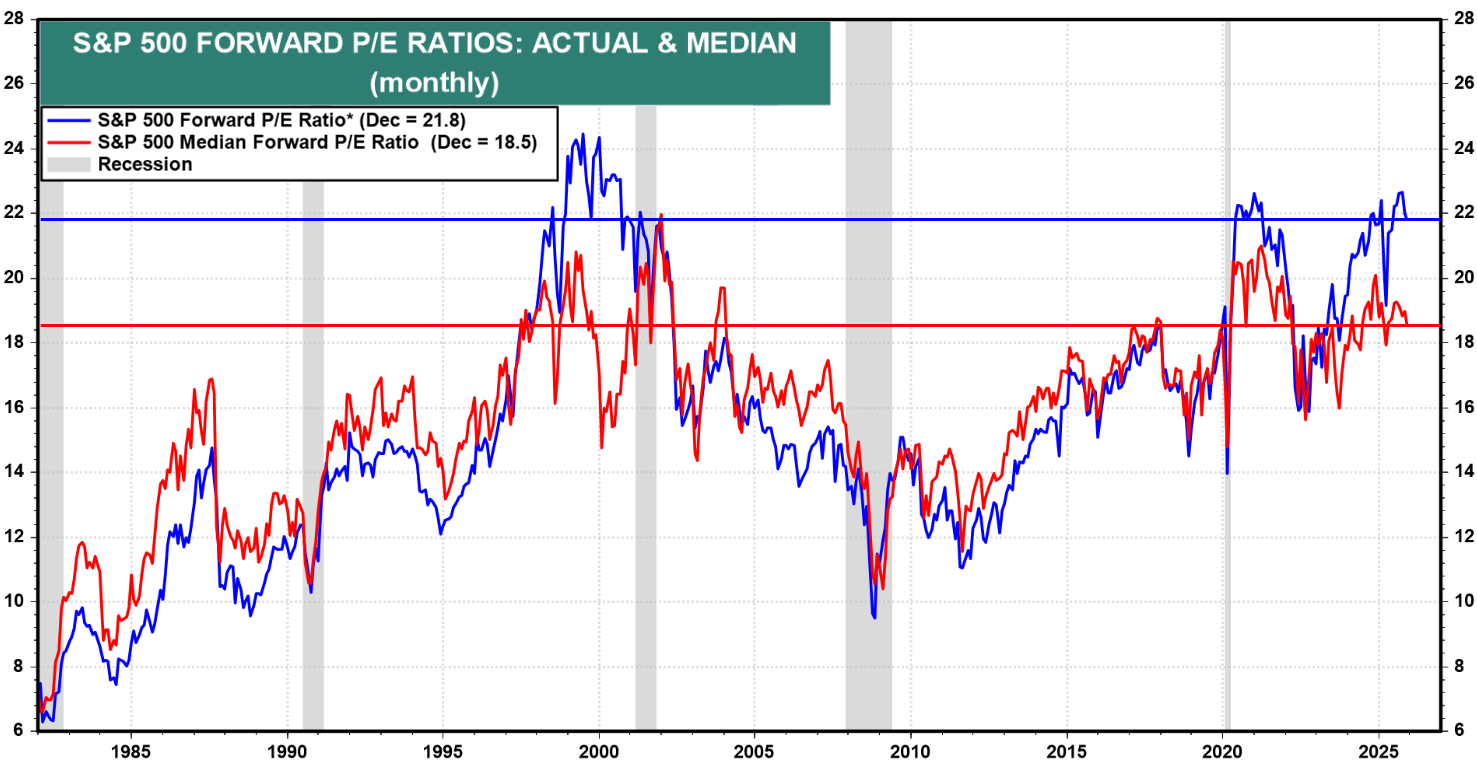
The second factor is valuation. This is the price relative to earnings per share. For each $1 a company is expected to earn over the following year, how much is that $1 worth?
In 2010, $1 in earnings in the S&P 500 translated to a share value of about $14. Today, $1 in earnings in the S&P 500 translates to a share price of about $22: Source
Yardeni
This is important to keep in perspective because while it’s plausible that earnings might continue to grow, it’s not plausible that valuations will continue to climb indefinitely. To get the same benefit of valuation expansion, the S&P 500 would have to climb to about 35x P/E.
Is that going to happen? Probably not. Realistically, one of two things will happen:
Equities will continue to increase in price at a pace matching earnings growth, but with minimal increase in valuation.
Valuations will decline, and share prices will decline even if earnings are climbing.
In short, it’s very unreasonable for a person retiring today to expect that their equity portfolio will continue to grow at a pace similar to what they’ve seen over the past decade. The risk that prices could materially decline cannot be ignored. In the past, the stock market has gone for 10-plus years without having any capital gains.
The plan of selling shares to fund your retirement is great if you can sell those shares at a higher price and higher valuation than when you bought them. It’s a plan that is very limiting if you are forced to sell shares at lower prices and lower valuations.
Our Solution: Cash Flow Over Price
We approach the stock market differently from most people. When you retire, do you need $1 million, $2 million, or $5 million? No. You do not need a lump sum of cash, and if you have a lump sum of cash, odds are you are going to take that cash and invest it somewhere.
When you retire, you are losing an income stream. Specifically, the paycheck that you received on a regular basis and that you used to pay your monthly bills. The paycheck stops coming, but the monthly bills continue to come, and they will continue for the rest of your life. What you need is a source of cash flow that will cover those bills, and you need that source of cash flow to continue in perpetuity.
When we invest in the stock market, ultimately, we’re investing in businesses. If you were a landlord renting houses, would you sit there checking Zillow every month to see if you made money? Of course not. You check to make sure your tenants paid rent. If you’re running a restaurant, are you hiring an appraiser to assess the potential liquidation value every month? No. You’re looking at your revenue and expenses to determine if you’re making a profit. Anyone who owns and operates a business is going to be focused on the cash flows the business is producing. They aren’t constantly assessing it to determine what the business could be sold for today. They aren’t making decisions based on what they think the business might sell for in the future.
Why do we treat owning part of a publicly traded business differently?
Our goal isn’t to own a business that someone might pay us a higher price for in the future. Our goal is to own businesses that are generating significant recurring cash flows and are sending a portion of that cash flow to us in the form of interest payments or dividends. If we sell a stock, we’re just going to buy a different stock. We certainly enjoy it when that opportunity arises, but our primary goal isn’t that some fool will offer us a valuation that we think is entirely too high. Our primary goal is to generate cash flow from our portfolios that is substantial enough to fully replace the paycheck we lose when we retire.
The price that a stock is trading at only matters at two points: the minute you buy and the minute you sell. Every other price that falls in between is at best an interesting factoid.
The Income Method
We call our investment strategy the Income Method. It’s a strategy that focuses on investing in companies that produce significant cash flow and provide our portfolios with cash flow through interest and dividend payments. Our goal is to increase the cash that is flowing into our portfolio. We want enough cash flow that is high enough to support regular withdrawals and some excess so that we can reinvest. Reinvesting will help grow our income even if companies aren’t raising dividends. It also provides a cushion to ensure that turmoil in the market does not threaten our ability to pay bills. The electric company doesn’t care that the stock market is down or that dividends were cut—they want you to pay the bill anyway.
It isn’t a complicated idea, and it’s one that everyone who has ever managed a budget should be familiar with.
You generate recurring income.
You pay bills using your recurring income.
You invest the excess for your future.
Does that sound familiar? It should because it’s what you’ve been doing your entire life. When you were working, you didn’t buy furniture so that you could sell it later to pay your rent. That would be silly. Yet in retirement, so many have readily accepted that you should sell assets, betting that the price of your remaining assets will grow fast enough that you won’t run out of things to sell.
Your retirement can be just like your working years. The only change is that your recurring income, which was being generated through your labor, is now being generated by the capital you have invested in stocks and bonds. You’re still generating an income, you’re still using that income to pay bills, and you’re still investing for your future. Instead of selling off assets every month, you are still buying more assets every month.
Some people would call that common sense.
The Guidelines
The structure of the Income Method follows a few guidelines to ensure that we’re achieving our goals today and in the future. Getting a ton of income today isn’t useful if it isn’t sustainable. You can’t go out there and just buy the highest-yielding investments and expect things to end well.
Buy Investments That Produce Significant Recurring Cash Flow:
Typically, we target having a portfolio that is producing an average yield of 9%. That’s a target that’s consistent with the long-term returns of the stock market. We expect that somewhere around 100% of our total returns will be coming in the form of interest/dividends, so we target an average yield that will be consistent with the long-term total returns investors can expect businesses to generate.
Diversify Among Asset Classes and Companies:
Nobody bats a thousand in the stock market. The reality is that you will sometimes make an investment that you thought had a safe income stream, and then something happens—the dividend is cut or even eliminated. When you were working, your income was likely tied to the one company you worked for. If you lost your job, you lost all your income until you found a new one.
Fortunately, as a retiree, it’s easy to diversify your income sources. We suggest a minimum of 42 different investments; we call it our Rule of 42. This means you have 42 different streams of income, so that if any one is disrupted, it isn’t a big deal.
Additionally, we suggest having a combination of common equities and fixed-income investments. The total return on common equities is often higher during periods like we’ve seen recently, where stock prices go up a lot. However, fixed-income like bonds and preferred equity will provide your portfolio with stable income year after year.
Investing as a retiree isn’t about getting the maximum possible. It’s about managing the risk to ensure that your portfolio has the best probability of meeting your needs.
Plan on Reinvestment:
When you look at stock market returns like the S&P 500, that’s always assuming you’re reinvesting 100% of your dividends and that you aren’t selling anything. When you’re in the building phase and working a career, that’s realistic. When you’re retired and using your portfolio as a source of income, that isn’t realistic at all.
Where a liquidation strategy means you are selling shares every year, the Income Method encourages you to use the interest and dividends your portfolio is producing to fund both your withdrawals and your reinvestment without selling a single share.
We suggest planning on reinvesting a minimum of 25%. So, if you want to withdraw $75,000/year from your portfolio, then you will need your portfolio to be producing over $100,000/year before you retire.
By reinvesting, you will own more shares and collect more interest and dividends next year. Allowing you to take out more to keep pace with inflation and providing a cushion in a Black Swan event like COVID-19.
Make Your Decisions Based on Improving Your Income:
When we make a decision to buy or sell investments, we look at it through the same lens that any business owner who makes decisions. What decision will make our income higher? More stable? Safer?
Sometimes, it isn’t possible to have everything. Maybe selling one investment to buy another will result in less income, but it’s something we judge to be safer. Or maybe we decide to take an intentional risk to buy something where the dividend is questionable but much higher. This isn’t different from any other investment style. Investing is about estimating the risk and balancing it against the potential reward and then determining what is best for you.
Some who follow the Income Method take a very conservative approach and focus on building up a large portfolio of fixed-income investments, avoiding any holdings that are “drama.” Others like to allocate a portion of their portfolios to “battleground” stocks where prices are very depressed, and yields are extraordinarily high.
Our job is to identify the opportunities and assess which investments will produce significant cash flow and which won’t.
Conclusion
The Income Method isn’t a “get rich quick” strategy. It isn’t an investment style that is trying to make homerun swings to see huge triple-digit returns. It’s a strategy that seeks to build an income stream methodically to reach a point where the interest and dividends are high enough to pay your bills, with an ample excess to reinvest so that you never have to sell an investment to survive. If you sell, you are selling because you believe there is an investment that is a better risk/reward.
We follow the macroeconomic news, but we don’t have to be reactive. We focus on the fundamentals of the companies we invest in. How much money are they making today, how much will they make in the future, and is the company going to continue providing a portion of those profits to us?
We take a long-term outlook and don’t worry about the short-term swings of the stock market. Our concern isn’t what someone in the future will pay for our shares – our concern is how much profit the businesses we own a piece of are going to generate. Valuations come and go, and right now they’re very high for a portion of the market. In our portfolio, we’re focused on the cash flow that we are collecting today, tomorrow, and next year. Whether the stock market is up or down doesn’t change our cash flow.
Stop treating your stocks like trading cards, hoping someone wants to pay more than you were willing to pay. Treat them like the businesses they are that are either producing cash flow for you or they aren’t.
Have a direction. Know what types of investments you are looking for and what benefit they provide your portfolio in the context of your overall strategy. Our method isn’t the only way to make money in the market, but it is the best strategy for us, and it’s a strategy that thousands have been able to successfully implement to achieve their goals.