Quote 7 If you want to speculate, do so with your eyes open, knowing that you will probably lose money in the end; be sure to limit the amount at risk and to separate it completely from your investment program.
The old maestro cautioned against falling for the market timing hype:
Quote 8 We are convinced that the average investor cannot deal successfully with price movements by endeavouring to forecast them.
And he thought that even the best of the best were unlikely to beat the market:
Tempus questions whether it’s worth investing in China after Fidelity China Special Situations shares gained 30%, fueled by stimulus measures. Despite concerns over stimulus-driven rallies, Tempus sees value in FCSS’s focus on small and mid-caps, fee reductions, and a share discount. Meanwhile, Questor rates Apax Global Alpha a buy as it trades at a 35% discount.
By Frank Buhagiar 22 Oct, 2024
Tempus – Is now the time to invest in China? Shares in Fidelity China Special Situations (FCSS) have been on something of a tear in recent weeks. Soaring Chinese stock markets and improving sentiment on the back of a series of stimulus measures from the authorities designed to revive the economy saw FCSS shares put on 30% in just four weeks. But after such a strong run, The Times asks the question, is this the beginning or the end?
The problem with stimulus-induced rallies is that markets invariably want more. So, when there is a pause in new measures and policies, investors can be tempted to take profits – cue a 7% drop in the Shanghai Composite index and blue-chip CSI 300 on Wednesday 9 October. As Tempus writes “the fear is that the sugar rush will end as quickly as it came.” But, as the article points out, “the country still accounts for 19 per cent of the global economy, and for some investors it may simply be too big to ignore.”
And if that’s the case, then, according to Tempus, FCSS could be worth considering. The fund was launched in 2010 and primarily invests in small and mid-caps, as well as unlisted businesses – around 29% is invested in mid-caps (£1 billion to £5 billion market caps), 34% in small-caps (sub £1 billion market caps) and a further 10% in private companies. FCSS, no stock market tracker then. Throw in the fund’s scale – the asset base stands at £1.2 billion after FCSS took on abrdn China earlier this year; the prospect of lower fees – FCSS has guided for a lower ongoing charge figure; and the shares trading at a double-digit discount to net assets and Tempus believes “there is still value to be captured.” Seems this could well be just the beginning.
Questor – Private equity at a discount Apax Global Alpha’s (APAX) investment managers aim to spot “hidden gems”, or attractive businesses that the UK private equity investor can then go on to help become better companies by implementing organisational/operational improvements. But, according to Questor, APAX itself is something of a hidden gem in need of “some spit and polish of its own after a slump in performance.” For over the past five years, the £690m investment company has only managed an 18% total shareholder return compared to the 34%-145% generated by 10 other London-listed funds over the same period.
The Telegraph tipster points the finger at APAX’s listed holdings – the fund is able to invest up to a quarter of assets in listed companies. So, when stock markets fell on the back of higher inflation and interest rates, the fund took a hit – the shares are off 38% from a peak of 227p in December 2021. At the time of the article, the shares were trading at 137p, a 35%+ discount to net assets.
Action is being taken. Listed companies exposure has been cut to 7%. Apax’s former Investment Manager, Karl Sternberg, has been appointed as the fund’s new chair and is “laser focused” on improving shareholder returns – already €30m (£25m) has gone into a “distribution pool” to fund share buy backs and/or special dividends. Dividends too are to be fixed at 11p per share which, at current share prices, delivers an 8% yield, the highest among its peers. With APAX ringing the changes, the fund appears to be practising what it preaches. Along with expected changes to cost disclosure rules that will enable APAX to list its annual ongoing charges at the actual 1.8% as opposed to the 4.3% it has to disclose under the existing rules, enough there for Questor to rate the fund a buy.
Life Sciences REIT led Winterflood’s list of top monthly movers among investment companies, driven by positive news, including a Half-Year Report and leasing updates. Tetragon Financial Group saw gains off the back of speculation about a potential deal for its Equitix holding. Geiger Counter, JPMorgan China Growth & Income and Baillie Gifford China Growth make up the rest of the top five.
By Frank Buhagiar
The Top Five
Life Sciences REIT (LABS) is the new leader atop of Winterflood’s list of highest monthly movers in the investment company space. That is thanks to a +26.5% share price gain on the month, an improvement on the previous week’s +22.7% rise. The strong share price performance coincides with a flurry of news in recent weeks, starting with a well-received Half-year Report on 26 September 2024, followed by a leasing update for the Cambourne Park Science & Technology Campus on 9 October and another for the Oxford Technology Park on the 14 October. All helping to keep the momentum going. Will there be another press release this coming week?
Tetragon Financial Group (TFG) comes from nowhere to storm into second place. A look at the graph shows the share price’s near-vertical climb started on 14 October. That was when the flexible investor put out a Statement Regarding Press Speculation. The speculation refers to a possible deal for the fund’s holding in Equitix. TFG’s press release goes on to state that its strategy “with respect to Equitix will continue to include engaging with strategic partners and financial advisors to explore options for executing on transactions or partnerships that would take advantage of this value enhancement.” That didn’t do much to dampen speculation – the shares went on to finish the week 19% higher, enough to bring the monthly gain up to +24%.
Geiger Counter (GCL) is another new entry in third – shares in the uranium investor up +21.7% over the course of the month. Apart from daily Net Asset Value updates, no news flow out from the company. But a closer look at those updates shows that over the course of the week ended Friday 18 October 2024 NAV increased +13.5% to 66.21p. Cue an +11.75% share price increase for the week. Now, uranium does not trade on an open market like other commodities, as buyers and sellers negotiate contracts privately. Helpfully, Cameco keeps track of industry average prices that are published at month-end. Based on GCL’s NAV updates, chances are October’s price will top September’s US$82 mark.
JPMorgan China Growth & Income (JCGI) and Baillie Gifford China Growth (BGCG), last week’s top two, complete this week’s top five. Both saw their share price gains shrink: JCGI from +33.7% to +20.4%; and BGCG’s from +31.7% to +20.1%. Both in need of another round of stimuli from the Chinese authorities if they are to feature in next week’s top five.
Scottish Mortgage
Scottish Mortgage’s (SMT) share price finished the week ended Friday 18 October 2024 up +5.9% on the month, a little off the +8.7% gain seen seven days earlier. NAV held up better – up +6.6% compared to +8.6% previously. The wider global sector saw its monthly gain shrink to +2.2% from +4.3% previously. Quick check-in with the Nasdaq shows the tech-heavy index is up +4.8% on the month. That compares to a +7.74% monthly gain last week. SMT just tracking the wider market then.
Quote 5 The investor’s primary interest lies in acquiring and holding suitable securities at suitable prices. Graham was not against active investing. He was an incredibly successful stock market investor in his day.
But he also knew that very few stood a chance of winning that game.
Quote 6 Much effort and ability are directed on Wall Street toward selecting stocks or industrial groups that in the matter of price will “do better” than the rest over a fairly short period in the future. Logical as this endeavour may seem, we do not believe it is suited to the needs or temperament of the true investor—particularly since he would be competing with numerous stock-market traders and first-class financial analysts who are trying to do the same thing. As in all other activities that emphasize price movements first and underlying values second, the work of many intelligent minds constantly engaged in this field tends to be self-neutralizing and self-defeating over the years.
Without proper training, discipline, and application, Graham felt that most forays into the stock market were just speculation and rarely ended well:
What would have happened to the world’s unluckiest investor?
21 October 2024
Even by buying in at the worst possible times, poor old Jim would have made stellar returns.
By Emma Wallis
News editor, Trustnet
Stock markets around the world have hit all-time highs this year, which begs the question of whether investors putting money into equities now are investing at the market’s peak.
Valuations look rich in the US – which makes up the majority of global equity indices – and there are reasons to believe volatility might increase from here, including the US presidential election and rising geopolitical tensions.
Yet despite these factors, financial advisers continue to recommend that most investors place a large chunk of their savings into the equity markets to have the best chance of achieving returns. Are they turning a blind eye to stock market peaks or is this sound advice?
To put that question to the test, Trustnet asked Vanguard what would have happened if an investor had committed capital at the height of every previous bubble, just before the stock market tanked.
If somebody got their market timing as wrong as possible, would they have been better off waiting on the sidelines in cash or did equities eventually reap rewards?
To answer that question, James Norton, head of retirement and managed services at Vanguard, told the story of the fictitious unlucky Jim.
“Jim has a long-term goal to grow his capital. He also understands that markets rise and fall and is committed to holding onto his investments through thick and thin. Unfortunately, Jim is also the world’s unluckiest investor, and has an uncanny habit of investing lump sums at market peaks,” Norton said.
Jim chose a passively managed, global fund tracking the FTSE All World index and made his first investment of £2,500 in September 1997, just in time for the Asian financial crisis. Within a month, he had lost £228.
Undeterred, Jim braced himself to try again and invested another £2,500 in July 1998, just in time for Russia to default on its debt and the US hedge fund Long-Term Capital Management to collapse. “This time he’s down more than £840 in a month, but clings on.”
Markets bounced back and Jim became more confident, putting £10,000 into equities in mid-2000. The dot-com bubble bursting, the 11 September 2001 attacks on the World Trade Center and the war in Afghanistan all contributed to stock markets falling almost 50% by September 2002.
Jim stuck to his guns, did not tinker with his investments and was ultimately rewarded by a stock market boom.
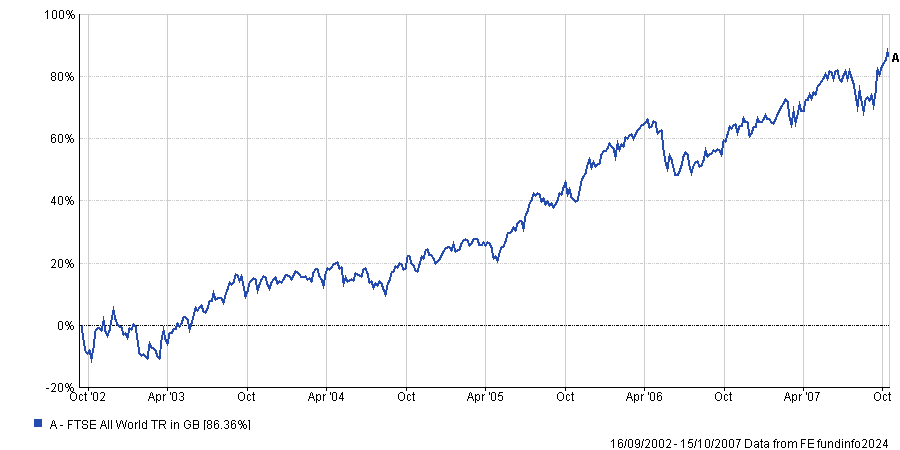
FTSE All World from mid-Sep 2002 to mid-Oct 2007
Source: FE Analytics
By October 2007, when markets peaked again, he had committed £15,000 and his savings were worth £21,153. Not a bad result given that his timing was so awful.
So Jim decided to invest an additional £5,000: “just in time for the US subprime debt crisis to kick off the global financial crisis”, Norton said.
“Jim’s steely calm remains, however, and by late 2019 he’s sitting on a pot of more than £75,000 and is ready to invest a further £10,000. Days later the Covid-19 pandemic unleashes the fastest bear market of modern times.”
By December 2021, markets had recovered, so Jim contributed another £5,000 – “perfectly timing the market peak, ahead of the Russian invasion of Ukraine, rising global inflation and monetary tightening”.
By the end of September 2024, after a 27-year investment journey, Jim had contributed a total of £35,000 and the value of his investments was £146,450, a return of more than 300% on his initial outlay.
Jim’s return was much lower than the FTSE All World index itself, which climbed 518.5% between 1 September 1997 and 30 September 2024. But even with the worst possible luck, his equity portfolio grew his wealth far in excess of anything that more conservative investments such as cash or bonds would have achieved.
The Bloomberg Global Aggregate index, a dollar-denominated bond market proxy, rose 155.3% in the same period.
Whilst market timing is notoriously difficult, the moral of the story is that time in the market counts for more than timing the market. “While no one can possibly know what’s around the corner, a disciplined, diversified, long-term approach can help even the unluckiest amongst us,” Norton said.
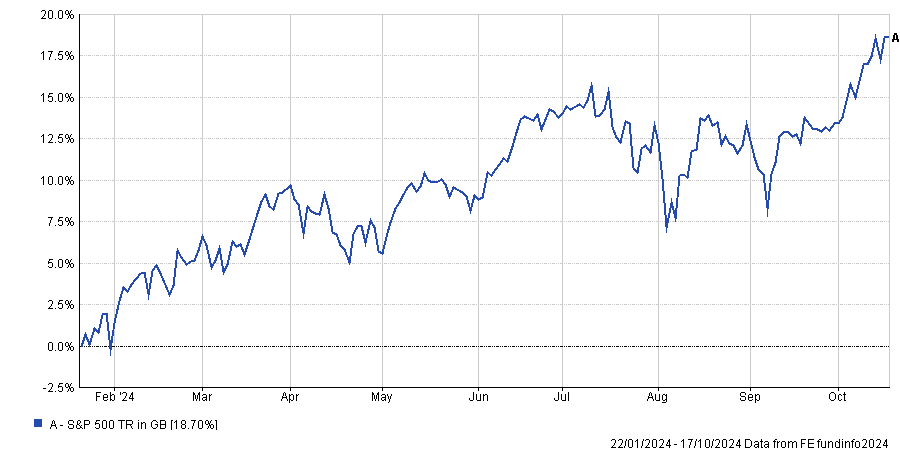
As for trying to ascertain whether the market has reached a peak, that too is extremely hard to tell. The S&P 500 index made headlines on Friday 19 January 2024 by hitting an all-time high, surpassing its previous peak on 3 January 2022.
Anyone trying to sell out at the top – or holding off on a new investment in late January 2024 – would have missed out on the US equity market’s subsequent 18.7% return (in sterling terms).
Performance of S&P 500 since 22 Jan 2024
Source: FE Analytics
Historical highs are not uncommon, according to John Plassard, senior investment specialist at Mirabaud Group. Between 1950 and January 2024, the US equity market hit 1,201 all-time highs, an average of nearly 16 records per year.
“The new highs reached by the markets are not as significant as some people think. They are often linked to continued growth in the economy and corporate profits. Although there are periods of economic and market slowdown, over time improvements in productivity and innovation have continued to propel markets to new heights,” he explained.
“Staying invested in the market for decades and taking full advantage of compound returns, including reinvested dividends, is a much surer route to prosperity than trying to anticipate the ups and downs of the market.”
Quote 3 The defensive (or passive) investor will place his chief emphasis on the avoidance of serious mistakes or losses. His second aim will be freedom from effort, annoyance, and the need for making frequent decisions. Indeed, Graham sketched out an asset allocation strategy that is still a perfectly sensible starting point:
Quote 4 He [the passive investor] should divide his funds between high-grade bonds and high-grade common stocks. We have suggested as a fundamental guiding rule that the investor should never have less than 25% or more than 75% of his funds in common stocks, with a consistent inverse range of between 75% and 25% in bonds. There is an implication here that the standard division should be an equal one, or 50–50, between the two major investment mediums. Of course, you couldn’t just buy a globally diversified ETF in Graham’s time. But his advice readily translates into the purchase of a large cap index tracker such as an MSCI World ETF and a high-quality government bond ETF. Beyond that, Graham was clearly an advocate of the buy and hold strategy:
££££££££££
For he, read he, she, or any colour of the rainbow.
abrdn Asian Income Fund Ltd ex-dividend date abrdn Diversified Income & Growth PLC dividend payment date Bankers Investment Trust PLC ex-dividend date Brunner Investment Trust PLC ex-dividend date Chelverton UK Dividend Trust PLC ex-dividend date City of London Investment Trust PLC ex-dividend date CQS Natural Resources Growth & Income PLC ex-dividend date CQS New City High Yield Fund Ltd ex-dividend date Doric Nimrod Air Three Ltd ex-dividend date Doric Nimrod Air Two Ltd ex-dividend date Foresight Solar Fund Ltd ex-dividend date Henderson Far East Income Ltd ex-dividend date JPMorgan Global Core Real Assets Ltd ex-dividend date Law Debenture Corp PLC dividend payment date Pacific Horizon Investment Trust PLC ex-dividend date
Up to 16.8% yields! Here are the 10 highest-paying dividend stocks in the FTSE 350
Story by Zaven Boyrazian
So, what are the biggest opportunities I think are out there for income investors to consider right now?
Top 10 income stocks
In order of dividend yield, here are the largest payouts in the FTSE 350 that make me think they’re worth investors researching further.
Ithaca Energy – 16.75%
NextEnergy Solar Fund – 10.76%
Energean – 10.27%
SDCL Energy Efficiency Income Trust – 10.25%
Phoenix Group Holdings – 10.24%
M&G – 9.73%
TwentyFour Income Fund – 9.47%
Legal & General – 9.27%
Abrdn – 9.25%
British American Tobacco – 8.77%
It doesn’t take more than a quick glance to notice a lot of the income opportunities lie within the energy and financial services sector. Both industries are being riddled with uncertainty right now. The oil & gas sector is tackling supply chain terrors from the ongoing and horrendous conflicts in Ukraine and Gaza. Meanwhile, insurance and investment companies are at the mercy of interest rate fluctuations.
However, it’s not exactly a secret that by capitalising on unloved companies, tremendous returns can potentially be unlocked. After all, that’s often where some of the biggest bargains can be found.
So, is now the time to start thinking about snapping up these businesses while they’re still cheap? Not necessarily. Let’s take a closer look at the current pack leader, Ithaca Energy.
Risk vs reward
With the firm’s medium-term production output seemingly set in stone, management feels comfortable enough to return $500m of dividends to shareholders in 2024 and 2025, fuelling the stock’s impressive 16.8% dividend yield. But if that’s the case, why haven’t investors been rushing to buy its shares
The problem is a looming risk of equity dilution. Acquiring Eni’s oil & gas assets is going to require quite a bit of capital. And with debt being quite expensive right now, that likely means a whole bunch of new shares are likely to be issued, sending the stock price firmly in the wrong direction.
At the same time, the UK windfall taxes on energy companies are expected to take quite a toll on earnings in the current tax year. And profitability could come under further pressure if unforeseen complications emerge during the integration process.
In other words, Ithaca’s yield appears to be high due to high levels of uncertainty. If the company manages to defy expectations, opportunistic investors could reap tremendous returns. But the opposite is also true. And should the worst come to pass, a 16.8% yield may quickly evaporate.
Therefore, when exploring high-yield opportunities, investors must consider the risks attached to an investment. Otherwise, it’s easy to tumble into an income trap.