abrdn European Logistics Income PLC ex-dividend date Alternative Income REIT PLC ex-dividend date BlackRock American Income Trust PLC ex-dividend date EJF Investments Ltd ex-dividend date Fidelity Special Values PLC ex-dividend date Greencoat UK Wind PLC ex-dividend date Majedie Investments PLC ex-dividend date NextEnergy Solar Fund Ltd ex-dividend date Octopus Renewables Infrastructure Trust PLC ex-dividend date Partners Group Private Equity Ltd ex-dividend date Pershing Square Holdings Ltd ex-dividend date Target Healthcare REIT PLC ex-dividend date
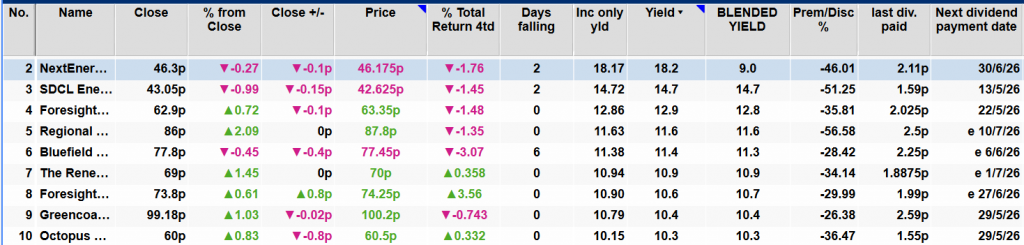
With an estimated discount ceiling of 15–20%, there’s still room for discounts to tighten if NAV performance improves this year, potentially driving strong total returns when paired with dividend yields of around 10%.
Because it seems everyone’s got the knives out for stocks right now…
Get Back In The Box Miss Sharp
Even the deputy governor at the Bank of England is sounding the alarm bells:
Sarah Breeden says the US-Iran war has created “the worst energy shock in my living memory…”
Private credit is showing cracks…
Government debt is ballooning…
And equity valuations, she says, are “stretched” in ways that “rhyme with the vulnerabilities” that preceded the 2008 financial crisis:
“There’s a lot of risk out there… there will be an adjustment…”
And she is just the latest in a long line of investment veterans who believe the market is firmly in the “playing with fire” realm…
With permabear Jeremy Grantham – the 87-year-old British-born billionaire investor and philanthropist – declaring:
“We’re in the biggest stock market bubble ever”.
And warning the inevitable correction could be as grim as the Great Depression.
So, what to do?
When the stocks start falling, do you try to catch the ‘falling knives’?
Most standard investment advice is DON’T!
But Howard Stanley, the co-founder and co-chairman of Oaktree Capital Management, the largest investor in distressed securities worldwide, says DO!
In his view, that’s how you get bargains!
The higher this market rises, the greater the fall will likely be.
The SNOWBALL knows what shares it would like to buy if/when the market falls, one problem is there are too many in the coveted list and it would also have to sell first to buy.
Without hindsight, you can only sell at the top and buy at the bottom by luck, so don’t beat yourself up when you don’t. You can buy the yield because as prices fall the yield rises.
Renew Infra Grp Ld – Strategy/Company/ Operations UpdateDate/Time:11/05/2026 07:00:31 ▼
This announcement has been determined to contain inside information for the purposes of the UK Market Abuse Regulation.
The Renewables Infrastructure Group Limited
·
Reaffirmed target dividend of 7.55p per share for 2026, progressive dividend policy and projected net dividend cover of between 1.1x and 1.2x on a sustainable basis.
·
Targeting £400 million to be realised principally from asset disposals and complemented by modest debt issuance over the next 12 months, comprising £100 million that completes the aggregate objective set out in 2025 and a further £300 million.
·
Proceeds to be deployed in line with the Board’s capital allocation policy, prioritising capital return to shareholders via share buybacks, reduced RCF borrowings and into higher returningproprietaryinternal opportunities. At the present share price, the Company is not pursuing any new third-party investments.
The Renewables Infrastructure Group Limited (“TRIG” or “the Company”) is a London-listed renewable energy investment company. TRIG creates shareholder value through a resilient dividend and long-term capital growth, underpinned by a diversified portfolio of renewable energy infrastructure that is actively managed by specialist investment and operations managers.
The Board and Managers, InfraRed Capital Partners and RES Group (together, the “Managers”), will provide today an update to shareholders at TRIG’s 2026 Capital Markets Seminar (“CMS“). Full details for the event are available at the end of this release.
Richard Morse, Chairman, TRIG, said: “The medium-term growth opportunity for TRIG is compelling for those shareholders looking to benefit from resilient income and capital growth, backed by visible cash flows from a high quality portfolio of wind, solar, and battery storage. Whilst we maintain a high conviction in TRIG’s investment case, it is clear that we must go further in our actions to manage the Company’s persistent share price discount.”
“TRIG intends to raise £400 million from asset disposals and optimising the portfolio’s structural gearing in the next 12 months to free up capital to support the Company’s investment case. The most advanced disposal processes are well in train. We intend to use proceeds to promptly complete the announced share buyback programme; reduce the Company’s RCF borrowings, and invest in internal, proprietary investments where they demonstrably exceed the net return hurdle implied by share buybacks.”
“The Board and Managers look forward to the Capital Markets Seminar at which we will update on TRIG’s strategy. The Board would like to thank TRIG’s shareholders for their continued support and engagement.”
Strategy Update
At today’s CMS, the Board will reiterate the high conviction it maintains in the Company’s medium-term growth opportunity underpinned by the UK and European governments’ desire for greater energy security, the resulting strength of the energy transition investment theme and TRIG’s proprietary internal investment pipeline. The Company’s geographically diversified portfolio of wind, solar, and battery storage assets provides measured, defensive exposure to the long-term, structural energy transition taking place across developed energy markets in Europe.
Electrification and energy security will continue to drive future electricity demand due to an active reduction in the use of fossil fuels, the increasing electrification of transport and heating, and the greater demand from data centres and AI.
TRIG has a conservative approach to leverage, with c. 90% of debt being fixed rate and repaid over the term of the portfolio’s fixed-price revenues, which underpins TRIG’s longevity through market cycles given its intentionally low interest rate risk and low refinancing risk.
The Board has every confidence TRIG can deliver compelling, risk-adjusted returns to those shareholders wishing to allocate capital to energy security and the ongoing transition and, in return, add resilient income and long-term capital growth to their portfolio.
To achieve this, the Company aims to:
·
Deliver a sustainable net dividend cover of between 1.1x and 1.2x;
·
Continue the Company’s progressive dividend policy to increase the dividend when the Board considers it prudent to do so, considering forecast cash flows, expected dividend cover, inflation across TRIG’s key markets, the outlook for electricity prices and the operational performance of the Company’s portfolio; and,
·
Generate a compound annualised growth rate in distributable cash flow per share of approximately 4 per cent in the five years to 2030 driven by active asset management, progressing internal investment opportunities within the existing portfolio, and share buybacks where they represent the best allocation of capital.
Further discount management
This medium-term growth opportunity notwithstanding, the persistence of the Company’s discount to net asset value (“NAV“) at which its shares have traded led the Board to carefully consider options to manage the discount and support a sustainable share price recovery such that TRIG can deliver its medium-term growth opportunity.
Following careful consideration of TRIG’s options, the Company is now intensifying its focus and resources to go further in its management of the share price discount and in turn strengthen TRIG’s investment case. The Board targets raising £400 million in the next 12 months principally from asset disposals and complemented by optimising structural gearing across the portfolio, comprising £100 million that completes the aggregate objective set out in 2025 and a further £300 million. The most advanced of these disposal processes is in relation to a UK offshore wind asset, where the Company is in exclusivity with an experienced international infrastructure investor, due diligence is materially progressed and an acceptable price has been agreed. Disposals will be targeted to preserve the portfolio composition required to deliver the medium-term growth opportunity.
Within the existing capital allocation policy, the Company will use the £400 million targeted proceeds together with retained cash in excess of the dividend paid to:
·
Complete the £150 million share buybackpromptly of which £101 million has been completed between 9 August 2024 and 8 May 2026, leaving £49 million remaining as of today;
·
Reduce short-term, floating-rate borrowings under the Company’s RCF by repaying the c. £240 million drawn as at 31 March 2026, thereby providing greater balance sheet flexibility;
·
Invest £50 million in internal investments through further asset enhancements of the portfolio where such projects demonstrably exceed the net return hurdle implied by share buybacks on a risk-adjusted basis. Such internal investments include, inter alia, operational upgrades such as aerodynamic hardware for wind turbines, onshore wind repowering, greenfield batteries at proprietary sites, and co-location of batteries at existing generation assets; and,
·
Create surplus liquidity for accretive use with an estimated £75 million in cash available following repayment of the RCF, completion of the share buyback programme and funding of internal investments. Use of surplus liquidity will be determined by the Board as the proceeds of disposals are received and in line with the Board’s capital allocation priorities. At the prevailing share price this would likely be to extend the share buyback programme. New external investments, where the Company acquires third-party assets, are not being pursued at the prevailing share price discount to NAV.
Improved investment and operations management arrangements
Conditional on the passing of the continuation vote at the upcoming annual general meeting, effective 1 July 2026, investment and operations management fees will be based solely on market capitalisation. Under the new arrangements, the total fees paid to the Managers for Q1 2026 would have been £3.68 million, compared to the £4.53 million actually paid, representing a saving of £0.85 million (or £3.4 million on an annualised basis). This equates to a 19% reduction in fees, in addition to the reduction in management fees secured by the Board in 2025 amounting to c. £8m p.a. or 28%. The fee cap that applies to the existing arrangements will be retained. In addition to the 30.6 million shares in the Company already owned by the Managers, this change in fee basis further aligns the interests of the Managers with those of shareholders. The Board welcomes the change in fee basis agreed with the Managers, and the resulting saving for the Company when the shares are trading at a discount to NAV.
In reaching this agreement, the Board considered the Investment Management Arrangement (“IMA“) and Operations Management Arrangement (“OMA“) alongside the Company’s performance and shareholder feedback. The Board assessed whether the existing management structure – specifically the continued use of its current external managers – remained suitable for executing the proposed strategy. Following shareholder consultation, the Board identified a minority preference for in-housing management or the tendering of external management arrangements, while the majority of shareholders consulted remained supportive of the current management structure. After careful consideration of this feedback, receiving advice from its financial advisers and after conducting a detailed appraisal of various alternative approaches to management (including internalisation and/or a change in managers), the Board believes that the current managers represent the best management team to deliver the Board’s further discount management initiatives and support TRIG’s medium-term growth opportunity.
Strategy Execution
For the Company to be effective in its discount management and for shareholders to benefit from the medium-term growth opportunity, the Board’s direction and Managers’ execution of its strategy must continue at pace.
The Company has a track record of delivering resilient income since IPO, with a total 25% growth in the dividend and average net dividend cover of 1.2x, after the systematic repayment of project-level debt.
Over the last year, the Board and Managers delivered:
· Resilient cash flow generation: the portfolio’s distributable cash flow enabled the Company to:
o achieve its dividend target of 7.55p per share for 2025 fully covered in cash;
o repay £192 million of project level debt; and,
o accelerate the pace of the share buyback programme with £101 million of the announced £150 million programme completed to date, delivering 1.2p per share of NAV accretion for shareholders.
· Strong financial position: in early 2026, the Company raised £200 million of debt on favourable terms through a private placement. Following the private placement debt issuance, long-term structural gearing was 41% of look-through enterprise value, and c. 90% of TRIG’s debt is fixed rate and over the term of the portfolio’s fixed-price revenues.
· Asset disposals: the Company is actively progressing asset disposals. As noted above, the most advanced of these disposal processes is in relation to a UK offshore wind asset.
· Advancing development projects: construction of more than 200MW capacity is underway. Construction and development activities are an important component of the medium-term growth strategy supporting higher returns, progressing portfolio diversification and evolving the portfolio balance. These activities included:
o 78MW two-hour Ryton battery project, which is in the final stages of construction with grid energisation expected towards the end of Q2 2026;
o 25MW Cuxac onshore wind repowering project with energisation in H2 2026; and,
o 100MW two-hour Spennymoor battery project with energisation in 2027.
· Active revenue management: the Managers have been active in securing new revenue price fixes. Of particular note was the 10‑year revenue contracts with Virgin Media O2, which improved the portfolio’s long‑term cash flow projections. This is in line with the Company’s strategy of enhancing revenue, cash flow and dividend visibility through active revenue management.
· Operational enhancements: Following the rollout of various operational and technical enhancements across nearly 300MW of assets during 2025, investments with generation capacity of nearly 700MW will be upgraded in 2026.
Lindsell Train Investment Trust – “Market mispricing AI risk”
07 May 2026
QuotedData
QDprime
“Market mispricing AI risk”
During periods of global market uncertainty, the companies held by Lindsell Train Investment Trust (LTI) and its manager, Lindsell Train Limited (LTL), have tended to perform well as investors seek durable and resilient cash flows. Whilst some holdings – particularly those in the consumer staple sector – have proven defensive amid volatility linked to the Iran war, growing fears around the impact of artificial intelligence (AI) on software and data businesses has hit LTI and LTL hard.
This has been particularly acute at portfolio holding RELX. LTL argues that the market’s assessment is wrong. In sectors such as legal and financial, the cost of error is extremely high, and regulatory barriers make the datasets valuable and essential for the successful application of AI tools. Reflecting this, LTI used market weakness to initiate a position in US credit scoring giant FICO (which was already held in LTL’s Global strategy) in February.
Whilst funds under management at LTL have continued to fall, the company has launched a new $200m strategy focused on international equities, seeded by its substantial cash pile and a longstanding client.
Maximise returns over the long-term
LTI aims to maximise total returns over the long term, while preserving shareholders’ capital. It invests in a concentrated portfolio of global equities that it has identified as market-leading and that benefit from high returns on equity. It also invests in a range of Lindsell Train-managed funds and the unlisted security of its investment manager, Lindsell Train Limited.
Year ended
Share price total return (%)
NAV total return (%)
MSCI World Index TR (%)
30/04/2022
(11.5)
(4.2)
6.4
30/04/2023
(10.9)
10.1
3.1
30/04/2024
(19.5)
1.8
18.8
30/04/2025
10.7
12.2
5.1
30/04/2026
(23.6)
(17.7)
27.0
Source: Bloomberg, Marten & Co
Fund profile
Concentrated portfolio of 13 global equity stocks plus Lindsell Train funds
Lindsell Train Investment Trust (LTI) aims to deliver long-term total returns while preserving the real value of capital. It invests in a concentrated portfolio of 13 global “heritage” companies, alongside selected Lindsell Train funds and a stake in its manager, Lindsell Train Limited (LTL). The LTL management fee for LT managed funds and other funds that LTL manages are rebated back to LTI, so as to avoid double charging of fees.
As of March 2026, global equities made up 62.4% of NAV, with look-through exposure to 49 holdings. The trust is benchmarked against the MSCI World Index (in sterling) but is managed independently, with an active share close to 100%. LTI was launched in 2001 and is listed on the premium segment of the main market of the London Stock Exchange. LTI’s board of directors is the company’s AIFM and receives no remuneration for doing so.
Investment approach
LTL focuses on holding a small number of high-conviction, high-quality companies for the long term. It believes concentration can reduce risk more effectively than broad diversification. These businesses typically have durable competitive advantages and long histories (average age of LTI’s direct equity holdings of around 147 years).
Symbiotic relationship with LTL
LTI has a symbiotic relationship with LTL, helping seed new funds and benefitting from their growth. Its initial £66,000 investment in LTL grew significantly and stood at £28.2m (as at the end of March 2026), peaking at 48% of NAV in 2021 before declining to 19.8% by March 2026 due to weaker performance and reduced assets under management.
Market backdrop
War in Iran has heightened global geopolitical uncertainty
Global market uncertainty has heightened with the war in Iran intensifying geopolitical tension and upending a global economic recovery. Growth expectations have been lowered on the back of the energy price shock and re-accelerating inflation, with central banks being forced to shelve rate cutting plans as a higher-for-longer interest rate backdrop emerges.
At the same time, investors are also evaluating how artificial intelligence (AI) could reshape entire industries and sectors, distinguishing between likely beneficiaries and those at risk of disruption.
Markets have become highly event-driven and volatile, with concerns about inflation, oil prices, interest rates, and geopolitics all affecting sentiment. The impact of the uncertainty caused by both unstable geopolitics and the threat posed by AI has been great on LTI and LTL’s portfolios. We look at both here.
Geopolitical tension
Defensive stocks back in focus
The war in Iran and wider instability in the Middle East has brought defensive stocks back into focus. While energy, defence/aerospace and selective commodity stocks have made substantial gains, other safe haven sectors, including banking, have also benefitted. LTL’s consumer staples exposure has likewise proven relatively resilient in recent months. Within LTI’s portfolio, beauty and personal care giant Unilever was up double-digits in the year before it was reported that it was selling its food business in March (which we detail on page 9). Meanwhile, snacks behemoth Mondelez and soft drinks manufacturer AG Barr were both up in the weeks following the outbreak of war.
All four boast long-term track records of durable and growing revenues and should continue to reliably compound for years and decades to come. In the last period of significant market volatility – at the start of 2025 when tariff uncertainty and the DeepSeek large language model (LLM) launched – LTI and LTL’s portfolio held up relatively well, while tech-dominated indices, including the S&P 500 and NASDAQ faltered. This is illustrated in Figure 1, which shows LTI’s NAV return relative to the MSCI World Index.
Figure 1: LTI NAV total return relative to the MSCI World Index1
Source: Bloomberg, Marten & Co. Note 1) rebased to 100 at 31 December 2024
The benefits of its defensive positioning were not quite as pronounced in the aftermath of the start of the war in Iran this year, coming at a time when a number of LTL’s data businesses were caught up in the widespread software sell-off.
Software sell-off
Data businesses suffered large sell-off
Following the launch by Anthropic of industry specific plugins for Claude Cowork in January – targeting particular verticals such as legal and finance – a period of indiscriminate selling of data and digital platform businesses ensued. The concern is that cheap AI tools may soon commoditise data provision altogether or at least impact future growth prospects.
A number of LTI and LTL’s holdings were caught up in this, not least London Stock Exchange Group (LSEG) and RELX.
LTL believes that the market has misjudged both companies, underestimating the long-term value of the datasets on which the new AI models depend. In sectors such as legal, risk, financial, and medical, the cost of error is extremely high, while much of the underlying data is protected by clear physical and regulatory barriers, meaning a significant proportion remains entirely unavailable to large language models (LLMs). As a result, trusted, accurate, reference-grade data should remain valuable even as AI tools become more widely adopted.
Figure 2: RELX (GBP)
Source: Bloomberg
RELX, which provides services to the global scientific, legal and insurance industries, already offers similar AI-enabled workflow tools. LTL argues that, whilst new AI applications are being developed, the value is less likely to accrue to the models themselves but more to the owners of the datasets upon which they rely. Both RELX and LSEG possess clear data moats. RELX, for example, has amassed over 100 billion legal documents and grows this data daily – the vast majority of which contain proprietary content. This legal data is rarely more than 1%-2% of a law firm’s cost base, LTL estimates. However, it is critical to their function and does not seem an obvious target for cost savings.
LTL believes that investors have overly discounted the long-term earnings potential of these and other data businesses, creating a buying opportunity. As such, LTI has recently initiated a position in US credit-scoring giant FICO (which we detail on page 10).
Investment process
Investment universe of 150 companies
LTL operates within a small universe of potential investments, typically no more than 150 companies, due to its strict focus on heritage businesses with predictable earnings (supported by pricing power and/or intellectual property), low capital intensity and sustainably high returns on capital. As a result, LTI has maintained a highly concentrated portfolio since its launch in 2001, averaging around 15 holdings (currently 13).
Most qualifying companies tend to fall into a limited number of broad sectors:
Consumer branded goods;
Internet, media, software; and
Financials and networks.
Bottom-up approach without reference to benchmark
The portfolio is constructed on a purely “bottom-up” basis, with no reference to benchmarks. Each potential investment undergoes a rigorous due diligence process (sometimes lasting several years) including meetings with management and detailed industry analysis.
Valuation is assessed using multiple methods. Whilst LTL does not rely on traditionally constructed discounted cash flow (DCF) models, its approach shares many of its core principles, particularly in focusing on the long-term sustainability of returns of a company. Companies identified as offering the best value are selected for inclusion in the portfolio.
ESG integration
Signatory of UN Principles for Responsible Investment
LTI’s manager is a signatory to the United Nations Principles for Responsible Investment, the UK Stewardship Code, and the Net Zero Asset Managers initiative. It actively engages with portfolio companies on ESG issues, including climate change, and measures portfolio-level carbon emissions, footprint (tCO₂e/$m invested), and intensity (tCO₂e/$m sales) to assess exposure to climate-related risks.
LTL believes that companies with strong ESG standards are likely to be more durable and deliver superior long-term returns. Accordingly, ESG analysis is embedded in the investment process and covers environmental factors (including climate change), social, governance (including remuneration and capital allocation), as well as cyber resilience, responsible data use, human rights, anti-corruption, and reputational risks.
ESG factors influence portfolio decisions
Where ESG factors are expected to materially affect long-term prospects, they are incorporated into valuation assumptions, particularly long-term growth rates, and influence portfolio decisions, including whether to initiate, hold, or exit positions.
Consistent with its philosophy, LTL avoids:
capital-intensive sectors such as energy, commodities, and mining, including companies involved in coal, oil, or gas extraction; and
industries considered socially harmful or exposed to regulatory or litigation risk, such as tobacco, gambling, and arms manufacturing.
Active engagement with company management on ESG and stewardship issues is a core part of the strategy. Whilst generally supportive of management, LTL will seek to influence decisions where it disagrees with company actions.
Investment policy and restrictions
LTI can invest globally across a broad range of financial assets, including equities (listed and unlisted), bonds, funds and cash, with no sector or geographic constraints. Individual holdings are limited to 15% of gross assets. It may also invest up to 25% in LTL-managed funds (subject to board approval) and may retain holdings in LTL to benefit from its long-term growth.
The company does not invest for control purposes and will not allocate more than 15% of gross assets to other closed-ended investment funds.
Exits
Low single-digit portfolio turnover rate
LTL maintains a low single-digit portfolio turnover rate, with LTI’s turnover even lower. Investments are typically held for the long term, reflecting its conviction in the value of owning high-quality businesses over extended periods.
Positions are reduced or exited only for compelling reasons, such as a share price exceeding intrinsic value, or erosion of competitive advantages.
Long-term holding avoids transaction fees
This long-term approach minimises transaction costs, which the manager views as a drag on capital, and requires patience and discipline to look beyond short-term market noise. Exit decisions may also be influenced by the availability of alternative opportunities with stronger upside potential, with the manager typically identifying two or three vetted candidates at any given time.
Asset allocation
Figure 3: Breakdown of LTI’s portfolio at 31 March 2026
Source: Lindsell Train Investment Trust
Figure 4: LTI portfolio by location of underlying revenue at 30 Sept 20251
Source: Lindsell Train Investment Trust. Note 1) On a look-through basis, aggregating direct holdings with indirect holdings held by LTL funds
At 31 March 2026, more than 60% of LTI’s portfolio value was invested in global equities, with LTL making up almost 20%. Over a third of underlying portfolio revenue originated from the US (on a look-through basis including positions in LTL), while Europe accounted for a quarter of revenues and the UK just over a fifth.
Figure 5: LTI holdings at 31 March 2026
Stock/holding
Sector
As at 31/03/26 (%)
As at 30/09/25 (%)
Change (%)
Lindsell Train Limited (LTL)
Unlisted security
19.8
24.4
(4.6)
London Stock Exchange Group
Financials
14.4
11.3
3.1
Lindsell Train North American Equity Fund
LTL managed fund
13.5
12.2
1.3
Nintendo
Communication services
11.1
14.0
(2.9)
RELX
Industrials
6.4
7.4
(1.0)
A.G. Barr
Consumer staples
4.7
4.0
0.7
Unilever
Consumer staples
4.6
5.0
(0.4)
Diageo
Consumer staples
4.2
4.4
(0.2)
Thermo Fisher Scientific
Healthcare
3.2
2.5
0.7
Mondelez International
Consumer staples
3.0
3.3
(0.3)
Universal Music Group
Communication services
2.6
3.1
(0.5)
Heineken
Consumer staples
2.4
2.1
0.3
PayPal
Financials
2.2
2.6
(0.4)
Finsbury Growth & Income Trust Plc
Financials
2.1
2.1
0.0
Laurent-Perrier
Consumer staples
2.0
1.7
0.3
FICO
Financials
1.7
–
1.7
Cash & equivalent
–
2.1
0.2
1.9
Source: Lindsell Train Investment Trust, Marten & Co
We have covered many of LTI’s holdings in previous notes (links to which can be found on page 19). Here we cover some important events among portfolio companies, as well as update on LTL.
Universal Music Group (UMG)
Figure 6: UMG (EUR)
Source: Bloomberg
We explained LTL’s investment rationale for UMG, which it bought into at the end of 2023, in detail in our initiation note and the manager says that this has not changed. Its belief that the Euronext Amsterdam-listed company was vastly undervalued has been proven by a £48bn bid for the company by Pershing Square Capital Management. Announced earlier this month, the deal values UMG’s shares at €25 compared to its previous closing price of €17.05.
If it goes ahead, shareholders in UMG will receive €9.4bn in cash and 0.77 new UMG shares as part of the deal, which would see UMG merge with Pershing Square SPARC Holdings, the special purpose vehicle established four years ago to make a large acquisition, and list on the New York stock exchange. Under the transaction, 17% of UMG shares will be bought back and cancelled while preserving the company’s investment grade balance sheet, and a new dividend policy may also be adopted.
UMG’s shares have been depressed since listing in 2021, with concerns over French conglomerate Bolloré Group’s 18% stake, the postponement of UMG’s US listing, under-utilisation of its balance sheet, and the threat of AI deepfakes on music industry revenues weighing on performance.
The LTL team believes that that whilst AI can generate huge volumes of music-like content, it does not change the value of real, established, and in-demand catalogues. UMG’s ownership of major music rights, where it controls roughly a third of the world’s recorded music (ahead of the other two major players Sony and Warner), puts it in a strong position to push for better pricing from streaming platforms such as Spotify, it adds.
The payout model currently used by the platforms – based on a simple pro-rata share of listening – is expected to improve and evolve allowing for minimum payments or fixed-value arrangements tied to the worth of catalogues. This would give UMG leverage to force platforms to absorb higher content costs or raise their own subscription prices. Changes would likely take time to flow through because UMG needs to align terms across multiple streaming partners, the manager says, but the direction of travel is positive.
Unilever
Figure 7: Unilever (GBP)
Source: Bloomberg
FTSE 100 conglomerate Unilever has been a long-term holding for LTL and a consistent presence in LTI’s portfolio. Last month, the group announced it had reached a deal to sell its food business to spice maker McCormick, creating a $66bn company with $20bn of annual revenues.
As part of the cash-and-stock transaction, Unilever shareholders will own 65% of the combined group, with McCormick owning the remaining 35%. Unilever will also receive $15.7bn of cash from McCormick under the deal terms. It has been structured as a so-called Reverse Morris Trust, which allows the parent company (Unilever) to minimise its tax liabilities on the disposal if it retains a majority stake in the divested enterprise.
Unilever says that the deal, which is expected to complete by mid-2027 subject to McCormick shareholder approval, will transform the company from a multi-category conglomerate into a more focused, pureplay beauty and personal care company. The division accounts for a large portion of group revenues and is seen as faster-growing sectors.
Unilever has been pivoting away from food over the past decade to focus on beauty and wellbeing categories – last year spinning-off its Magnum ice cream holding into an independent entity.
Shareholders reacted negatively towards the McCormick deal, with its share price falling heavily since first being reported in March. LTI had reduced its position in Unilever earlier in the year, before the price weakened. The manager believes that the greater attraction of Unilever’s household and personal care portfolio has put selling pressure on the remains of Unilever’s food business. It thinks that it is this, rather than the merits of the deal, that has negatively impacted Unilever’s share price.
FICO
Figure 8: FICO (USD)
Source: Bloomberg
Partly funded by the exit of Unilever’s Magnum ice cream business noted above, LTI initiated a 2% holding in US-listed credit scoring giant FICO in February. It has been a constituent of LTL’s global equity portfolio since 2022, and the manager took advantage of share price weakness linked to the perceived threat from AI to add to its position.
FICO has two core businesses: the credit scores segment and the software arm. LTL notes that much of FICO’s growth has come from pricing power, with significant further room to raise prices after decades of undercharging. It believes that the scores business still has a large growth runway ahead of it, with opportunities to increase pricing and tweak its charging model, as well as capturing more of the value chain. Meanwhile, the software business’s shift to a new cloud-based platform has presented it with greater opportunities to cross-sell its risk and fraud prevention services.
LTL believes the AI disruption fears are misplaced in FICO’s case due to the sensitivity and protection given to the underlying bureau data and the regulatory burden around the scores themselves.
Diageo
Figure 9: Diageo (GBP)
Source: Bloomberg
A major recent development at drinks giant Diageo was the announcement of the halving of its dividend. New chief executive Dave Lewis said the company had taken the decision to reduce the pay-out in order to strengthen its balance sheet and drive long-term growth.
Lewis had been appointed earlier this year to turnaround the ailing company, which owns some of the best-selling premium spirit brands globally but has suffered a collapse in its share price since its peak in 2021. The dollar-based company declared an interim dividend of 20 cents per share in half-year results, down from 40.5 cents. Going forward, it said it would target paying 30-50% of earnings with a minimum annual dividend of 50 cents.
LTL says that it supports the dividend cut, providing it helps protect the balance sheet and avoids more damaging actions like selling valuable assets. Whilst acknowledging the disappointment, it believes that the core long-term strengths of the business remain intact: strong brands, durable market positions, and growth potential in markets such as India.
Diageo’s share price weakness has been exacerbated recently, with the company being uniquely hit by Trump’s tariffs, as a significant portion of its products are imported into the US from Mexico and Canada. Another concern for shareholders stems from the fact that people are drinking less. The manager says that the data points to a more nuanced story, however.
LTL
LTI’s performance is still largely determined by that of its largest exposure, LTL, which at the end of March 2026 accounted for 19.8% of the portfolio, down from 24.5% six months earlier. LTL has experienced substantial investor outflows in recent years. Funds under management (FUM) at LTL have fallen to £9.8bn in September 2025, from a peak of £24.3bn in July 2021. Annual management fees make up almost 99% of LTL’s total revenues and 80% of net profits are paid to shareholders in dividends, meaning that the contribution made by LTL to LTI’s revenues remains considerable.
One positive development amid declining FUM is the recent launch of a new international strategy (EAFE) focused on the developed world excluding the US, which complements LTL’s four existing strategies spanning global, UK, Japan and North American equities. LTL says that this strategy has been under consideration for some time, but current market valuations and growing demand for international equities made the timing particularly compelling.
Alongside the establishment of an International LLC (funded with balance sheet capital) a longstanding client also seeded the strategy through two segregated mandates. As a result, the strategy has launched with over $200m in AUM. The strategy will be co-managed by James Bullock and Ben van Leeuwen.
Direct comparisons with benchmarks and the global investment companies peer group are difficult to make due to LTI’s unique investment policy and the concentrated nature of its portfolio. Figure 10 shows that LTI’s NAV has fallen sharply over the past year relative to both its peer group and the MSCI World Index, as FUM at LTL has fallen further and sentiment towards its software holdings was hit by AI disruption fears.
Figure 10: LTI NAV total return performance relative to benchmark and peer group1
Source: Bloomberg, Marten & Co. Note 1) peer group is defined on below.
Despite the poor performance over five years, LTI’s 10-year NAV total return is still greater than both the peer group and the benchmark, as shown in Figure 11, reflecting the exceptional contribution of LTL in prior years.
Figure 11: Cumulative total return performance over periods ending 30 April 2026
6 months (%)
1 year (%)
3 years (%)
5 years (%)
10 years (%)
LTI share price
(14.6)
(23.6)
(31.9)
(46.3)
43.2
LTI NAV
(19.3)
(17.7)
(6.0)
(0.9)
262.2
MSCI World Index
3.3
27.0
58.6
73.9
254.9
Peer group average NAV
1.4
20.9
44.8
67.6
241.1
Source: Bloomberg, Marten & Co. Note 1) peer group is defined below.
Peer group analysis
Figure 12: Peer group comparative data as at 5 May 2026
Premium / (discount) (%)
Dividend yield (%)
Ongoing charge (%)
Market cap (£m)
Lindsell Train
(15.6)
7.0
0.80
120
Alliance Witan
(5.5)
2.2
0.47
4,823
AVI Global Trust
(8.4)
1.8
0.85
1,024
Bankers
(7.7)
2.0
0.51
1,313
Brunner
(8.3)
1.7
0.61
644
F&C
(8.1)
1.3
0.45
6,115
Mid Wynd
(1.7)
1.1
0.64
211
Monks
(5.4)
0.0
0.43
2,447
Scottish Mortgage
3.5
0.3
0.31
15,568
Sector median
(6.5)
1.9
0.56
3,585
LTI rank
9/9
1/9
8/9
9/9
Source: QuotedData website
Up-to-date information on LTI and its peers is available on our website
LTI is a constituent of the AIC’s Global sector, which is currently comprises nine companies. LTI’s discount is the widest among the peer group, while its dividend yield is far higher than the peer group median due to its unique structure and revenue contribution from LTL. The ongoing charges ratio is at the top end of this peer group, reflecting its small market cap (the smallest in the peer group), although we would argue that none of these charges are particularly high.
Figure 13: Peer group cumulative NAV total return data as at 30 April 2026
6 months
1 year
3 years
5 years
10 years
Lindsell Train
(19.3)
(17.7)
(6.0)
(0.9)
262.2
Alliance Witan
0.2
14.2
36.5
71.9
190.7
AVI Global Trust
1.4
13.1
40.7
88.6
205.1
Bankers
3.7
27.5
44.3
68.4
204.3
Brunner
5.1
22.0
42.5
98.0
214.5
F&C
3.6
24.9
55.8
94.4
242.2
Mid Wynd
(8.3)
1.4
8.3
24.3
143.4
Monks
0.2
29.3
52.2
49.1
254.3
Scottish Mortgage
5.2
35.2
78.3
46.3
474.0
Sector median
1.4
20.9
44.8
67.6
241.1
AGT rank
9/9
9/9
9/9
9/9
2/9
Source: Bloomberg, Marten & Co
Dividend
Figure 14: LTI dividend history
Source: Lindsell Train Investment Trust
LTI’s dividend is largely funded by the revenue income it receives from LTL, which accounts for around 72% of LTI’s total revenue. With FUM at LTL continuing to decline, further pressure in LTI’s dividend has become inevitable. For 2025, the dividend was £42 per share, down 18.4% on 2024. Further declines in LTL’s FUM will impact LTI’s future dividend, unless the board decides to draw upon revenue reserves, which seems unlikely.
Premium/(discount)
Figure 15: LTI discount over five years
Source: Bloomberg, Marten & Co
LTI’s discount has moved within a range of 10.4% to 24.7% and averaged 17.5% over the 12 months ended 30 April 2026. As of publishing, the company’s discount had narrowed to 15.6%.
As we have discussed, LTL’s quality-focused investing style has been out of favour for some time and has contributed to LTI’s wider discount, while the continued shrinking of FUM at LTL has also been a significant factor.
The board has indicated that it believes using share buybacks as a tool to reduce the discount would prove ineffective. To fund a buyback programme, the company would need to sell existing quoted investments, which would result in an increase in LTL’s percentage weighting within LTI’s portfolio and an increased expense ratio for remaining shareholders.
Fees and costs
Investment management fee of 0.6% of the lower of market cap or NAV
Under the terms of the investment management agreement, Lindsell Train Limited is entitled to receive an annual fee of 0.6%, calculated on the lower of adjusted market capitalisation or adjusted NAV. In the year to 31 March 2025, the manager was paid £819,000 (2024: £976,000).
The manager is also entitled to receive a performance fee, which is calculated annually at a rate of 10% of the value of any positive relative performance versus the benchmark in a financial year. Relative performance is measured by taking the lower of the NAV or average market price, taking into account dividends, at the end of each financial year and comparing the percentage annual change with the total return of the benchmark. A performance fee will only be paid out if the annual change is both above the benchmark and is a positive figure. No performance fee has been paid since 2021.
For the year ended 31 March 2025, LTI’s ongoing charges ratio was 0.80% (2024: 0.83%).
Capital structure
LTI has a simple capital structure with one class of ordinary share in issue. Its ordinary shares have a premium main market listing on the London Stock Exchange and, as at 5 May 2026, there were 20,000,000 in issues and none held in treasury.
Gearing
LTI is permitted to borrow up to a maximum of 50% of NAV, but it does not currently use gearing to enhance returns, in part reflecting the size and risk associated with the company’s unlisted investment in LTL.
Financial calendar
The trust’s year-end is 31 March. The annual results are usually released in June (interims in December) and its AGMs are usually held in September of each year. An annual dividend is usually paid in August.
Major shareholders
Figure 16: Major shareholders as at 5 May 2026
Source: Bloomberg
Management team
LTL is headed up by Michael Lindsell and Nick Train, who co-founded the business in 2000. The wider investment team comprises four members, all of whom are portfolio managers following recent promotions in March 2026.
Michael Lindsell
Michael co-founded LTL in 2000 and is the firm’s chief executive. He is the portfolio manager for Japanese equity portfolios and jointly manages global equity portfolios. Michael has over 40 years’ experience in investment management, including heading GT Management’s global and international funds. Following the acquisition of GT by Invesco in 1998, he was appointed head of the combined global product team. Michael has a degree in Zoology from the University of Bristol.
Nick Train
Nick co-founded LTL and is the firm’s chairman. He is the portfolio manager for UK equity portfolios and jointly manages global equity portfolios. Nick has over 40 years’ experience in investment management, including as head of global equities at M&G Investment Management. He previously he spent 17 years at GT Management. Nick has a degree in Modern History from the University of Oxford.
As is illustrated in Figure 17, all of LTI’s directors have personal investments in the trust, which we believe aligns directors’ interests with those of shareholders.
Figure 17: Directors
Director
Role
Date of appointment
Length of service (years)
Annual fee (£)
Shareholding1
Roger Lambert
Chair
23/09/2022
3.5
43,000
5,000
David MacLellan
Chair of the audit committee
30/08/2023
2.6
36,000
7,500
Nicholas Allan
Non-executive director
18/09/2018
7.5
29,000
15,000
Helena Vinnicombe
Senior independent director
23/09/2022
3.5
29,000
2,300
Sian Hansen
Non-executive director
04/06/2025
0.8
29,000
1,400
Michael Lindsell
Non-independent director
13/07/2006
19.7
–
1,333,884
Source: Lindsell Train Investment Trust. Notes: 1) Shareholdings as per most recent company announcements as at 5 May 2026.
Volatility has historically increased ahead of midterm elections, especially with other market pressures, such as geopolitical tensions, weighing on investor sentiment. We saw a similar macro backdrop in 2022.
By pairing well-positioned growth companies with income-generating, rate-sensitive assets, investors can build a portfolio that can withstand volatile markets amid midterm elections and geopolitical tensions.
To do this, a barbell approach, which provides a balanced portfolio built for managing both opportunity and uncertainty, has historically worked well.
I am Steven Cress, Head of Quantitative Strategies at Seeking Alpha. I manage the quant ratings and factor grades on stocks and ETFs in Seeking Alpha Premium. I also lead Alpha Picks, which selects the two most attractive stocks to buy each month, and also determines when to sell them.
eggeeggjiew/iStock via Getty Images
Best Stocks for Volatility: A Barbell Approach
With U.S. midterm elections now just six months away, markets are entering a period where policy uncertainty combines with seasonal volatility and lingering geopolitical uncertainty. While investors cheer all-time highs and can expect pockets of growth in AI-related stocks, multiple headwinds are likely to create significant volatility in the months ahead.
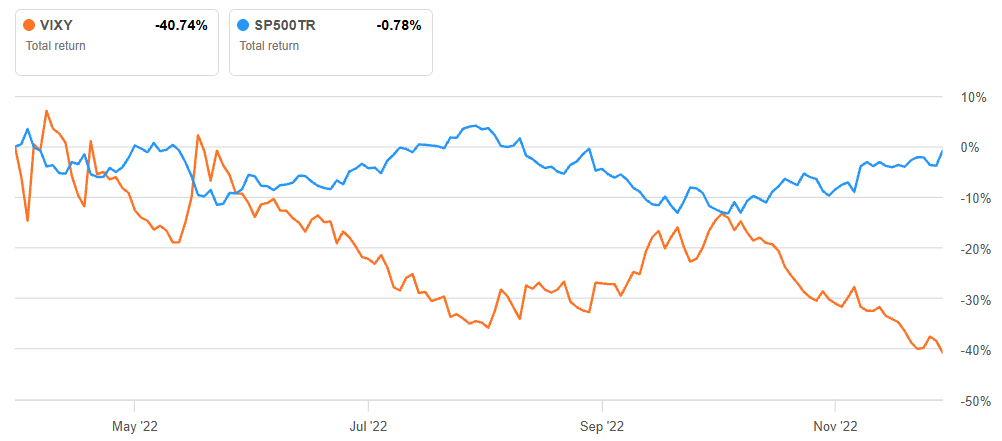
This period draws many parallels to the summer of 2022, when the Russia-Ukraine conflict was causing geopolitical tensions while the U.S. was headed into midterms during Joe Biden’s first term. That macro backdrop created mixed performance as investors struggled to price in 40–year-highs for inflation, oil supply disruptions, and political shifts.
Volatility Increased Leading Up to 2022 Midterms
Seeking Alpha
In environments like these, a barbell approach that pairs high-quality, income-generating defensive stocks with selective, high-growth opportunities has historically helped to minimize downside risk while still participating in upside. The following mix of six Quant Strong Buy stocks is designed to navigate volatility while remaining well positioned for longer-term growth.
How I Chose the Best Stocks to Build a Barbell Structure
To arrive at the best stocks for my barbell mix, I used the Seeking Alpha Stock Screener and chose the respective category in diverse categories, including Information Technology, Basic Materials, and Financials, then filtered for specific industries, such as semiconductors, gold, and property and casualty. I only considered highly rated Quant Strong Buys for my top six.
Growth Side: Offensive Exposure to AI and Infrastructure
AI infrastructure beneficiaries and select materials stocks are strong candidates for the growth side of the barbell.
Quant Sector Ranking (As of May 7, 2026): 12 out of 527
Quant Industry Ranking (As of May 7, 2026): 6 out of 69
Sector: Information Technology
Industry: Semiconductors
Seeking Alpha
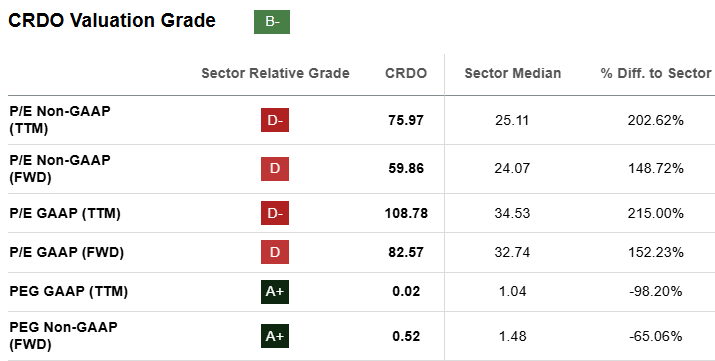
Beginning with a stock that’s in both my Alpha Picks and Pro Quant Portfolio lineups, Credo Technology is a key AI infrastructure supplier providing high-speed connectivity solutions within hyperscale data centers. Credo’s products act as the “plumbing” that GPUs and servers, helping to ensure high speed communication as workloads scale across data centers. In today’s macro environment, where hyperscalers continue massive capex spending despite the broader market uncertainty, CRDO offers direct exposure to the best growth opportunities of 2026.
Seeking Alpha
Despite what appears to be a large premium from a pure P/E perspective, CRDO’s forward PEG of 0.52 offers more than a 65% discount to the sector median. My readers and subscribers know that the PEG is my favorite valuation metric because it adjusts for forward growth, which is CRDO’s strongest attribute.
Seeking Alpha
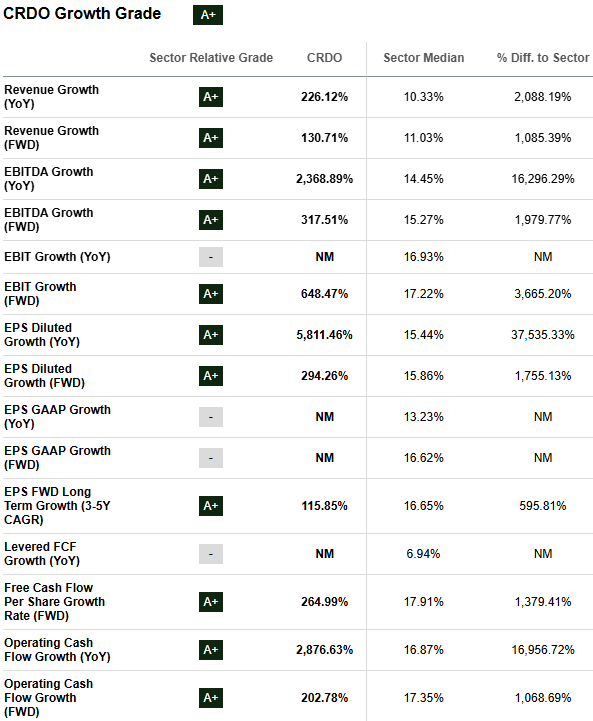
Investors who follow Quant know that you won’t find many stocks with ‘A+’ growth metrics as deep into the score card as Credo. Digging beneath the surface of its sector-crushing forward revenue growth, CRDO’s forward EBITDA, which shows how the company’s growth can translate into stronger earnings power, is more than 317%, which is more than 20x above the sector median. Demonstrating that earnings are translating into real cash, CRDO’s forward Operating Cash Flow Growth is above 200%, which is more than 1,000% ahead of sector peers. This also enables Credo to strategically invest in more growth opportunities, as it did with its recent deal to acquire DustPhotonics. Within the barbell framework, CRDO anchors the growth side with AI-focused strength. That infrastructure demand naturally takes us into semiconductor production capacity, where our next stock for the growth/offensive side.
Quant Sector Ranking (As of May 7, 2026): 5 out 0f 527
Quant Industry Ranking (As of May 7, 2026): 2 out of 32
Sector: Information Technology
Industry: Semiconductor Materials & Equipment
Seeking Alpha
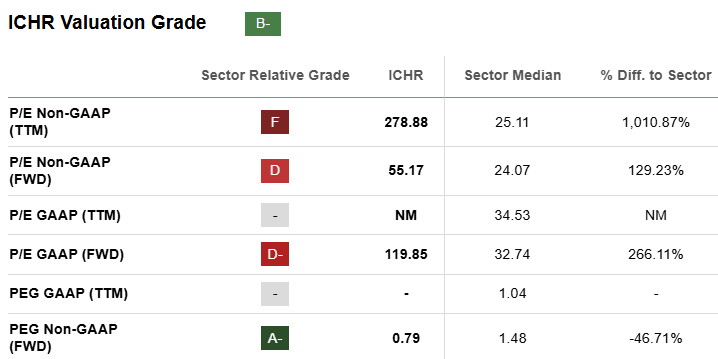
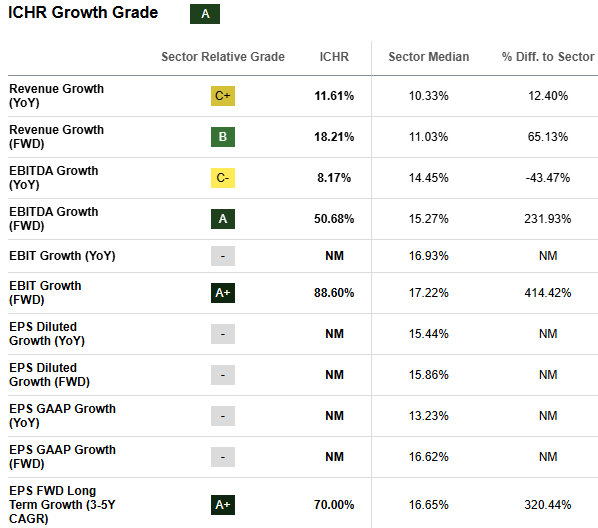
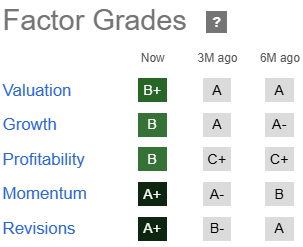
A recent addition to my Pro Quant Portfolio, Ichor Holdings designs, engineers, and manufactures fluid delivery systems for semiconductor equipment. This places ICHR upstream in the chip production cycle, working closely with leading wafer fabrication equipment providers, making it an early beneficiary of capex spending. As the AI buildout drives the need for more advanced chips, Ichor can continue to benefit from new data center buildouts.
Seeking Alpha
As I like to do with many of the growth stocks I feature in articles or add to portfolios, the superficial valuation metric, the trailing P/E, makes ICHR look incredibly expensive. While the forward P/E looks less expensive, investors should consider the forward PEG to get a clearer picture of growth-adjusted valuation. For ICHR, this metric suggests more than a 46% discount to the sector median. Focusing on the PEG has proved largely effective for me and many subscribers in picking growth stocks.
Seeking Alpha
Wafer fabrication equipment demand is expected to grow by 15-20% in 2026. Forward EBITDA Growth is expected at above 50%, which is more than 3x the sector median. In this week’s quarterly earnings call, CEO Philip Barros framed Q1 as early execution in what he called “a multiyear growth cycle,” saying, “Q1 revenues of $256 million came in at the upper end of our expectations, up 15% from Q4,” and adding, “Our Q2 forecast now reflects unconstrained demand exceeding $300 million.” Ichor’s early cycle buildout exposure supports its growth profile through the barbell’s offensive sleeve. Finishing that growth sleeve, we turn to physical materials that support electrification and industrial demand.
Quant Sector Ranking (As of May 7, 2026): 5 out of 283
Quant Industry Ranking (As of May 7, 2026): 1 out of 5
Sector: Materials
Industry: Aluminum
Seeking Alpha
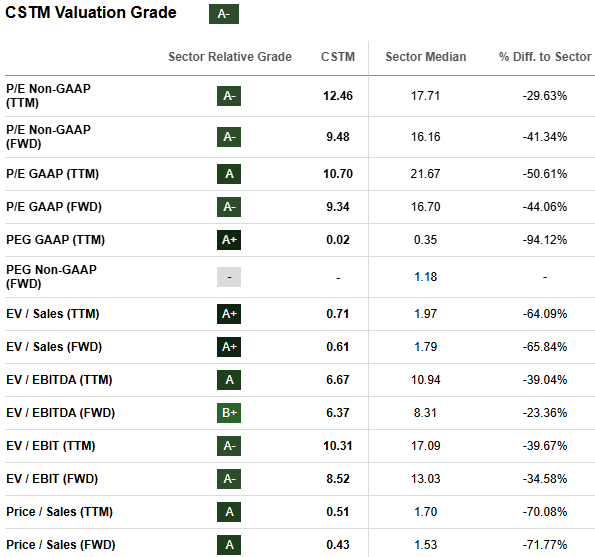
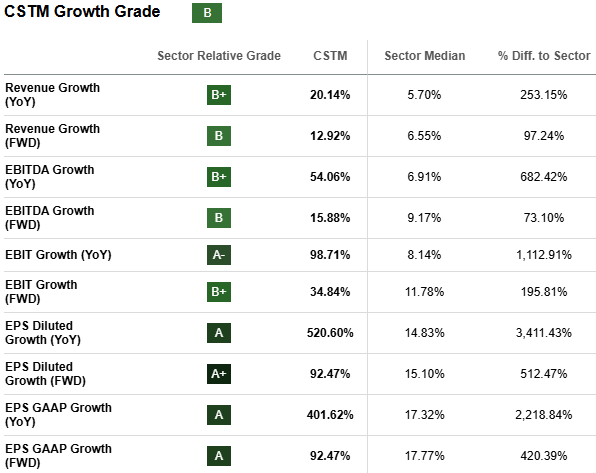
Another holding in my Alpha Picks portfolio, Constellium is a global producer of advanced aluminum products for a broad range of applications, including aerospace, automotive, and packaging markets. In a challenging macro backdrop in 2026, CSTM benefits from demand for all its products in a range of spaces, including electrification, infrastructure investment, and industrial reshoring. This provides a complement to our AI stocks in the growth sleeve of our barbell mix.
Seeking Alpha
CSTM has the most attractive valuation of our growth stocks, and we don’t need the forward PEG ratio to prove it. The company’s forward P/E starts off the value story, weighing in at 9.48, which is more than a 40% discount to the sector median. This attractive discount suggests CSTM’s price has room to run, especially when considering its solid forward growth numbers.
Seeking Alpha
In last week’s Q1 earnings call, CEO and Director Ingrid Joerg announced, “We are very pleased with our first quarter performance, including record adjusted EBITDA,” and “we are also raising our outlook for the full year and expect 2026 to be a record year for the company, both in terms of adjusted EBITDA and free cash flow.” CSTM’s outlook for 2026 looks promising, as management’s guidance for the year expects that favorable market conditions will continue amid supply shortages of automotive rolled products in North America as well as in aerospace.
Income Side: Defensive Plays for Volatility
Gold miners stand to benefit from a falling dollar and lower real yields in a post-Iran conflict environment, while property and casualty insurers provide stability.
Quant Sector Ranking (As of May 7, 2026): 18 out of 283
Quant Industry Ranking (As of May 7, 2026): 2 out of 49
Sector: Materials
Industry: Gold
Seeking Alpha
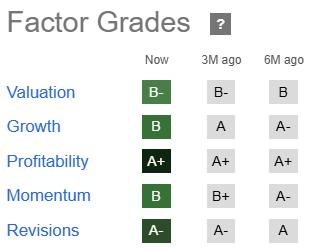
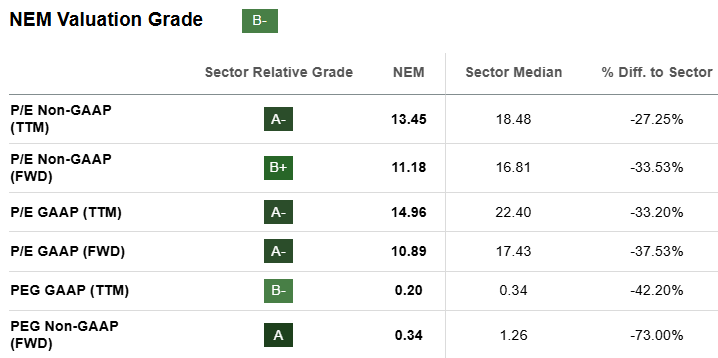
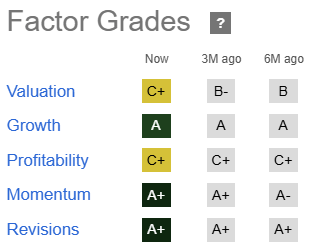
Another one of my Alpha Picks holdings, Newmont Corporation, is one of the world’s largest gold producers. Although not the most leveraged miner to buy within its peer group, it’s a large-cap, dividend-paying business that stands out due to its scale, diversified asset base, and solid fundamentals, making NEM the right choice for my barbell mix. Miners like Newmont are also mostly oversold and have moved inversely to oil as the dollar has strengthened. Tuesday’s move was a prime example as hopes for peace in the Middle East drove oil prices down, settling the day around 5% below where it started. Meanwhile, gold moved higher, and NEM’s price jumped 5.6%. From a Quant perspective, Newmont’s valuation and profitability are standouts that help to support its ‘A+’ Dividend Growth score.
Seeking Alpha
In an environment where gold can move higher, but volatility is expected, a large miner with an attractive valuation supports the income/defense sleeve of my barbell structure. NEM’s forward P/E of 11.18 already offers more than a 33% discount to the sector median, but the PEG is even more attractive at 0.34, indicating a growth-adjusted 73% discount to its peers.
Seeking Alpha
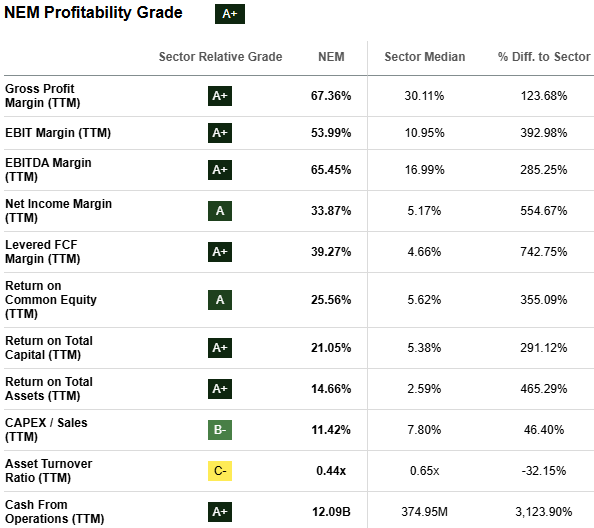
A mature miner with scale like Newmont can manage operating costs while benefiting from higher gold prices, as is evidenced by the EBITDA Margin of more than 65%, which is 285% better than the sector median. NEM’s monstrous Cash From Operations of 12.09B provides more support for the profitability story, helping to earn its ‘A+’ for the Quant Factor. It also supports growth for its dividend. Should the economy slow more than expected, NEM becomes a defensive shield as it benefits from falling real yields. That rate sensitivity extends into the Real Estate sector, where our next income/defensive piece of the barbell comes into play.
Quant Sector Ranking (As of May 7, 2026): 1 out of 171
Quant Industry Ranking (As of May 7, 2026): 1 out of 16
Sector: Real Estate
Industry: Office REITs
Seeking Alpha
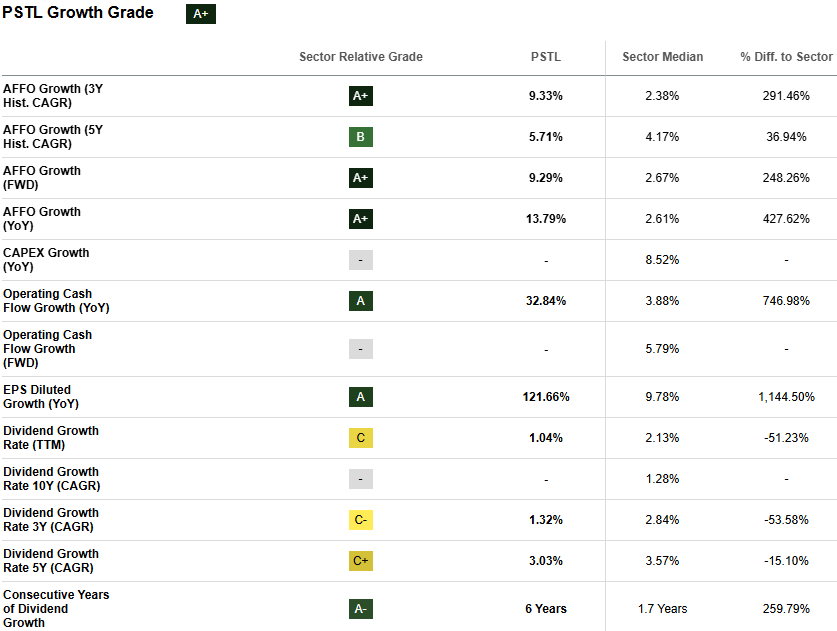
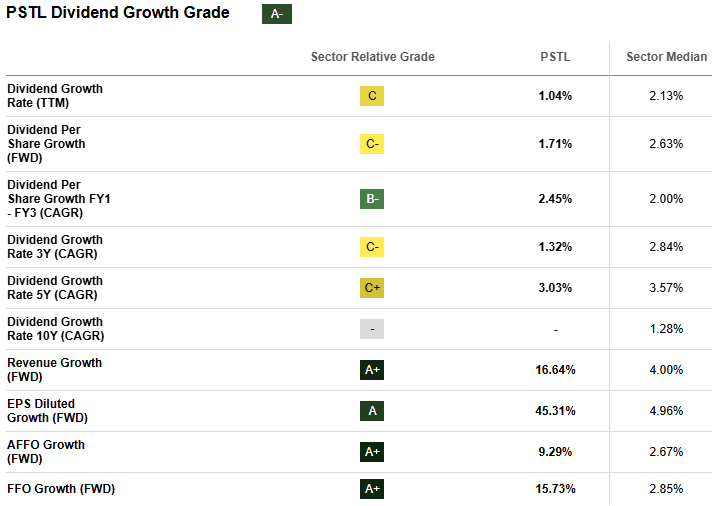
Featured in a dividend article I wrote last week, Postal Realty Trust is a niche REIT that owns properties leased primarily to the U.S. Postal Service, providing sovereign-backed stability with 100% rent collection. This makes PSTL attractive as a rate-sensitive asset acting as a defensive anchor against 2026 election-year volatility. Its near-full occupancy and growth acquisition strategy set it apart from the typical REIT.
PSTL’s predictable cash flows and 4.22% yield make it especially attractive in a falling rate environment where investors seek reliable income alternatives to fixed income. From a Quant perspective, PSTL demonstrates strong forward earnings potential and high scores for dividend growth.
Seeking Alpha
PSTL’s forward AFFO Growth of 9.29%, which approaches 250% above the sector median, signals that the company is expected to grow its true cash flow per share at a much faster rate than peers, which is notable for a traditionally slow-growing, income-oriented REIT. In other words, PSTL is not only a solid bond proxy, but it also combines stable, government-backed income with above-average, acquisition-driven growth. In its Q4 earnings call, CEO Andrew Spodek noted PSTL’s strong acquisition pipeline, highlighting that initial 2026 guidance is $115 million to $125 million in acquisitions at a mid-7% weighted average cap rate. This cash flow stability combined with growth potential supports further dividend strength.
Seeking Alpha
While PSTL’s 4%+ yield is solid, there’s room for growing its payout ratio as the Quant Growth Dividend grade of ‘A-’ suggests. As noted in the growth factor metrics, PSTL’s forward AFFO is more than 3x the sector median, demonstrating sustainable cash flow available to shareholders. While real estate companies like PSTL offer stable cash flow, insurance introduces another layer of defense through pricing power, which brings us to the next piece of our income/defensive barbell stock.
Quant Sector Ranking (As of May 7, 2026): 12 out of 683
Quant Industry Ranking (As of May 7, 2026): 1 out of 54
Sector: Financials
Industry: Property and Casualty Insurance
Seeking Alpha
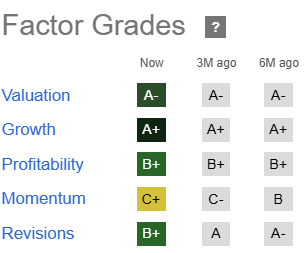
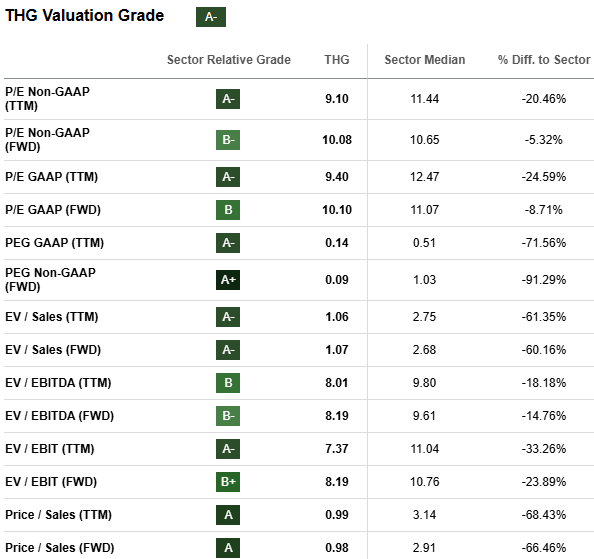
Hanover Insurance Group is a property and casualty insurer focused on personal, commercial, and specialty lines, known for a diversified portfolio and disciplined underwriting. The Top Property and Casualty Insurance stock, THG stands out through strong premium growth, healthy profit margins, and attractive dividend scores. In the current environment, pricing power allows the company to grow earnings, despite economic uncertainty, providing a defensive balance to our barbell mix. The insurance exposure also adds diversification to the gold and REIT complements. From a Quant perspective, THG’s impressive valuation and dividend scores stand out for this stock.
Seeking Alpha
In an environment where U.S. midterm election uncertainty combined with geopolitical tensions may create significant market volatility, THG’s forward PEG of 0.09, which is more than a 90% discount to sector peers, suggests stability and potential price appreciation. In its Q1 earnings, THG “achieved record first quarter performance, including operating return on equity of 20.3% and operating earnings per share of $5.25.” CFO Jeffrey Farber added that, “for the full year, we continue to expect an expense ratio of 30.3% as the benefit of growth leverage skews toward the latter part of the year.” This indicates efficient cost control and stronger underwriting ability, further supporting the company’s impressive Quant Dividend Scorecard.
Seeking Alpha
For purposes of our barbell mix, THG’s 2.04% yield isn’t as much for income purposes as it is for a signal of stability and fundamental strength. Seeing improvements in the past six months in its Dividend Growth from a ‘B’ to an ‘A’ and its Yield from ‘C’ to ‘B-’ provides evidence of the defensive characteristic needed to complete our barbell structure. Together, these six Quant Strong Buy stocks illustrate how a diversified barbell can capture growth while managing risk in a coming macro environment where midterms, seasonality, and geopolitics combine for market volatility.
Conclusion: Managing Both Opportunity and Uncertainty
This barbell structure combines high-growth exposure to AI infrastructure growth from massive hyperscale capex spending as well as industrial demand. Balancing the growth side is defensive positions in gold, real estate, and insurance. By pairing well-positioned growth companies with income-generating, rate-sensitive assets, investors can build a portfolio that can withstand volatile markets amid midterm elections and geopolitical tensions. However, risks remain. AI stocks may face valuation pressure if spending slows, and gold prices and insurance profitability can fluctuate with macro shifts. Despite these risks, a barbell approach provides a balanced portfolio built for managing both opportunity and uncertainty.
We have many stocks with strong buy recommendations, and you can filter them using Stock Screens to suit your specific investment objectives. Subscribe to Premium for unlimited access to Seeking Alpha quant ratings and expert content. Alternatively, if you’re looking for a select number of Quant Strong Buy recommendations on a monthly basis, you might want to explore Alpha Picks.
ISA Share Issue: Cautious BIPS manager Rhys Davies says bond markets still in a sweet spot for income investors
09 February 2026
QuotedData
Gavin Lumsden
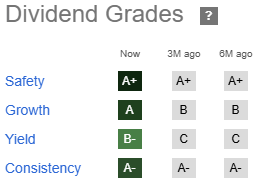
Invesco Bond Income Plus (BIPS), the largest and one of the more cautious funds in the Loan & Bonds sector, is issuing a new tranche of its 7%-yielding shares, but income investors who want to take advantage must move quickly as the offer ends at 2pm on Thursday.
The £423m investment company’s share issue kick starts an effort to raise up to 20% more capital so as to expand the asset base and further reduce shareholders’ costs as a percentage of the portfolio.
According to Morningstar data, BIPS is already the cheapest in its five-fund sector, charging total annual ongoing charges of 0.89% versus an average of 1.19%.
Over the past five years, since it re-launched from the merger of City Merchants High Yield and Invesco Enhanced Income, BIPS can’t claim to have been been the best performer in its peer group. Its 30.6% total shareholder return over the past 60 months is in fact the lowest in its group where the average return has been almost 48%.
However, that reflects a lower risk stance by fund managers Rhys Davies and Edward Craven who spread the portfolio across a large number of stocks (239) and avoid concentrated positions. Their largest exposure to one issuer is 2.9% in three of Lloyds bank’s high-yield bonds, for example.
BIPS’ 5.4% yield to maturity, which the fund will get if it holds all its loans and bonds until they are repaid, and the 7% dividend yield on its shares are also slightly below the peer group, indicating a bit less risk to capital.
Gearing, or borrowing, is also low at just under 3% at the end of December.
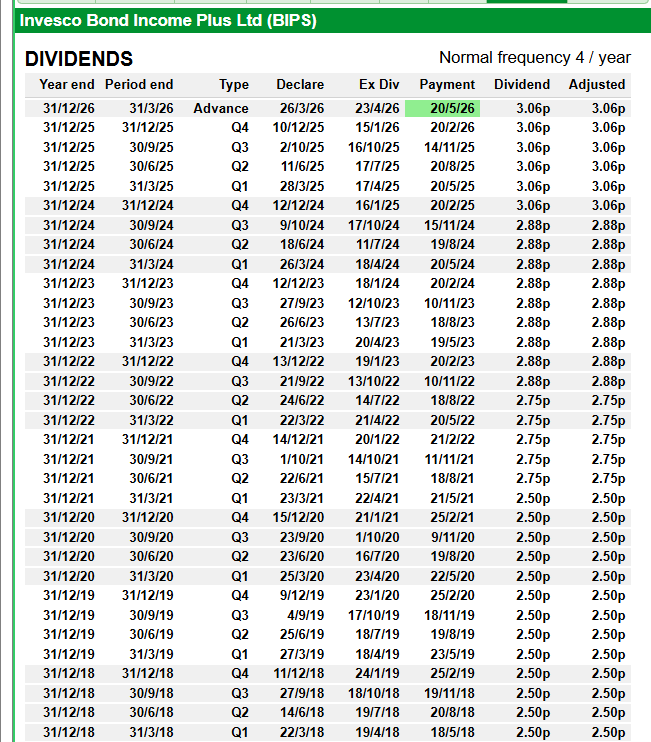
Nevertheless, BIPS has a good track record in dividends, steadily lifting the pay-out from 10p per share in 2020 to 12.25p last year, covered by earnings, or income from investments.
Davies, lead manager of the fund, is conscious that with 54% of assets in the riskiest non-investment grade corporate bonds, and a further 11% unrated, he has to be careful to strike the right balance when buying the loans of companies with stretched balance sheets or chequered credit histories.
Despite their higher risks, high yield bonds have been popular as central banks have cut interest rates and investors have sought out better levels of income. While subdued, economic growth has been strong enough to avoid a rise in corporate loan defaults. As a result, the sector has notched up nine successive positive months since last April when US President Trump unveiled his global tariffs.
Eye on inflation
After their good run, average corporate bond yields in Europe have fallen to below 6% as their price has risen. Also the “spread”, or gap, between their yields and those of benchmark government bonds have narrowed to historic lows, which is another sign, Davies said, that investors should be wary of becoming complacent as an economic setback could cause those spreads to widen and bond prices to fall.
That said, there are plenty of opportunities with loan and bond issuance remaining strong in response to investor demand. Last month Davies, who appeared on our “Income funds for your ISA” broadcast on 30 January, bought into a new 10-year bond with an attractive 8%-coupon from French sugar producer Tereos.
He said his priority was to keep an eye on inflation and maintain a low exposure to interest rate risk by focusing on shorter-dated loans and bonds of three to five years. Another surge in inflation would require central banks to raise interest rates, which would hit longer-dated debt the hardest, he explained.
Before Russia’s invasion of Ukraine in 2022, Davies said: “I didn’t have to worry about inflation. For the rest of my career I will have to.”
Like its rivals, BIPS shares have been trading at a small premium of 1.7% over the net asset value of the trust’s investments. The offer lets investors buy in at a slightly lower premium of 0.75%.
“This is a timely opportunity for investors still looking to make use of their ISA allowance, while also gaining exposure to a trust that has historically delivered regular income. Bonds remain a compelling option for those wanting a steadier income stream, even through market turbulence, and BIPS is designed to deliver that through a disciplined, diversified approach,” said Davies.
Invesco Bond Income Plus (BIPS), the £443m high yield debt fund that raised £25m from investors last month, says it is conservatively positioned for the uncertainty stemming from the Middle East as the 7%-yielder reports a steady 8.7% total return for last year and plans to hold dividends at 12.25p this year. In its 2025 results chair Tim Scholefield said BIPS’ “closed ended structure makes it well positioned to take advantage of a sell-off when good quality bonds could be available at deeply discounted prices, locking in returns for the future.”
James Carthew of QuotedData said: “It is great to see BIPS delivering returns ahead of comparative indices and expanding. It is also pleasing to see how it has navigated the twists and turns of 2026, coming into the year positioned relatively defensively. The chairman points out that as a closed-end fund, it should be better able to take advantage of any sell-off in bond prices, when open-ended funds might be forced sellers. Let’s hope it doesn’t come to that, but it is a good argument for favouring trusts over other investment structures.”
There will be 1k to re-invest in the SNOWBALL this week. I am content with all the current income projections so I can start to add some stability to the SNOWBALL by buying some bonds.
5 High‑Yield Bond Engine (Monthly) ETF s
Here are five of the strongest High‑Yield Bond “Engines” that pay monthly, drawn directly from current market data and UK‑accessible ETFs. Each one is a pure fixed‑income product with monthly coupon flow, not equity‑based covered‑call funds.
Top 5 High‑Yield Bond (Monthly) ETFs
1) Fidelity Enhanced High Yield ETF (FDHY)
Yield: ~10% total return over past year
Payout: Monthly (~$0.26–$0.27 typical)
Profile: Actively managed BB/B junk‑bond sleeve
Notes: Fee cut to 0.35% boosts net income
2) SPDR Bloomberg High Yield Bond ETF (JNK)
Yield: ~6.7% trailing
Payout: Monthly ($0.49–$0.56 typical)
Profile: Tracks Bloomberg HY Very Liquid Index
Notes: Concentrated in cyclical, comms, energy sectors
3) iShares iBoxx $ High Yield Corporate Bond ETF (HYG)
Yield: 6%+ SEC yield
Payout: Monthly
Profile: ~1,000 sub‑investment‑grade corporates
Notes: Long history of stable monthly distributions
4) iShares J.P. Morgan EM High Yield Bond ETF (EMHY)
Notes: Strong, consistent monthly distribution history
5) PIMCO US Short‑Term High Yield Corporate Bond UCITS ETF (STHY / SSHY)
Yield: ~6.9–7.0%
Payout: Monthly
Profile: Short‑duration HY bonds (lower interest‑rate sensitivity)
Notes: Available in GBP‑hedged, USD, and EUR‑hedged share classes
Quick Comparison Table (Yields & Risk Profile)
ETF
Yield
Duration
Region
Risk Level
Monthly?
FDHY
~10% TR
Medium
Global HY
Medium‑High
✔️
JNK
~6.7%
Medium
US HY
Medium
✔️
HYG
6%+
Medium
US HY
Medium
✔️
EMHY
~6.7%
Medium
EM HY
High
✔️
PIMCO STHY/SSHY
~7%
Short
US HY
Medium
✔️
Which one is the “Engine”?
If you want maximum monthly income, the hierarchy is:
FDHY → Highest income engine (active, strong yield)
PIMCO STHY/SSHY → High yield with lower duration risk
EMHY → High yield but higher EM volatility
HYG / JNK → Large, stable, core HY exposure
OR
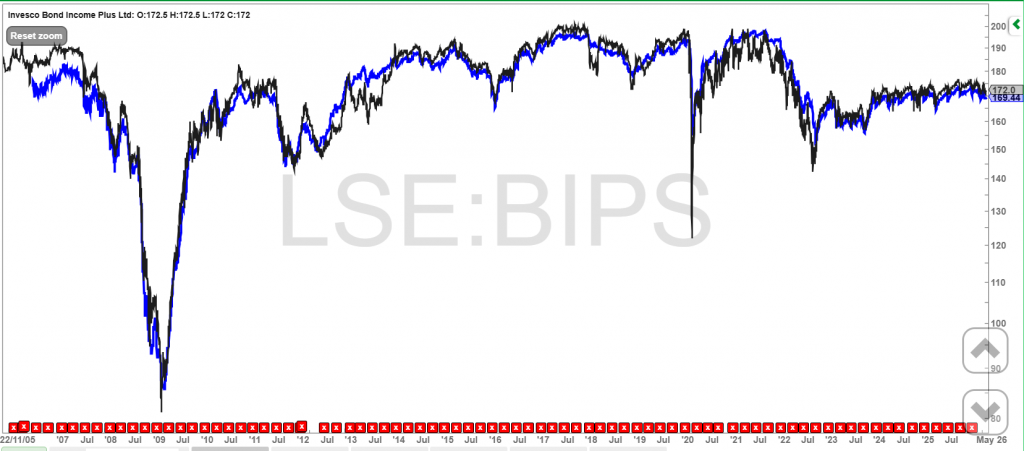
Looking at the chart, you can see that with BIPS there will be a capital drawdown in times of market stress.
Because the income is considered ‘safe’ it normally trades above its NAV.
As recently as 2020 as the price fell and the yield rose, anyone who put on their big boy/girls pants and bought would be receiving a buying yield of 11% and a running yield of 7%.
As BIPS trades above its NAV, the choice can be made between an ETF and BIPS. As the SNOWBALL is going to build a position with earned dividends, if the price fell it would be a positive and not a negative.
But not junk bonds as that is the opposite to low risk.