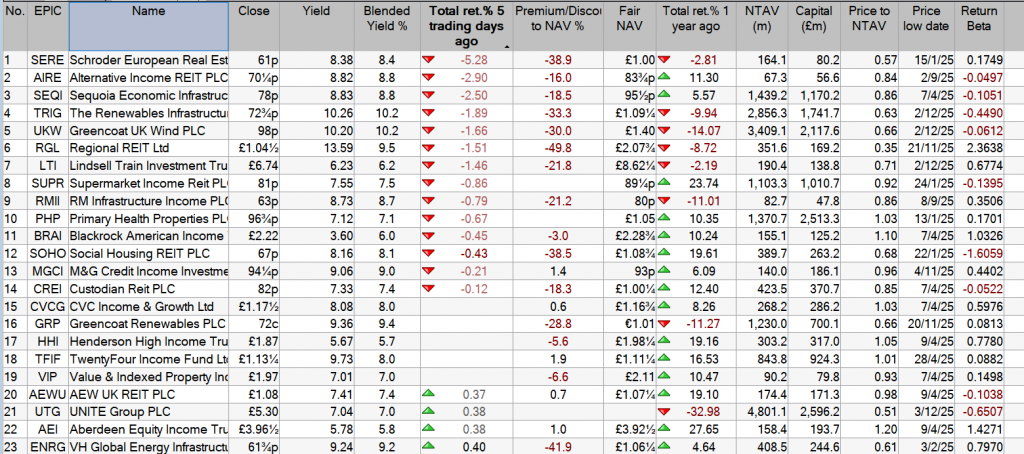
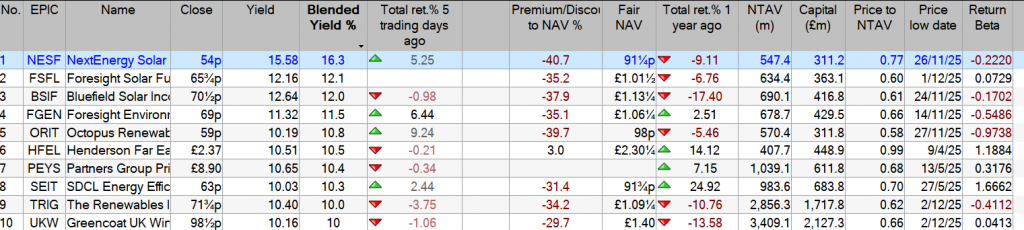
Investment Trust Dividends

Tax disclosure update: as previously announced, the Group received a notice of adjustment from the French Tax Authority amounting to c.€14.2 million, including interest and penalties. The Group maintains its position that this amount is not payable and has formally appealed the decision. This appeal, submitted as a claim to the French Tax Authority, is expected to be reviewed within a six-month period. If the claim is dismissed, the Group would escalate the matter to a formal court process, which could take up to two years to resolve. Based on professional advice, the Board has decided not to make a provision, as they do not believe that an outflow is probable. The Group will continue to monitor the situation and will provide further updates as necessary.
– Koninklijke KPN N.V. (“KPN”) has provided verbal indication that it will terminate its lease and vacate the Apeldoorn asset at the end of December 2026. The Company continues to work on solutions for the asset including re-letting to a replacement tenant or obtaining planning approval for alternative uses. As previously highlighted, KPN’s anticipated departure is expected to negatively impact the Company’s future income profile. In the event the Investment Manager is unable to fully offset the loss of income from the Apeldoorn asset, the level of future dividends or earnings cover will likely be impacted. An update regarding the Group’s strategy to maximise value from the Apeldoorn property will be provided when appropriate


Here are ten of the highest-yielding investment trusts currently available in 2025, offering strong income potential for investors seeking dividends.
🔝 Top 10 High-Yielding Investment Trusts (2025)
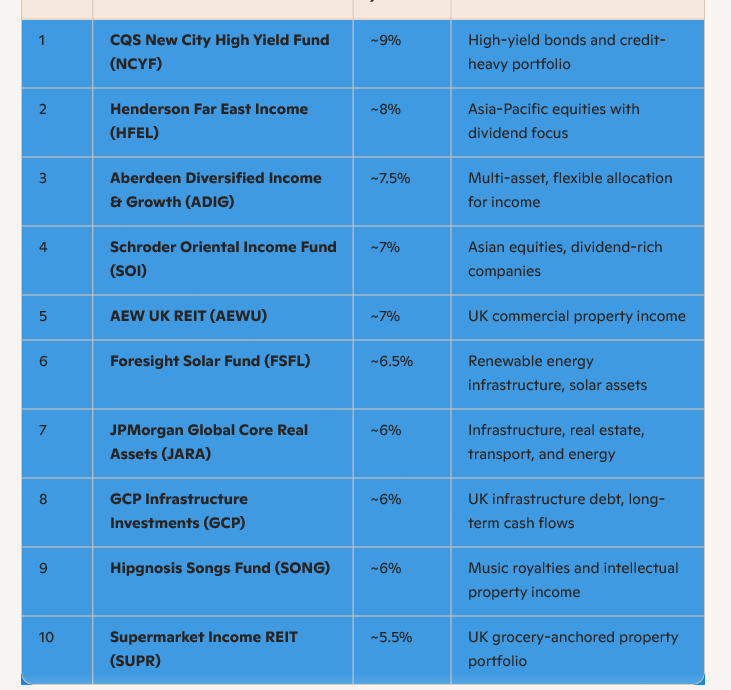
📌 Key Insights
⚠️ Risks to Consider

Given the Snowball’s fascination with cycles of resilience and decline, these high-yield trusts are perfect case studies. They embody the tension between short-term income allure and long-term sustainability. For your creative projects, you could symbolize them as “Yield Sirens”—tempting investors with high payouts but demanding vigilance against hidden risks.

AI generated information contains many errors so even more critical you DYOR.
SONG no longer quoted, double check the yields.
Price divided by the yearly dividends = yield
Example
SUPR 82p target dividend 6.1p = yield 7.5%
No dividends are 100% secure, all though some are more secure than others.
The sooner you will finish.

Are you considering using the stock market to supplement your retirement income? Our writer examines how dividend shares can help achieve those goals.
Posted by
Mark Hartley
Published 4 December

You’re reading a free article with opinions that may differ from The Motley Fool’s Premium Investing Services. Become a Motley Fool member today to get instant access to our top analyst recommendations, in-depth research, investing resources, and more.
If you’re thinking of investing in dividend shares for retirement, you’re not alone. Thousands of Britons do exactly that, with the aim of achieving a steady income stream to supplement their State Pension.
The question is, where and how to start ? Many beginner investors feel overwhelmed by the sheer number of options available. For many, a lack of clarity and understanding leads to fear of losses, and they give up.
But with careful planning, patience and commitment, the risks can be minimised and the gains optimised.
As with everything in life, picking the ideal dividend portfolio requires careful moderation. Choosing all the 10%-yielding stocks might seem logical, until half of them pause their dividends to finance debt.
Choosing all the stocks with the longest track record of payments is wiser — but the average yield might be underwhelming. Anything below 4% is barely outpacing a standard savings account.
A smarter option would be to mix some high-yielders with some reliable dividend heroes — those with decades-long track records. An average yield of 7% is realistic, requiring £285,700 to pay out £20,000 a year in passive income.
A 40-year-old investing £300 a month could reach that amount by age 65 (with dividends reinvested).
A typical investment portfolio includes between 10-20 stocks from a diverse range of sectors and regions. When it comes to dividends, some of the most popular sectors are finance, utilities, real estate, energy and consumer staples.
Here are two diverse UK dividend shares to consider, each complementing a retirement portfolio in their own way.
Legal & General (LSE: LGEN) has long been a top choice for UK retirement portfolios, offering a combination of high yield and structural appeal. The company operates in life insurance, pensions and asset management — sectors directly tied to retirement savings and long-term demographic trends like population ageing.
The key attraction, of course, is its predictable, dividend-focused cash generation. With a business model that centres around pension risk transfer and workplace retirement solutions, it enjoys recurring revenue streams largely insulated from short-term economic cycles. This close relationship with retirement planning makes it a natural fit for income-focused investors to consider.
The combination of high yield (9%+) and reliable track record make it a rare find — but it’s still at risk from interest rate sensitivity. As an insurance and annuities company, its profitability and solvency are heavily dependent on interest rate movements.
By contrast, National Grid offers a much smaller yield but benefits from more defensive, inflation-linked income. As a regulated electricity and gas supplier, its earnings are set on a multi-year basis. This gives it long-term visibility over cash flows, supporting a dividend policy that grows in line with UK inflation.
When selecting dividend shares, consider balancing yield with sustainability, as higher yields can reflect market concerns about dividend safety. Diversifying across multiple dividend sectors helps manage risk while maintaining steady income streams.
The above options are just two examples of how yield and sustainability can be balanced. There’s a host of similarly attractive UK dividend shares to choose from on the FTSE 100 and FTSE 250. One of the hardest steps is getting started – after that it just requires committed monthly contributions and a big dollop of patience.

VPC Specialty Lending Investments PLC
(the “Company”)
DIVIDEND DECLARATION
The Board of Directors of the Company has declared an interim dividend of 1.44 pence per share in respect of the period to 31 December 2024. The dividend will be paid on 31 December 2025 to shareholders on the register as at 12 December 2025. The ex-dividend date is 11 December 2025. This distribution is necessary to make sufficient distributions so that no corporation tax liability will arise in the Company as noted in the Company’s 2024 Annual Report and Accounts.
The next dividend declaration is likely to be announced in February 2026, then every year thereafter. The dividends will not be less than 85% of net revenue return of the period distributed, as previously disclosed.
The Company has elected to designate all of the interim dividend as an interest distribution to its shareholders, thereby “streaming” income from interest-bearing investments into dividends that will be taxed in the hands of shareholders as interest income. No income tax will therefore be deducted at source from this, or from future interest distributions.

The Snowball has a position in VPC and will be sold when the balance of cash is returned, the next date is February.
The sale will be at a loss, even allowing for the income earned on £5,345 of re-invested dividends but an un-expected dividend of £180 to be added to the total.


If I could just advise you of just one nugget of investing wisdom today, it would be to NEVER overlook the incredible wealth-building power of dividends.
Few investors realize how important these unglamorous workhorses actually are.
Here’s a perfect example…
If you put $1,000 in the dividend-paying stocks of the S&P 500 back in 1973, you would have had $96,970 by 2023, or 97x your money.
But the same $1,000 in the non-dividend payers would have grown to just $8,990 — 91% less.
That’s why I’m a dividend fan.
The stock market is a fantastic wealth-building machine, but it doesn’t always go straight up!
There have been plenty of 10-year periods where the only money investors made was in dividends.
And that’s what gives us dividend investors such an edge.
When you lock in an 8%+ yield, you’re booking an income stream that’s bigger than the stock market’s long-term average return right off the bat.
Of course you can’t just buy every ticker symbol out there with a flashy yield, or you’ll get burned pretty fast.
So let’s wipe the false promises of mainstream finance from our minds and start thinking the “No Withdrawal” way…

I’ve bought for the Snowball 13680 shares in NewRiver REIT plc for 10k.
Current yield 8.9% NTAV £485.6 Capital £311.9m
NewRiver REIT plc
(“NewRiver” or the “Company”)
Dividend Declaration
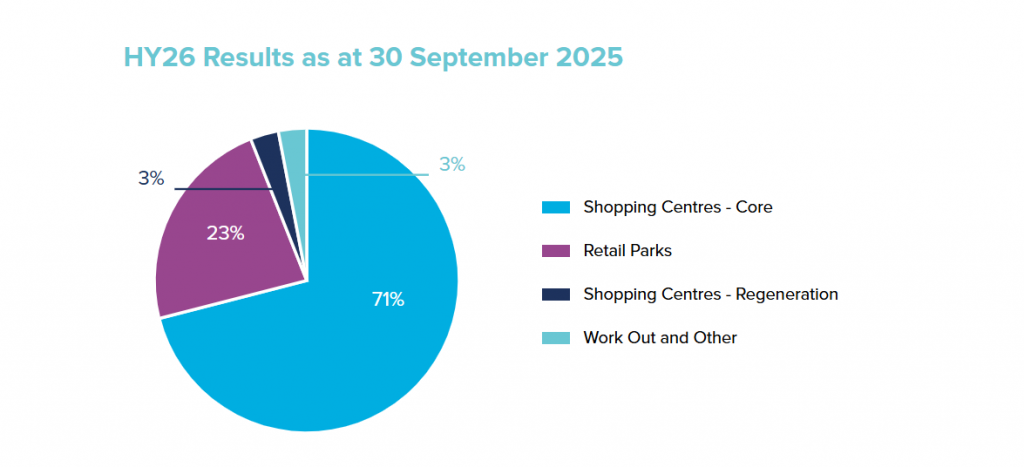
As announced on 2 December 2025, the NewRiver Board has declared an interim dividend of 3.1 pence per share in respect of the six months ended 30 September 2025. This dividend will be paid as a Property Income Distribution (PID).
The dividend payment date will be 30 January 2026 and the dividend will be paid to shareholders on the register at close of business on 12 December 2025. The ex-dividend date will be 11 December 2025.
Shareholders can receive additional new ordinary shares in the Company instead of their cash dividend, with no dealing charges or stamp duty incurred, under the Company’s scrip dividend scheme. To receive the scrip dividend, shareholders need to make an election ahead of the dividend election date on 9 January 2026.
As NRR only pays a dividend twice a year, the dividend for the Snowball will be £424.00

I’ve sold the recent purchase of ENRG for a profit of £158.00.
The current profit on the recent sells is £1,370.00, although the Snowball’s Raison d’être is only to earn dividends to reinvest to earn more dividends, I am risking the current profit to provide an approximate buffer of 1k for the 2026 Snowball.
Current earned dividends for January £539.00
I intend to re-invest the funds to earn another dividend for next year.


Earlier this year, BlackRock American Income (BRAI) announced a radical shake up. It asked shareholders to approve a new investment objective and policy, announced a new enhanced dividend policy, cut management fees drastically, and offered shareholders a 20% tender at a 2% discount to NAV (after costs).
The proposals were welcomed by investors, with more than 99% of those voting giving their approval. The tender offer was undersubscribed, with just 16.15% of BRAI’s shares validly tendered.
In its new form, the trust is following an investment approach distinct from any other investment company listed in the UK – investing using a systematic active equity approach devised by BlackRock (which uses data-driven insights to identify and take advantage of mispriced stocks). This note seeks to explain BRAI’s new approach and the corporate structure that supports that. Whilst we have included some historical performance data for reference in the charts on this page, further analysis of it feels redundant. Instead, we have focused on BRAI’s returns since the strategy change.
The portfolio continues to focus on income and capital growth from US value stocks, offering diversification for investors mainly exposed to large US tech stocks. There has been a major change in how investments are chosen, detailed further below.
BRAI aims to provide long-term capital growth, whilst paying an attractive level of income (1.5% of NAV per quarter, around 6% of NAV per annum). BRAI follows a systematic active equity approach that aims to provide consistent outperformance of the Russell 1000 Value Index (the benchmark).
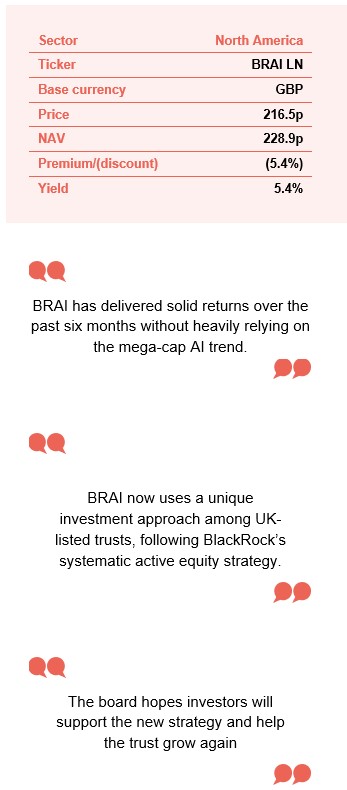
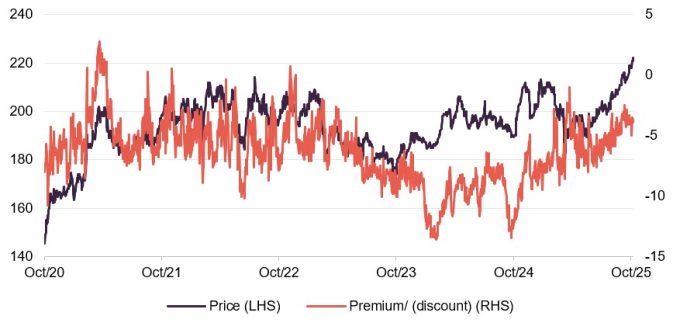
Over the 12 months to 31 October 2025, BRAI’s shares traded at a discount to NAV ranging from 11.9% to 1.0%, averaging 6.3%. As of 26 November 2025, the discount stood at 5.4%.
The discount increased during 2023 as markets were led by the Magnificent Seven and value stocks lagged. BRAI’s rating started to recover in October, helped by the expected tender offer, and is now at a more reasonable level. The board hopes investors will support the new strategy and help the trust grow again.
Source: Bloomberg, Marten & Co
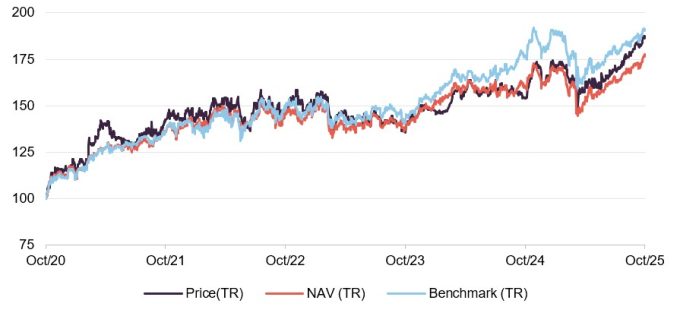
As mentioned earlier, we do not consider BRAI’s returns before the strategy change relevant, however the graph here shows BRAI’s share price and NAV performance compared to its benchmark over the past five years. Figure 7 on page 9 illustrates BRAI’s strong start, regularly outperforming its objective. The S&P 500’s gains have been driven by a few large AI-related companies, while BRAI’s benchmark is more diversified. Notably, BRAI has delivered solid returns over the past six months without heavily relying on the mega-cap AI trend.
Source: Bloomberg, Marten & Co
More information is available on the trust’s website
Data-derived insights to spot mispriced stocks
BlackRock’s Systematic Active Equity (SAE) team uses data-driven insights to identify and take advantage of mispriced stocks. By September 2025, BlackRock managed over $313bn with this strategy across a range of global and regional portfolios, including long-only, partial short, hedge funds, and a London-listed investment company – the first of its kind. The SAE team has over 100 investment professionals in San Francisco and London, drawing on more than 40 years of experience in active investment management. While BRAI’s investment universe is no longer limited by ESG criteria, ESG analysis remains part of the research process.
BRAI’s universe is no longer constrained by ESG criteria
The SAE team is constantly innovating to improve results for investors. While quant-driven strategies have existed for years, managers now have access to much more data. Their role is to decide which information is useful, when to use it, how different datasets work together or during specific economic periods, and how much weight to give each insight when making investment decisions.
Few asset managers have the scale to succeed in this area
The SAE team was an early adopter of AI and machine learning
Processing this information requires significant computing power, which only a few asset managers can access at scale. The managers note that while early fundamental value data was structured and easy to analyse, most current datasets are unstructured text. The SAE team adopted AI and machine learning early to interpret this data effectively.
Beyond traditional company analysis, the SAE team uses hundreds of independent data sets, such as analyst reports, news articles, online search trends, transaction volumes, footfall, and app usage. On average, they assess 10 new data sets each month. Macroeconomic indicators are also included, using “now-casting” to gauge the economy’s current state.
Insights are thoroughly tested for their ability to predict company fundamentals and returns, with tools that can run a five-year back test in under two seconds. Managers retain final decision-making, and may delay trades during major market shocks.
The SAE approach leads to higher portfolio turnover (about 100%–200% per year), but trading costs are considered in every decision. Many trades are matched within BlackRock, helping to keep transaction costs down.

The analysis covers:
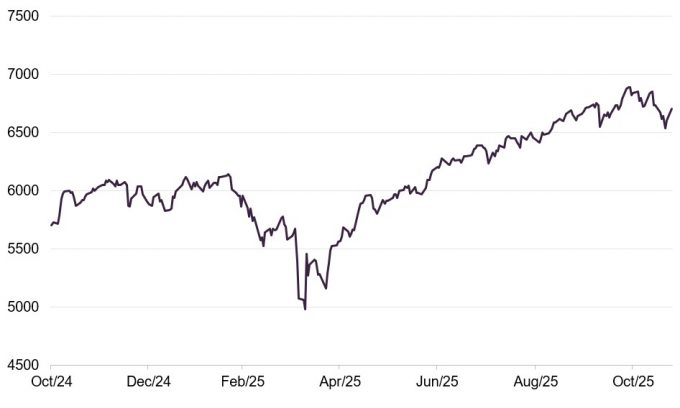
Markets have recovered from the selloff associated with Liberation Day
President Trump’s policy agenda, especially his tariff policy, has had a major impact on global markets. After quickly imposing tariffs on imports from Canada and Mexico, the key moment came on “Liberation Day” (2 April 2025) when tariffs were announced on almost all imports. Markets reacted negatively, prompting a temporary reduction of most tariffs to 10%. This led to a market recovery, helped by announcements of various trade deals, though not all are finalised, which encouraged a return to risk-taking.
The AI investment boom, which started in March 2023 with ChatGPT-4, faced its first major challenge in January 2025 when DeepSeek claimed to have developed a new large language model at much lower cost than US rivals. This caused a sharp sell-off in the Magnificent Seven tech stocks, with money moving into other US stocks and overseas markets. These large US tech companies were also affected by the Liberation Day market falls. Despite this, investment in AI infrastructure continued strongly, helping to restore confidence.
Today, US mega-cap tech stocks once again lead the S&P 500. For investors who want US exposure but prefer not to concentrate too heavily on these giants, BRAI offers useful diversification.
BRAI offers a way of diversifying US exposure away from the Mag 7
Source: Bloomberg
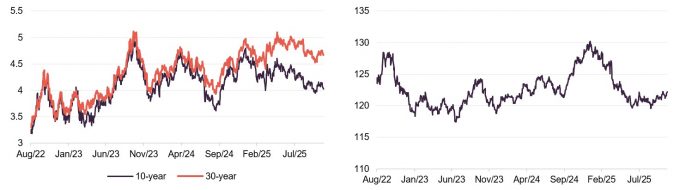
The US president has pushed for lower interest rates, but the Federal Reserve has resisted, citing worries about inflation from tariffs. Threats to dismiss Fed board members and its chair could hurt confidence in US bonds. US inflation has been rising anyway.
Debt investors are also worried about the long-term impact of the One Big Beautiful Bill (OBBB), which is expected to add trillions to the US deficit. If government borrowing costs also rise, this could cause further issues.
Source: Bloomberg
Source: Bloomberg
These concerns have likely weakened the US dollar, which has dropped sharply from its February peak on a trade-weighted basis. The decline could continue if investors move more money out of US assets.
Source: Bloomberg (based on MSCI US value and growth total retu
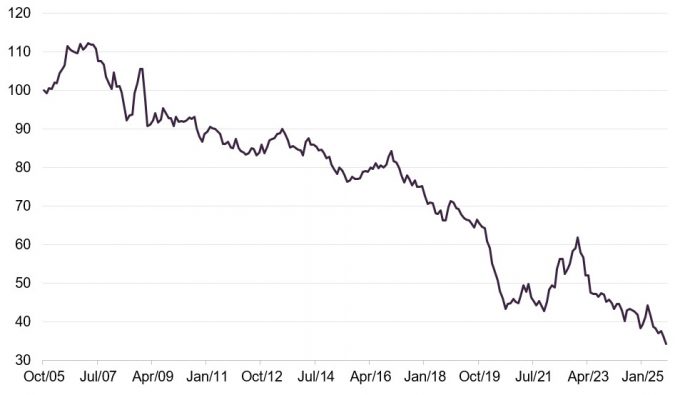
For BRAI, the key issue is how value stocks perform compared to growth stocks. As Figure 4 shows, value stocks have lagged behind growth stocks over the past 20 years, mainly due to the long period of low US interest rates after the 2008 financial crisis.
In late 2021, expectations of rising interest rates sparked a rally in value stocks, but this peaked at the end of 2022. Since then, growth stocks have outperformed again, driven largely by the success of AI. Another potential value rally was cut short by Liberation Day.
The managers note that unpredictable US policy changes make their job more challenging but also create unusual investor behaviour, leading to more mispriced stocks.

© 2026 Passive Income Live
Theme by Anders Noren — Up ↑