
I’ve sold the recent purchase in PHP for a tiny profit after all charges, as it’s a very dangerous market to make any new purchases and it frees up funds for a possible purchase in SUPR.

Investment Trust Dividends
I’ve sold the recent purchase in PHP for a tiny profit after all charges, as it’s a very dangerous market to make any new purchases and it frees up funds for a possible purchase in SUPR.

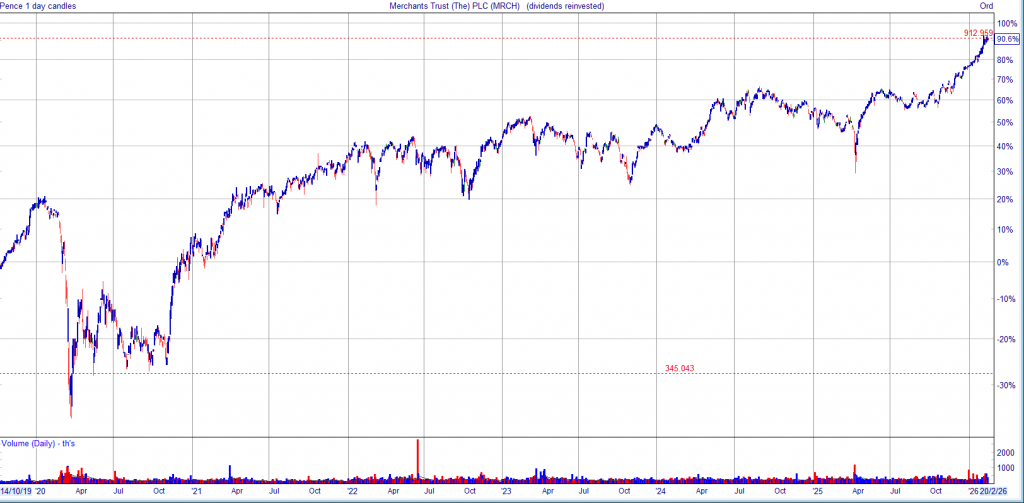
I want to add MRCH to the SNOWBALL, for the yield and an above average chance to achieve the holy grail of investing, in time.
I have posted the chart up to the end of Feb and for illustrative purposes only the dividend is re-invested, where for the SNOWBALL as the price rose and the yield fell it would have been re-invested in in a higher yielder.
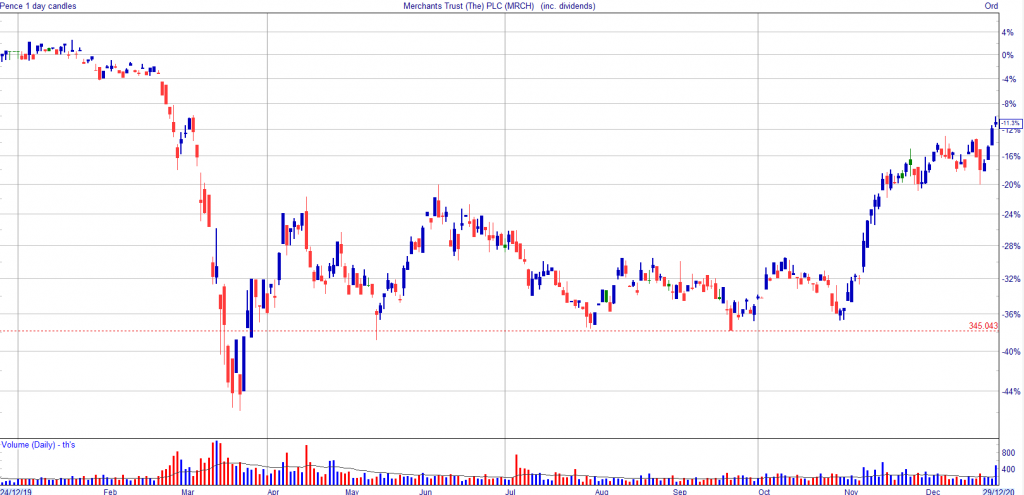
Back to the covid crash, interesting to note ‘support’ in action, where for whatever reason the share is bought when it falls to a certain level.
If you had bought it took over six months to breakout, so with the benefit of hindsight, there was no hurry to buy but a great share for re-investing the earned dividends, for the day when it does break out.

It’s always easier with hindsight, the regret would be that you never got a position and the patience needed as you wait for the price to rise. If the price continued to fall you could buy more shares with your dividends, if it went sideways, you could add more shares around your current price level. If it never went up, unlikely but you would have cash to pay your bills.

Hopefully, if the oil price stays high but not for too long, I will be able to build a position. I haven’t got anything I would like to sell at the present time because the fcasted dividends mean I will beat the fcast and dividends are always the only deciding factor.
GL
As the price falls so the yield rises, now around 6%.
CHAIRMAN’S STATEMENT
Performance.
2025 was a positive year of investment performance for Henderson High Income Trust . The Company’s Net Asset Value (NAV) total return was +20.4% which was broadly in line with the benchmark return of +20.6%. The
share price total return was a little higher at +22.6% as the discount at which the share price traded to underlying NAV narrowed a little during the year, ending the period at 5.7%.
The UK equity market was one of the best performing markets globally in 2025, helped by attractive valuations and corporate activity, although smaller and medium sized companies struggled somewhat versus larger stocks.
This strong market backdrop helped underpin equity returns despite a year characterised by ongoing volatility in financial markets, a pattern established since the arrival of President Trump in the White House. The threat of
tariffs on US trading partners and geopolitical turmoil, offset more positively by the easing of inflation provided a volatile mix but the efforts of global policy makers to start to reduce interest rates helped support equity markets
particularly. Strong ongoing corporate profitability stood in sharp contrast to pressure on government finances, especially in the UK where the corporate sector has been in the firing line of increased taxation to help fund
higher public spending.
Overall, during 2025 the Company’s investment performance was broadly in line with the benchmark return.
Gearing and asset allocation.
Wth the portfolio continuing to favour equities over bonds, were positive relative
influences but this was offset by a negative contribution from equity stock selection in the second half of the year.
Dividends
The Company’s investment objective remains the same, to provide investors with a high dividend income stream while also maintaining the prospect of capital growth. In 2025 company dividends continued to be healthy with
quoted companies delivering good levels of ongoing profitability in spite of the uncertain economic backdrop. It was again pleasing to see that the Company’s overall earnings during the year were sufficient to cover the full year dividend enabling a small amount to be added to revenue reserves.
During 2025 the Board recommended the payment of dividends totalling 10.9 pence per share, an increase of 2.8% over the payment in 2024. This was the 13th consecutive year of dividend growth from the Company.
The Board focuses carefully throughout the year on the revenue projections provided by the Fund Manager and itremains confident that the Company will be able to continue to generate a high level of income for shareholders.


25 March 2026
While volatility can feel unsettling, it is a normal part of investing.
By Jonathan Jones
Editor, Trustnet
Patience beats prediction when markets are volatile, according to experts at Vanguard, who have reminded investors that staying invested brings better results than trying to time the market.
The firm highlighted volatility last year surrounding US president Donald Trump’s ‘Liberation Day’ tariffs as an example. Had investors sold out of their investments on 8 April 2025 and returned to markets one month later, their returns would have been 10 percentage points lower today than if they had remained invested throughout (14.4% versus 4.8%).
James Norton, head of retirement & investments at Vanguard Europe, said: “Investing is a marathon not a sprint.
“While volatility can feel unsettling, it is a normal part of investing. Successful investing isn’t about trying to time when to buy or sell, but about having a clear plan, staying invested and contributing regularly. By doing so and maintaining a balanced, diversified portfolio investors give themselves the best chance of investment success and meeting their long-term goals.”
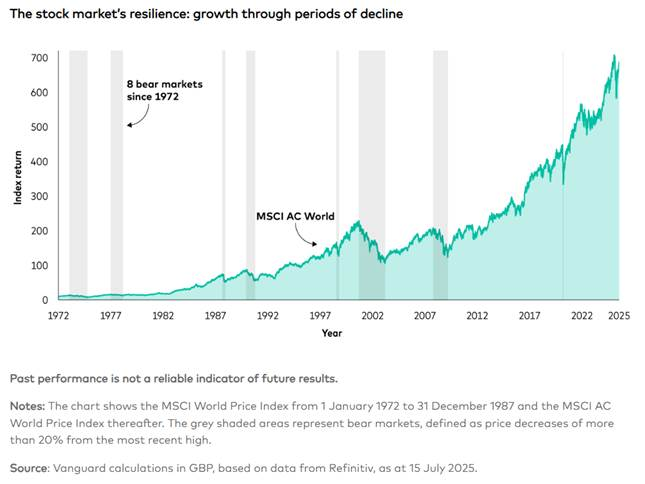
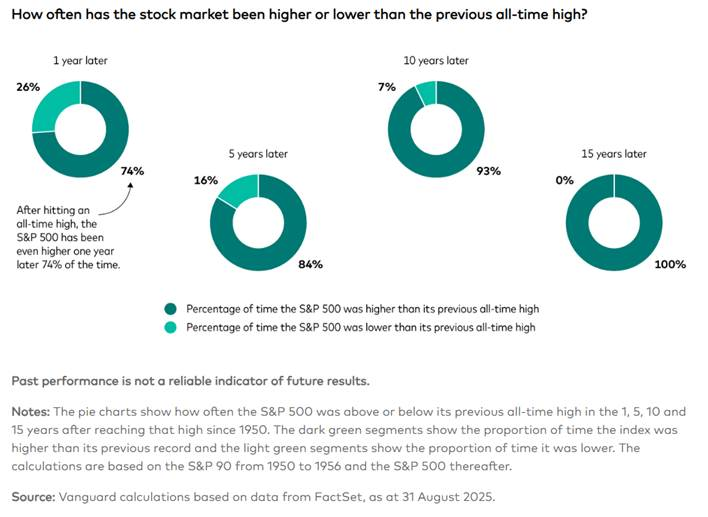
The research noted that the MSCI World index has experienced eight bear markets since 1972, each time recovering and then pushing to new heights, as the below chart shows.
Diversification also matters, however. US tech stocks have dominated returns in recent years but in 2025 a globally diversified portfolio would have made better returns. The report noted that the UK and emerging markets were up 23% versus 11% for the S&P 500.
Lastly, the firm said investors should not fear market highs, noting they are often followed by new records.
“You may feel uneasy when markets are rallying but history shows that markets often go on to reach more highs,” the report found.
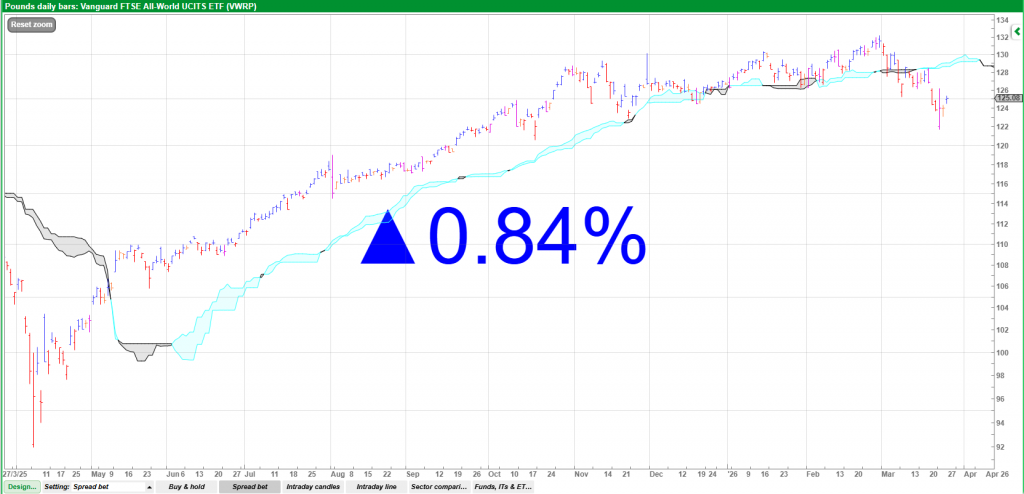
The SNOWBALL’S comparator share, hasn’t added any cash to your retirement fund in six months. Nonetheless it’s been a great period of out performance.
Mar 25, 2026

Dear reader,
As previously discussed the overall narrative for Regional REIT ticker RGL’s 2025 is one of strategic repositioning: The company aggressively sold assets to lower debt and is now shifting toward a “Capex-led” growth strategy to upgrade its remaining portfolio.
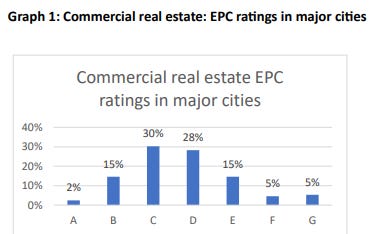
MEES is Minimum Energy Efficiency Standard regulations which forces UK landlords to meet EPC standards.
RGL’s Focus: 84.4% of RGL’s portfolio is now rated EPC C or better, with 60% at EPC B or better. This is a critical metric as net zero environmental regulations tighten for UK commercial landlords.
Is the market giving even £1 of credit to that? Nope.
Since 2023, it has been unlawful for a landlord to continue letting a commercial property with an EPC rating of F or G. Any business (from a local law firm to a global tech giant) can technically contract an office that is EPC E, D, or C, on the understanding that one day they’ll need to move out or face a building refurb.
While this is not yet set in stone we all know the current government are determined to drive forward energy reductions so the MEES “target” whilst not legislatively set in stone and besides common sense for buyers too:
Yes, a future alternative government might overturn this legislation and Labour might delay on this but a higher EPC equals a lower cost, typically.
So yes, 53% of landlords might stump up the cash in the next 21 months to get to EPC C to avoid becoming non-compliant, but then again they might not. After all they probably face the same difficult market that RGL has faced, don’t you think?
If RGL loses 50%-80% of competition then that places it in a very strong position.
EPC D or below properties probably excludes them from increasing numbers of office renters. Haven’t you spotted how energy bills are going up in 2026? A lot.
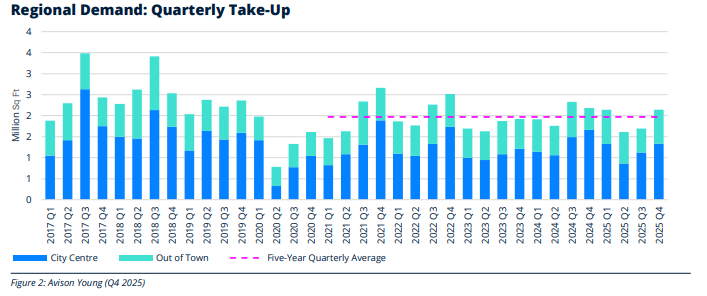
RGL tell us that “Demand for quality office space has put an upward pressure on rents, with growth of 4.8% recorded across the Big Nine regional markets in 2025. According to research from Avison Young, average headline rents are now approximately £40.72 per sq. ft.”
Wow! £40.72 is quite a bit higher than RGL’s average of £14.20 per sq. ft. isn’t it?
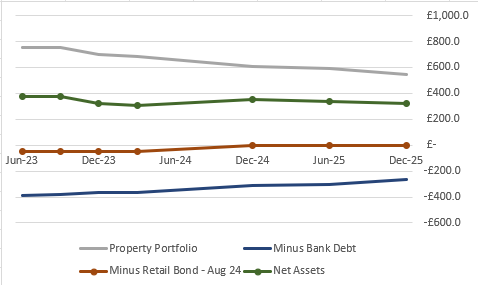
Interesting to see RGL’s NAV (in green) is flat over the past two years but the debt is much reduced (blue and red lines), along with a reduced property portfolio (grey). There’s zero recognition for this achievement in the share price. It is priced based on a cliff edge of debt that isn’t there today.

Does that mean lower rentals in 2026? Possible but not necessarily.
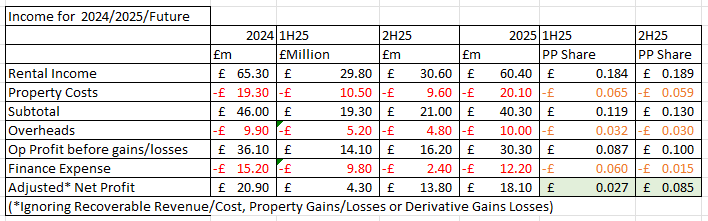
Interesting to see rental income accelerated in 2H25: Operating profit equated to 8.7p in 1H25 and 10p in 2H25, thanks to higher rental income, lower property costs and overheads.
This 1Q26 RICS survey shows offices in blue where demand is rising and availability is falling.
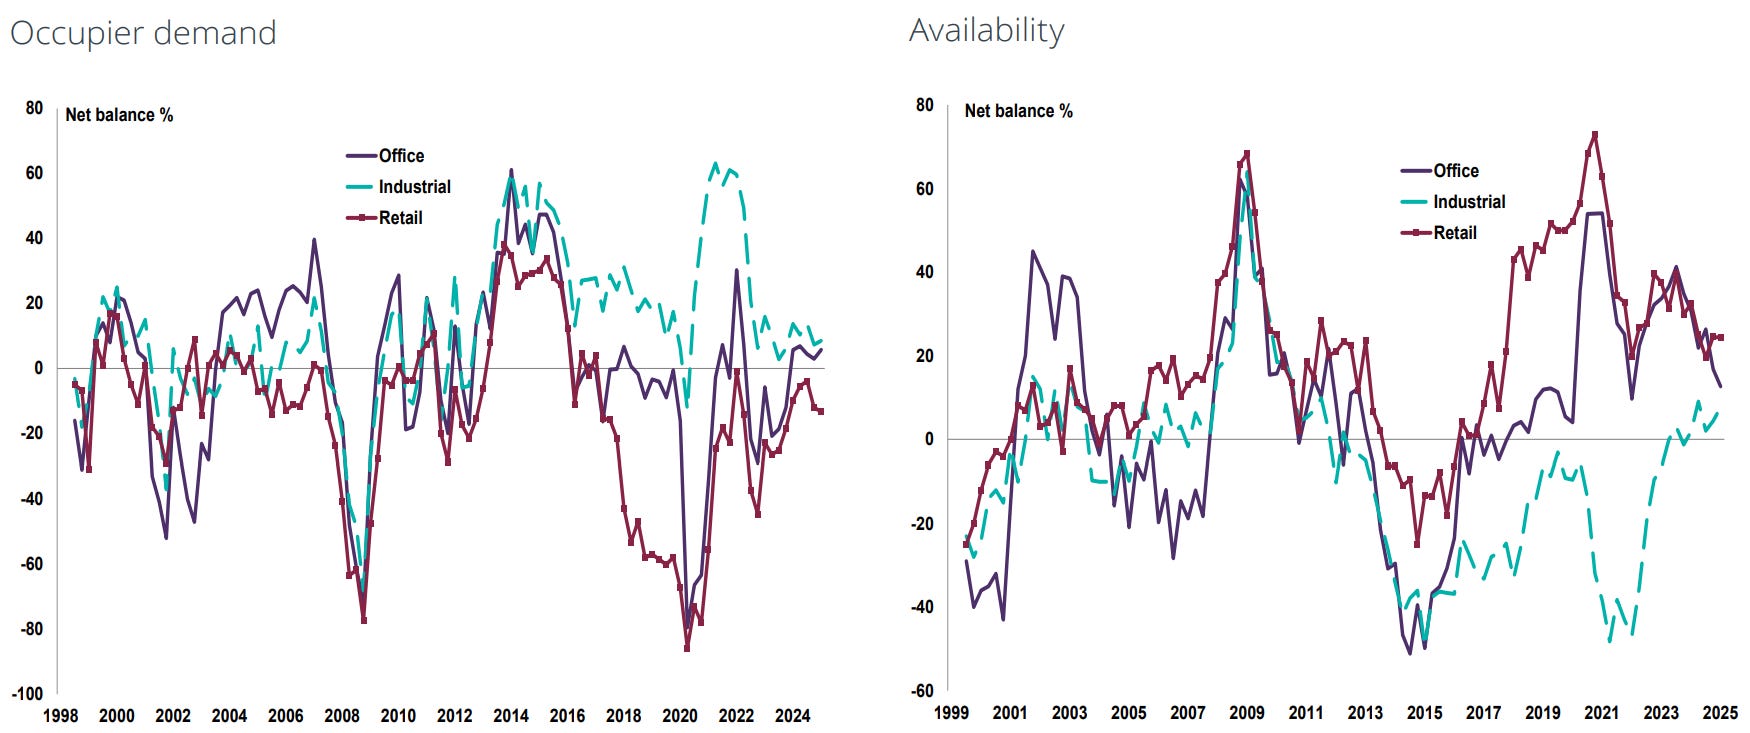
The RICS finding is mirrored when you considered the forward pipeline of new office builds is pitiful. The Building Safety Act and various onerous planning costs as well as still-high interest rates and finance costs make new builds deeply unattractive.
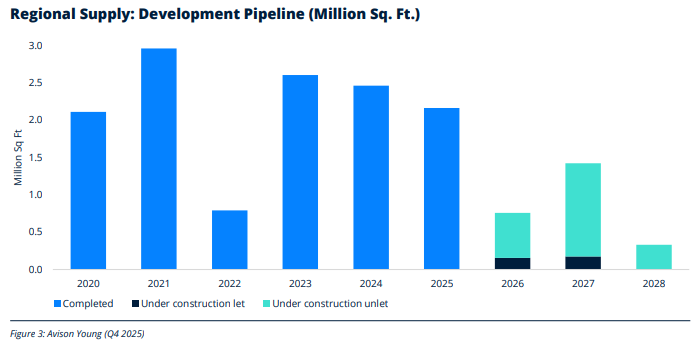
This constrained supply is smashing into a fairly steady 2m Sq.Ft of demand. Moreover the Business Rates revaluation is likely to drive more businesses outside the M25 – and into the waiting arms of RGL.
Build costs are simply too high to justify adding supply at current prices.

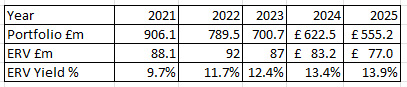
In fact what clearer evidence is there than post period lettings are averaging 17% above ERV (estimated rental value). Does that not make you slightly say Wow? Extrapolating that percentage to the £77m ERV gets you to a £90m per annum ERV. Compared with a £148m market cap?

The ERV as I’ve previously reported has been increasing and hit 13.9% in 2025. The 17% above i.e. £90m would take this to a 16.2% yield.
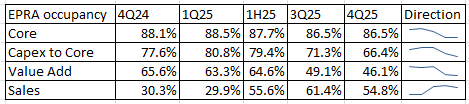
RGL isn’t yet achieving £77m ERV, let alone £90m, but its trajectory is inching towards there. 62.9% of the portfolio were core in 4Q25 up from 58.4% in 1H25, so while the EPRA occupancy is “static” the proportion that fall under the 86.5% occupancy is increasing.
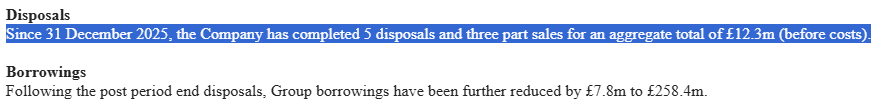
Think this in addition to the new rentals on average 17% above ERV tells you what you need to know post period: Disposals continue ABOVE book value.

There are £12.3m disposals post period, reducing debt by £7.8m so “another £50m” reduction is on target pro rata.
I didn’t really expect the annual report to throw up lots of further insights beyond those already shared in the trading update. The presentation should add further insights but even just the annual report shows RGL is well positioned in the market and probably at a low point so despite a weak share price YTD this is – in my opinion – an owner of interesting and increasingly valuable assets.
Regards
The Oak Bloke
Disclaimers:
This is not advice – you make your own investment decisions.
Micro cap and Nano cap holdings including REITs might have a higher risk and higher volatility than companies that are traditionally defined as “blue chip”.

The SNOWBALL currently has £1,963 of cash xd and £428 of cash to be re-invested, most probably depending on Mr. Market, in a new position.


The world is facing what could be yet another ‘unprecedented’ crisis. It’s hard for anyone to focus on more than one potentially catastrophic event at a time, so for the moment, investors have stopped worrying about AI and turned their eyes to the war in the Middle East.
But the appearance of a bigger problem does not necessarily make the smaller one disappear. Software stocks still risk being wiped out by AI, and investors are legitimately concerned about what that means for private debt and the trusts associated with it.
The industry has grown rapidly in recent years and has lent significant sums to software companies. Because private debt houses lend to unlisted companies, we do not have visibility on how the underlying loans are faring. What we do know is that some private debt funds had to limit redemptions because too many investors wanted to pull their money out.
Enter, debt investment trusts. As charts suggests, investors in the sector have become somewhat jumpy. Earlier this month, both CVC Income & Growth (CVCG) and M&G Credit Income (MGCI) made announcements to quell investor worry, highlighting, among other things, that their exposure to software companies was only 3 per cent and 2 per cent, respectively.
So, nothing to worry about? Well, it depends on who you ask, and there are a lot of moving parts. There are three debt trust sectors to look at: loans & bonds (where CVC and M&G sit), direct lending, and the marvellously complicated world of structured finance.

The first comprises, as you’d expect, trusts that invest in a range of loans and bonds, with a focus on listed exposure – although this varies. CVC, for example, says that about 98 per cent of the loans and bonds in its portfolio are priced daily. Invesco Bond Income Plus (BIPS), the biggest in the sector, tends to focus on high-yield corporate bonds.
Loans in the sector tend to be floating rather than fixed-rate and thus are not as sensitive to rising interest rates. And, to return to the Middle East briefly, QuotedData’s James Carthew argues that the main concern for investors should be if prolonged war hits the global economy enough that default rates start ticking up.
He says he’s a little “wary” of CVC for this reason – the trust tends to invest in lower-quality credit, relying on the managers’ ability to spot situations where the credit profile is likely to improve. This has historically worked very well but could get tricky if there is a recession. Following a similar thought process, Killik & Co’s Mick Gilligan likes M&G Credit Income, given the bulk of its holdings are “investment grade quality”, so the risk of the “spread widening” and values falling is lower.
The direct lending trust sector makes direct and private loans, but most trusts here are winding down. Both Carthew and Gilligan like the one survivor, BioPharma Credit (BPCR), with Gilligan explaining that it makes “secured loans to life science companies with proven drugs” and so is not exposed to software and is less economically sensitive.
It’s when we get to structured finance that things get a little iffy, and specifically, a part of the asset class known as collateralised loan obligations (CLOs). These are pools of low-rated loans that investors can buy in tranches with different risk levels. Incidentally, CVC has some CLOs exposure, too.
As at the end of February, TwentyFour Income Fund (TFIF), the biggest trust in the AIC structured finance sector, had 46 per cent of its portfolio in CLOs. Gilligan says some concern is warranted because there is no visibility on what these investments actually are. He adds: “Although it is not possible to tell how much of this CLO exposure is directly related to software, I understand that several BBB CLOs have been marked down into the end of February due to spread widening, initially driven by a sell-off in software.”
Fair Oaks Income 2021 (FAIR), by far the highest-yielding trust in the sector, invests in a mix of CLOs and subordinated debt, arguably making it even more exposed to defaults. The trust has recently announced that it will cut its dividend, as it has been gradually reducing risk in the portfolio.
The impact of the war in Iran remains the main focus for investors, and rightly so. But developments in the private debt-software-AI triangle are definitely worth keeping an eye on, too.
By Val Cipriani, funds editor at Investors’ Chronicle


Published on March 24, 2026
by John Baron
Iam sometimes asked why the portfolios, in pursuing their individual remits, remain invested across the various asset classes – particularly when I am cautious on markets, and the portfolios are underweight equities relative to corresponding benchmarks. Why not maintain higher cash balances? Other related questions refer to the portfolios’ higher yields relative to benchmarks. The answers are multi-layered, but a key factor is one which is often underestimated by investors – the magic of compounding. This was allegedly described by Einstein as the eighth wonder of world. It is perhaps more relevant than ever given the current geopolitical and economic challenges, and volatile markets.
Compounding is the regular reinvesting of dividends with the effect of creating higher total returns (capital gains/losses, plus income) over time. The policy of reinvesting dividends to buy more shares, which themselves pay dividends, and then reinvesting those, and so on, significantly increases portfolio returns. Finding and reinvesting dividends is a key determinant of growing wealth over time and is less problematic than short-term trades in the hope of enhancing capital gains. To fully harvest these dividends, investors need to stay invested – another reason why time in the market is better than market timing.
The extent in the difference in total returns is worth highlighting. Legendary investor Jeremy Siegel highlighted in his 2005 book The Future for Investors, that over the previous 130 years, 97 per cent of the total returns from stocks came from reinvested dividends. He suggested $1,000 invested in 1871 would have been worth $243,386 by 2003, but the figure rises to nearly $8mn had dividends been reinvested.

A shorter timeframe is perhaps more helpful. Research suggests $10,000 invested in an S&P 500 index fund in 1960 would be worth just over $1mn by 2025 by capital growth alone, but this would have increased to over $6.4mn had dividends been reinvested – more than six times higher.
For compounding to work its magic, time and a good rate of return are required. The earlier an investor can start investing, the greater the compounding effect. By its nature, the magic works best towards the end of a decent period, when funds have accumulated. It is also important that a portfolio’s asset allocation and risk profile are adjusted as an investment journey progresses towards its financial objective. However, in general, an investor should if able start early, avoid being buffeted by market noise and remain invested, keep investment costs low and refrain from spending their portfolio dividends – so as not to interrupt the magic of compounding. They will then usually be surprised at how well they’ve done.
Investors may also be surprised at how well the investment style of their equity holdings has performed. If it is right that stagflation is now upon us, it is worth remembering that history suggests low growth combined with higher and more volatile inflation usually favours value stocks. These tend to include the well-managed and financially sound income stocks increasingly sought by fund managers. After the Alice-in-Wonderland world of quantitative easing and artificially low interest rates distorted both reality and asset prices, which in turn favoured growth stocks, value has once again regained its crown. Dividends are back in fashion and for good reason – in an unpredictable world, they should also offer some solace.
While never complacent, adherence to this wonder has helped the two portfolios covered in this column outperform their benchmarks since their introduction in 2009. Indeed, it is an approach we adopt when sharing with members how we manage all 10 live investment trust portfolios on the website www.johnbaronportfolios.co.uk. They achieve a range of investment strategies and income levels – this range ensures there is a portfolio for most investors, from those first investing to those approaching a financial goal. The holdings below are held in the 10 portfolios and offer some good yields. They cover a range of sectors, including equities, corporate bonds, renewable energy, commodities, specialist lending and commercial property.
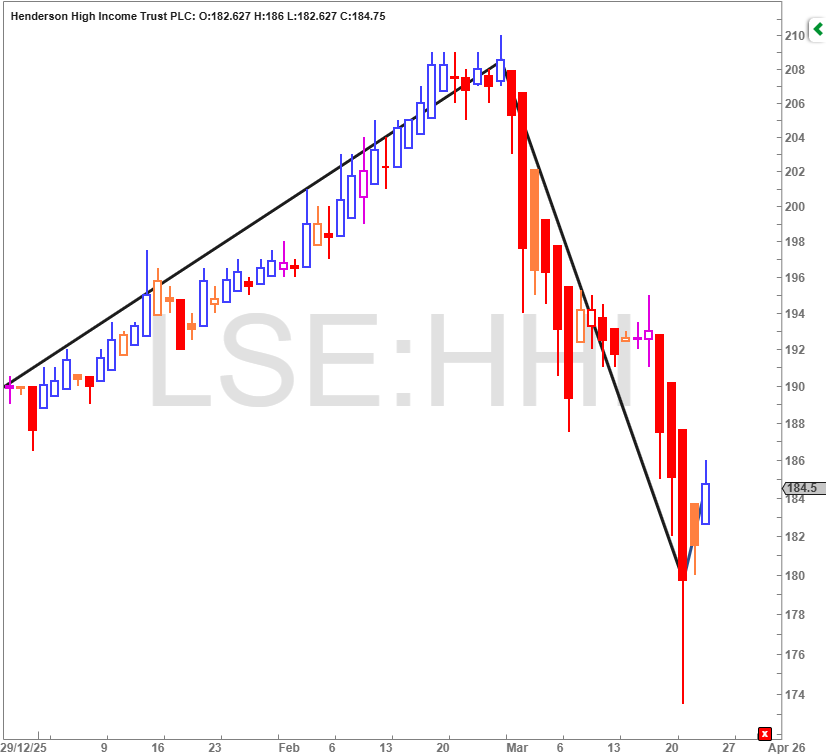
This trust focuses mainly on larger UK companies to generate a high and growing level of income, although the manager has latitude to invest across the market cap spectrum, and currently has 10 per cent of its assets invested overseas. Since David Smith took over more than 10 years ago, the company has enjoyed a good record over most timeframes relative to its benchmark (80 per cent FTSE All-Share index/20 per cent ICE BofA Sterling Non-Gilts Index). The progressive dividend policy is supported by meaningful revenue reserves – the dividend equating to a yield of 6 per cent at time of writing. The company’s bond exposure assists with some of the portfolios’ objectives by complementing existing bond exposure.
The fund seeks income from an international portfolio of mostly blue-chip equities, while also looking to grow capital and dividends in excess of inflation. The portfolio’s composition has broadly a one-third split between North America, Europe including the UK, and Asia Pacific and Latin America – which fits well with our view of the relative merits of the markets involved. Recently announced results for 2025 show a total return of 21.9 per cent, against 12.6 per cent for its benchmark index. Asia in particular assists with the company’s income remit, with the company’s dividend equating to a yield of 3.6 per cent.
It seeks a high level of income by focusing on fixed-interest securities at the upper end of the yield curve, which should be more resilient should we be right about inflation, while supplementing this with a modest exposure to mostly high-yielding equities and convertibles. These latter investments assist in maintaining the company’s record of modestly increasing dividends over time, with help from its not-insignificant revenue reserves. The long-serving and respected manager, Ian ‘Franco’ Francis, has an excellent record of stewardship, with total return performance among the best in its peer group. Meanwhile, the 4.5p dividend equates to a yield of 9.1 per cent.
The fund invests to provide a sustainable, progressive dividend alongside long-term capital preservation courtesy of a highly diversified portfolio of environmental infrastructure assets which are aligned with decarbonisation and resource efficiency. Around 70 per cent of the portfolio is in renewable generation, with the balance in complementary infrastructure, making it one of the most diversified vehicles in its peer group. The strategy focuses on long-term, stable and often inflation-linked cash flows, and currently supports a high, well-covered dividend – despite sector-wide valuation pressure and a wide discount.
Indeed, strong dividend cover of around 1.2 times, low gearing and a comparatively high and therefore conservative discount rate suggest, financial resilience. A key differentiator is the company’s trio of ‘growth assets’ – a UK controlled-environment glasshouse, the CNG biomethane refuelling network and a Norwegian land-based aquaculture facility. These are ramping up operations and are targeted for disposal in due course to crystallise capital growth and recycle proceeds into new opportunities across the energy transition space, without the need for additional fundraising. Meanwhile, the dividend equates to a yield of 11 per cent.
It has an excellent record of generating capital growth and income, predominantly from a portfolio of smaller mining and energy companies. More so, the company is top of its peer group under the stewardship of its respected and long-serving managers, Keith Watson and Robert Crayfourd. Profits have recently been taken in precious metals (while remaining their largest exposure) in favour of increased weightings in oil and gas – the rebalancing being well-timed, having taken place before the US attack on Iran. We also favour the company because the enhanced dividend policy pays 8 per cent of net asset value (NAV) via quarterly distributions of 2 per cent of the preceding quarter-end NAV.
The managers have recently resigned from Manulife CQS Investment Management and are now serving their three-month notice period with no expected disruption to investment process or operations. They have also resigned from its sister funds Golden Prospect Precious Metals (GPM) and Geiger Counter (GCL), both being portfolio holdings. Given these managers’ excellent and consistent performance and stewardship of shareholders’ funds over many years, we will be voting to follow the managers in each case to their new management company – if, and when, we are given the opportunity to do so. Good fund managers deserve support.
This fund specialises in lending to the life sciences industry with investments secured by rights and cash flows from the sales of approved products and not early-stage or pre-approval products. This mitigates risk. The company has performed well over time. Because of its more defensive nature (ie the portfolio holds debt, not equity), the company assists those seeking diversification. In addition, it generates a high income, and this is often supplemented by royalty investments, which help to fund special dividends in addition to the regular dividend of 7¢ a share. A recent dividend announcement brings the total for the year to 9.95¢, which represents a yield of 10.5 per cent at current exchange rates.
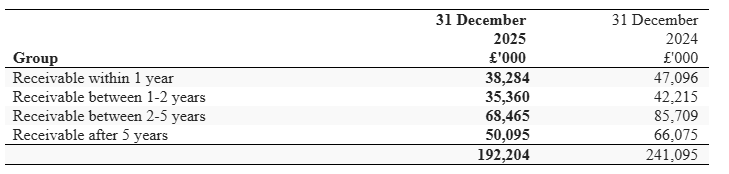
It seeks an attractive level of income and capital growth from a diversified portfolio of good quality UK commercial property assets mostly outside the south-east. The company is overweight the higher growth multi-let industrial and retail warehouse sectors, which we continue to favour. Importantly, the company’s debt has a maturity profile of around eight years at an average interest cost of 3.5 per cent, with the majority of this either fixed or hedged against movements in interest rates. As such, the company delivers a sustainable and growing level of income that currently equates to a yield of 7.2 per cent.

After significant share price declines in recent years, and with energy prices volatile, analyst Edmond Jackson believes there’s an opportunity here.
10th March 2026
by Edmond Jackson from interactive investor

Amid a big sell-off it is often interesting to see which shares resist or even climb. Renewables infrastructure investment trusts have been in a bear market since late summer 2022 as a boon from Russia’s invasion of Ukraine was replaced by higher interest rates to tackle inflation.
Some such funds had borrowed to expand their asset bases – wind farms, solar panels and the like –whose operational stories also became mixed, the ethical appeal of eco investment replaced by lack of wind or blue sky.
It was all enough to see renewables funds slump to a discount to net asset value (NAV) of 34% in February. Within their 2025 results presentations, both the Renewables Infrastructure Grp TRIG
and Greencoat UK Wind UKW
were able to reassure the market against ongoing NAV erosion after the numbers posted further declines, hence shares began ticking up.
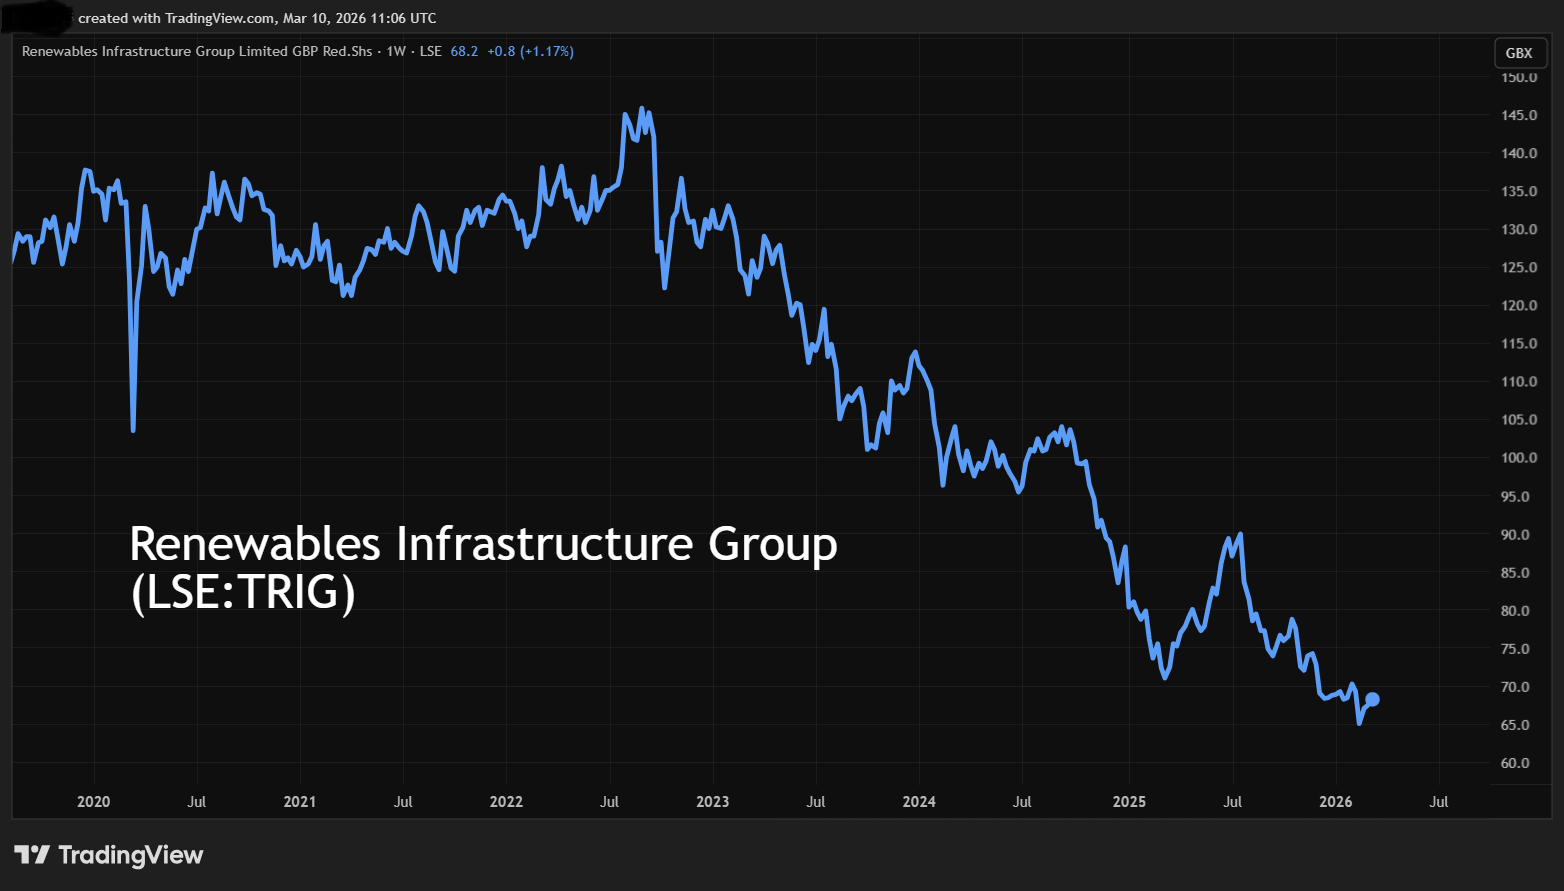
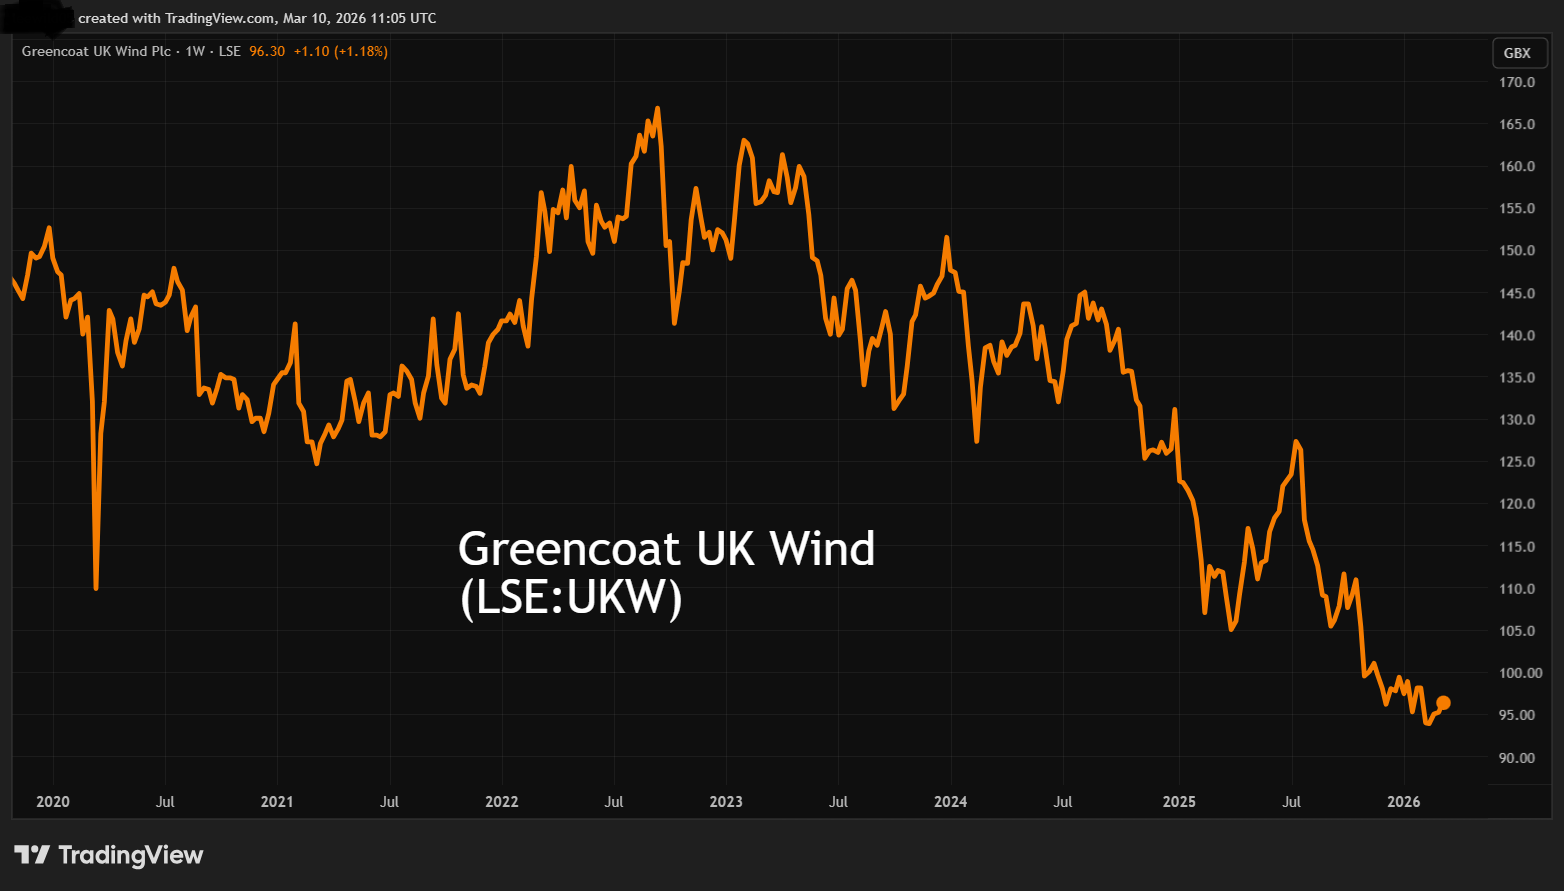
Source: TradingView. Past performance is not a guide to future performance.
Soaring oil & gas prices – especially if sustained – will raise electricity prices, rekindling appeal for broader sources given around 30% is currently derived from natural gas. Even in the years running up to the Ukraine crisis, such funds traded at modest premiums to NAV, so conceptually there is scope for some mean reversion upwards.
Moreover, European Union energy demand returned to growth in 2025 for the first time since 2017 and electricity demand is forecast to rise around 2% a year to 2030. The UK saw a second consecutive year of power demand growth and the fastest annual growth for the first time in over two decades. Obviously, a hard recession would disrupt that.
Fears about how the narrative on interest rates will reverse from steady cuts possibly even to increases if inflation becomes entrenched, implies that care is required in stock selection, in this case as to which funds carry material debt.
Such variables – key to future performance – are obviously tricky to gauge right now. There is no historic precedent of air strikes alone achieving regime change, but without such change in Iran, its new leader – who has just lost his closest family members in the bombing of the Ayatollah’s compound – seems even less likely to find compromise with the US and Israel.
It seems likely, once US President Donald Trump realises the mire he has got himself into with his electorate – stocks falling and energy prices soaring – he will spin some kind of “victory” and retreat from Gulf action. The tipping point will be if and when Iranian drone strikes fizzle out, enabling UAE refineries to restart production.
But it would also need to involve free passage of the Strait of Hormuz where Iranian proxies can enact a longer-term threat. I don’t share the oil market’s knee-jerk reaction back from well over $100 a barrel to $90 on the basis of Trump’s reassuring words from his Florida retreat, that this war will be over soon.
If the Iranian regime remains intact, then more likely this episode will have inflamed acrimony in the Arab/Israeli conflict and with the US. The reason Japanese equities plunged last Monday was reliance on the Middle East for 90% of Japan’s oil imports.
I am therefore wary how, in the medium term, Trump’s mercurial irresponsibility is liable to leave an even worse mess than George W. Bush and Tony Blair did in Iraq. From a tactical investment view, it is worth considering options at least to hedge by way of exposure to energy.
TRIG floated in July 2013 at 100p per share, reaching 145p in mid-2022, but has seen a near consistent downtrend thereafter to a 64p February low. It is capitalised at £1.6 billion, with a diversified portfolio of infrastructure, spanning wind, solar and battery storage projects across six European markets.
At 67p, its shares trade at 0.64x net tangible asset value and offer a remarkable 11.5% dividend yield, albeit marginally short of earnings cover based on 2026 and 2027 consensus earnings forecasts. However, the 2025 results showed operational cash flow which covered the dividend 2.1x gross and 1.0x net after £192 million debt repayment; cash flow being what really matters for payouts.
The Renewables Infrastructure Group – financial summary
Year-end 30 Dec
| 2020 | 2021 | 2022 | 2023 | 2024 | 2025 | |
| Turnover (£m) | 119 | 175 | 555 | -24.2 | -158.0 | -104.0 |
| Operating margin (%) | 98.5 | 98.9 | 99.6 | 0.0 | 0.0 | 0.0 |
| Operating profit (£m) | 117 | 173 | 553 | -27.6 | -161 | -111 |
| Net profit (£m) | 100 | 210 | 521 | 5.8 | -115 | -130 |
| Reported earnings/share (p) | 5.8 | 10.0 | 21.5 | 0.2 | -4.7 | -5.4 |
| Normalised earnings/share (p) | 5.8 | 10.0 | 21.5 | 0.2 | -4.7 | -5.4 |
| Operating cashflow/share (p) | 6.7 | 7.4 | 7.9 | 5.4 | 5.3 | 5.0 |
| Capital expenditure/share (p) | 0.0 | 0.0 | 0.0 | 0.0 | 0.0 | 0.0 |
| Free cashflow/share (p) | 6.7 | 7.4 | 7.9 | 5.4 | 5.3 | 5.0 |
| Dividend/share (p) | 6.7 | 6.8 | 6.8 | 7.2 | 7.5 | 7.6 |
| Return on capital (%) | 5.4 | 6.4 | 16.5 | -0.9 | -5.6 | -4.4 |
| Cash (£m) | 23.1 | 28.2 | 24.5 | 18.1 | 11.7 | 7.1 |
| Net debt (£m) | -23.1 | -28.2 | -24.5 | -18.1 | -11.7 | -7.1 |
| Net assets/share (p) | 115 | 119 | 135 | 128 | 116 | 104 |
Source: company accounts.
The end-2025 balance sheet was also clear of debt, leaving £7.1 million cash.
While the company notionally was loss-making at the operating and net levels, the income statement – where you usually would see revenue – showed a £213 million “net loss on investments” reduced from a £276 million deficit in 2024. Mind you, this does represent what could be a nadir in energy pricing alongside low winds achieved.
For what the consensus expectation is worth, £187 million net profit is pencilled in for 2026 and 2027, with buybacks enhancing earnings per share (EPS) from 6.9p to 7.7p, giving a 12-month forward price/earnings (PE) ratio of 9.5x. If energy prices remain elevated, then upgrades look likely. This applies also to NAV, which fell 11.9p to 104.0p per share due to lower power price forecasts and winds.
Complicating forecasts, however, is 75% of revenues being fixed over the next five years, diluting the effect of price rises. Yet it was possible to consider renewables shares had fallen to overly big discounts to NAV and fat yields, before war in Iran kicked off.
TRIG has also suffered a disappointment lately after HICL Infrastructure PLC Ord HICL
shareholders failed to approve a merger in December, which would have created synergies and de-risked the dividend. It created an onus for TRIG to justify itself again as a standalone.
This fund floated in mid-2013 at 100p per share, reaching 165p in September 2022 and, similar to TRIG, trading at a modest premium to NAV until mid-2022. But NAV fell by 12% last year to 133p per share, hence a current market price of 96p implying 0.72x.
Reported losses also relate similarly to lower gas prices affecting power price forecasts. I suggest they should now be improving intrinsically even if numbers are yet to.
Greencoat’s 2025 income statement still shows stable investment income of £395 million before a £446 million movement in fair value of investments. Lower down is £94 million of finance expense on £1.7 billion net debt, extending the net loss to £193 million.
Capitalised at £2.1 billion, the shares offer an 11.2% prospective yield where indeed there is expected earnings cover over 1.2x and the 12-month forward PE looks around 7.2x – with upgrades seemingly likely.
Greencoat UK Wind – financial summary
Year-end 30 Dec
| 2020 | 2021 | 2022 | 2023 | 2024 | 2025 | |
| Turnover (£m) | 155 | 423 | 1,025 | 234 | 61.7 | -45.4 |
| Operating margin (%) | 81.3 | 93.0 | 96.2 | 82.8 | 38.3 | 0.0 |
| Operating profit (£m) | 126 | 394 | 987 | 194 | 23.6 | -74.3 |
| Net profit (£m) | 104 | 363 | 954 | 126 | -55.4 | -193 |
| Reported earnings/share (p) | 6.5 | 18.3 | 41.2 | 5.4 | -2.4 | -8.7 |
| Normalised earnings/share (p) | 6.5 | 18.3 | 41.2 | 5.4 | -2.4 | -8.7 |
| Operating cashflow/share (p) | 7.7 | 12.2 | 23.6 | 15.5 | 17.1 | 16.5 |
| Capital expenditure/share (p) | 0.0 | 0.0 | 0.0 | 0.0 | 0.0 | 0.0 |
| Free cashflow/share (p) | 7.7 | 12.2 | 23.6 | 15.5 | 17.1 | 16.5 |
| Dividend/share (p) | 7.1 | 7.2 | 7.7 | 10.0 | 10.0 | 10.4 |
| Return on capital (%) | 3.8 | 9.7 | 20.5 | 3.8 | 0.5 | -1.7 |
| Cash (£m) | 7.9 | 4.8 | 19.8 | 21.8 | 5.8 | 14.2 |
| Net debt (£m) | 1,092 | 945 | 1,081 | 1,768 | 1,754 | 1,706 |
| Net assets/share (p) | 122 | 134 | 167 | 164 | 151 | 133 |
Source: company accounts.
As for hedging, Greencoat has fixed 59% of its discounted cash flows over the next seven years, hence has potentially better exposure to higher electricity prices than TRIG. This is also to link dividend policy to consumer price inflation (CPI).
While net cash from operations eased 7% to £365 million, disposals worth £103 million more than doubled cash flow on the investing side of the fund’s flow statement to near £111 million. This helped buybacks rise 35% to £108 million relative to £227 million as dividends.
Management expects to have around £1 billion capital from organic excess cash flow to allocate over the next five years towards development objectives. Opportunities are anticipated from secondary sales of renewables also new construction. As yet, Greencoat has just a 6% UK market share.
I cite these two funds as exemplary, although you might want to read further around this sector. It is the case that I was already considering such shares before this war on Iran erupted, and I believe higher energy prices are likely to feature in 2026 unless regime change leads to oil sanctions lifting.
A longer-term risk could be a Reform government abandoning net zero and pivoting towards North Sea development. Yet I believe a mixed UK energy policy is most likely to remain. Wind actually generated close to 30% of UK electricity in 2025, and last January saw an allocation round for offshore wind offering 20-year contracts linked to CPI.
Growth in data centres is expected to raise UK electricity demand by around 15% over the next five years, yet production from nuclear and gas is expected to decline over the next decade as plants retire.
I therefore consider the odds now tilt towards “buy”.
Edmond Jackson is a freelance contributor and not a direct employee of interactive investor.

The sector has at least made a few tough calls in recent weeks.
23rd March 2026
by Dave Baxter from interactive investor

Stock markets dislike conflict, and it’s no shock to see equities tumbling in response to events in the Middle East. But we also get some surprise “winners” in the midst of such uncertainty.
One such name is Greencoat Renewables GRP
whose shares have returned roughly 16% since late February.
What’s going on here? The trust might have encouraged investors by recently jumping into a hot subsector, having sought to capitalise on demand for data centres with the launch of a “new green digital infrastructure platform” earlier this month.
But we are also seeing a boost for the renewable energy infrastructure sector more generally: the recent conflict has put the subject of energy independence back on the agenda, making things such as wind and solar more relevant.
A much higher energy price is more generally good for the renewable trusts -al though the possibility of higher inflation, higher interest rates and higher government bond yields is most certainly not.
This all puts the sector back into the spotlight at a time when, bowing to some seemingly relentless pressures, a handful of renewable trusts have made painful decisions in the hope of (eventual) recovery.
Bargain hunters, who have done plenty of buying of names like Greencoat UK Wind UKW
will have to judge whether that recovery now seems feasible.
| Some renewable trusts have recovered in challenging times | |
| Trust | Share price total return (%), 28/02/26 to 23/03/26 |
| Greencoat Renewables GRP1.27% | 15.9 |
| Bluefield Solar Income Fund BSIF0.12% | 9.1 |
| Octopus Renewables Infrastructure Ord ORIT0.87% | 8.9 |
| Gore Street Energy Storage Fund Ord GSF6.53% | 6.3 |
| Greencoat UK Wind UKW0.05% | 5.5 |
| Foresight Environmental Infra Ord FGEN0.14% | 4.8 |
| Gresham House Energy Storage Ord GRID0.13% | 3.7 |
| Renewables Infrastructure Grp TRIG1.97% | 1.8 |
| Foresight Solar Ord FSFL1.16% | -0.8 |
| NextEnergy Solar Ord NESF0.78% | -13.4 |
| SDCL Efficiency Income Trust plc. SEIT1.83% | -15.3 |
Source: FE Analytics, 23/03/26. Past performance is not a guide to future performance.
Renewables trusts face a multitude of problems but one issue is that they need to reduce their substantial levels of debt, and that with big discounts to net asset value (NAV) they cannot simply drum up more cash by issuing more shares.
They therefore need to sell assets and manage down any burdensome costs. Such costs can come in the form of expensive debt or a dividend that seems unsustainable. We have seen a few trusts take action on these fronts in recent weeks.
NextEnergy Solar has roughly halved its dividend payment as part of a “strategic reset” that will involve it focusing more on total returns, looking to get its debt down to between 40% and 45% of gross asset value, doing more “capital recycling”, restarting NAV growth and increasing its energy storage exposure.
As is often the case with dividend cuts, investors were not happy, with the shares tumbling and the discount widening further. The market also gave short shrift to the US Solar Fund Ord USF
which “temporarily paused” its dividends as part of its efforts towards building a stronger balance sheet.
Meanwhile, SDCL Efficiency Income Trust plc. SEIT
announced at the end of last week (20 March) that it had sold around 6% of its portfolio, but at a 10% discount to NAV, as part of its mission to cut back debt and generate portfolio liquidity.
Further asset sales are expected, but the board considers it unlikely that other individual asset sale processes would “deliver equivalent shareholder value in the near to medium term”.
As such, the fund might have more unwelcome news for investors in future.
Analysts such as Winterflood’s Ashley Thomas have warned, importantly, that such asset sales will sacrifice cash flow, and likely have an impact on the future dividend.
Some of the worst pain might now be over for certain trusts, or so we can optimistically argue.

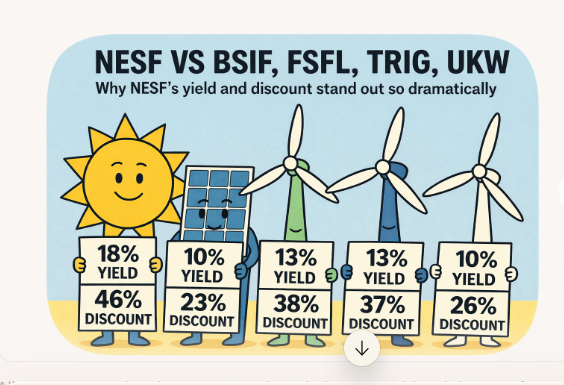
Meanwhile, the discounts and yields available in the sector are pretty mouth-watering, with the NESF yield coming to around 19% even after the halving of its payout. But some of the trusts that list the biggest discounts have actually thrown in the towel already.
trades on a discount of more than 80%, but this seems irrelevant given that it has proposed to de-list its shares.
Meanwhile, Ecofin US Renewables Infrastructure Ord RNEW (52% discount)
Aquila Energy Efficiency Trust Ord AEET(50.2%), Aquila European Renewables Ord AERI0.87% (47.3%) and VH Global Energy Infrastructure Ord ENRG0.00% (30.5%) are in the process of a wind-down.
Investors could potentially consider buying in on big discounts anyway (some professional investors such as Saba Capital do this) but the liquidity in such shares tends to be pretty limited.
That does therefore leave us with a handful of trusts still in operation, many of which have at least begun some sort of a turnaround plan.
The ride, it seems, will still be rocky. Rates and bond yields could stay high, maintaining pressure on renewable infrastructure assets, and it will take such funds a long time to sell down assets.
As mentioned, we also have the prospect of more pain on the dividend front. But as with any turnaround story, we have at least started to see trust boards make some of the tough decisions that seem necessary.

© 2026 Passive Income Live
Theme by Anders Noren — Up ↑