Investment Trust Dividends


Every summer, thousands of investors repeat the same error. Markets grow more volatile, headlines trumpet sudden swings, and numerous people rush into buying or selling at precisely the wrong moment.
Paul Denley, CEO at London-based Oakham Wealth Management, said: “Summer markets can be deceptive. With many professional investors away on holiday, it takes less buying or selling to move prices around. That means markets can look much more dramatic than they really are.”
The notion that markets quieten over summer isn’t novel. The traditional saying captures this succinctly: “Sell in May and go away, come back on St Leger Day.”
Rather, he argues wealthy investors grasp the distinction between market noise and genuine investment opportunities. He continued: “They don’t let scary headlines force them into making emotional decisions. They focus on the quality of the companies they own, not what the market happens to be doing on a Tuesday afternoon in August.”
According to Mr Denley, among the most significant errors regular investors commit is presuming every sharp market movement signals something crucial has shifted.
He explained: “In reality, summer price swings often happen because fewer people are trading. Prices can move more sharply, but that doesn’t necessarily tell you anything about how healthy those businesses really are.”
As the holiday period draws to a close and investors head back to their desks, markets frequently become influenced more by corporate earnings and economic data rather than quieter summer activity. Mr Denley maintains that’s precisely why seasoned investors seldom restructure their portfolios during the summer months.
He said: “Successful investing isn’t about reacting to every headline. It’s about sticking to a well-thought-out plan and remembering that short-term market swings are often just noise.
“The wealthy don’t try to outsmart the calendar. They know patience usually beats panic. If nothing has changed about the businesses you own, a volatile summer isn’t usually a reason to change your investment strategy.”

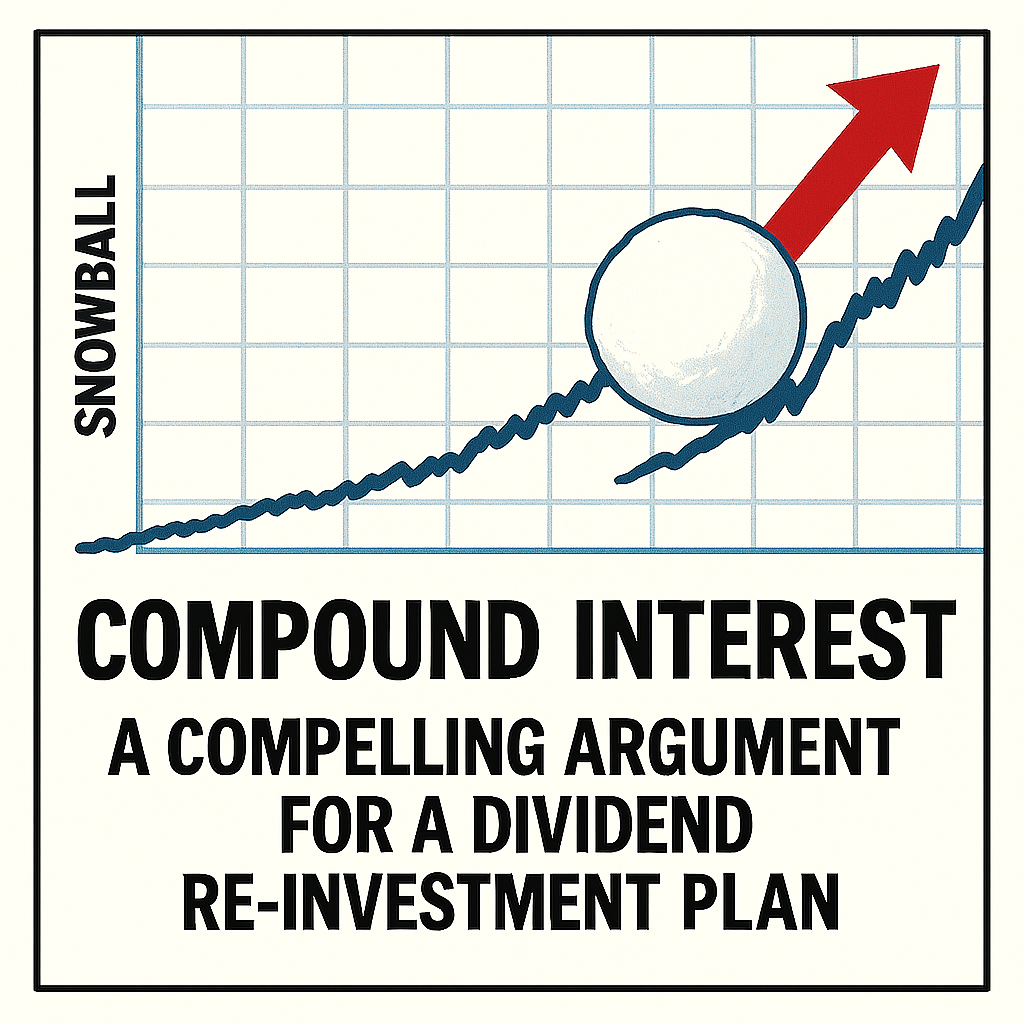
One option is to buy an IT and hold forever and use the dividends either to re-invest in the Trust or another Trust and then when you retire use those dividends to pay your bills.
You can research the SNOWBALL for
Rule of 7/2
Dividends have been 80% of stock market returns
Warren Buffett and the 60% yield from Coca Cola
The SNOWBALL current investment criteria is a yield of 7% or above.
If you look at CTY for 3 specific news driven chart events, there could be a way of improving the yield.
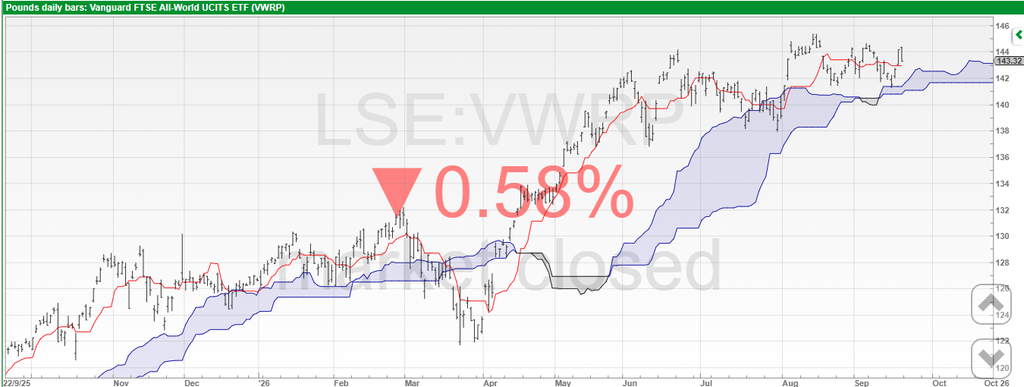
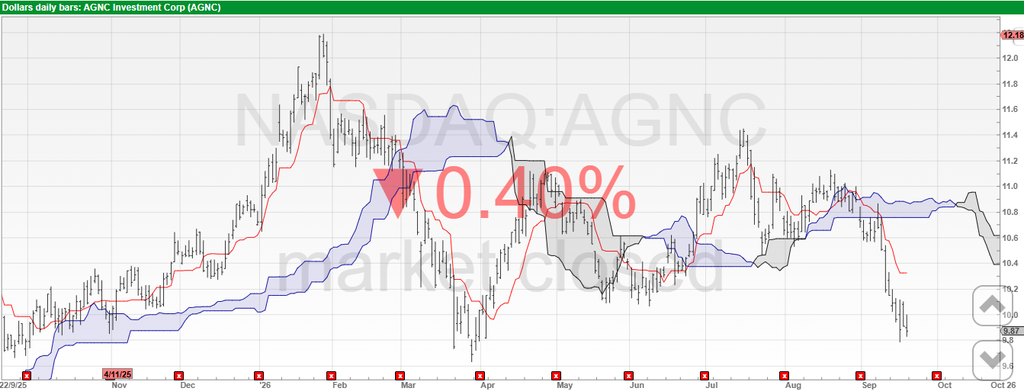
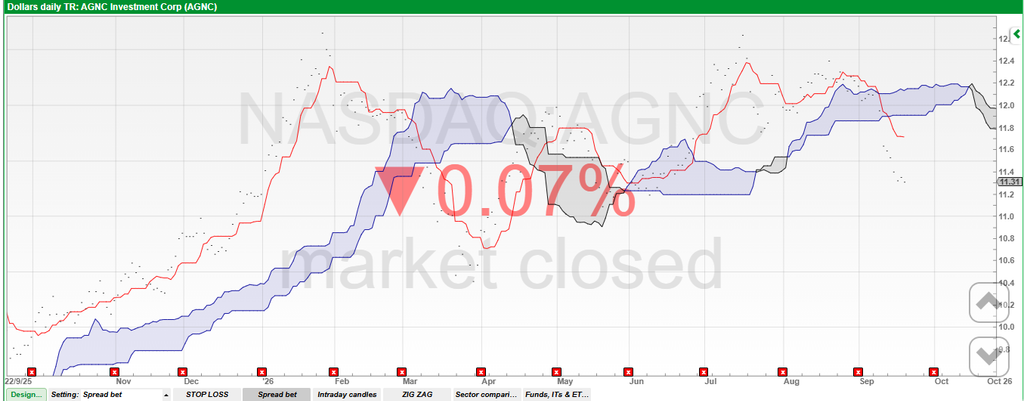
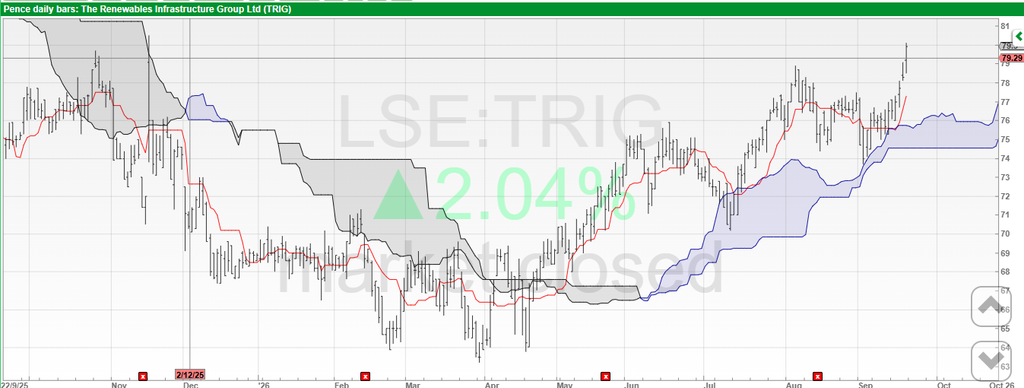
A share has three phases, up, sideways, down. As you want to earn the dividends for re-investment, you need to hold whilst the share is going up and sideways but not when it’s falling. Now shares go up and down all the time, otherwise there would be no markets, you need to sit thru the market noise but be ready to act on news driven events.

You need to be careful when the share is trading below the cloud but it’s not a reason to sell. If you wanted to hold CTY for it’s long term dividend history, Mr. Market gives you the chance.
The orange candle is an inside day and is ignored for trading, so you wait for two positive candles. You can only buy at the bottom, with luck but you could have bought the yield or the second white candle.
When the market falls out of bed, you cannot wait for the price to trade above the cloud as you forfeit too much profit.
The price still traded around 300p in November but you would have banked two dividends.
Common Stock
Sell: $10.83|Buy: $10.93|Change: 0.09 (0.83%)BuySell
$10.88
$10.81
$10.9484
2,280,928
$13.81
$9.83
16.1%
$950.51 mn
09/07/2026
8.57
US70931T1034
24/07/2026
This share can be held in a Dealing accountStocks and shares ISALifetime ISA JISA SIPP
USD
PennyMac Mortgage Investment Trust
| Previous | Latest | |
|---|---|---|
| Record date | 09/04/2026 | 09/07/2026 |
| Ex-dividend date | 09/04/2026 | 09/07/2026 |
| Payment date | 24/04/2026 | 24/07/2026 |
| Amount | $0.40 | $0.40 |
1D | 1M | 3M | 1Y | 3Y ann | 5Y ann | 10Y ann
| Total return (%) | |
|---|---|
| PennyMac Mortgage Investment Trust | + 0.83 |
PennyMac Mortgage Investment Trust is a specialty finance company that invests mainly in residential mortgage loans and mortgage-related assets. The company’s operations include activities such as the production and servicing of financial securities based on residential loans and the pooling and reselling of high-credit-quality mortgages. The company operates through three segments: correspondent production, credit-sensitive strategies, interest-rate-sensitive strategies. The Credit sensitive strategies segment generates income via investments in CRT arrangements, subordinate MBS, distressed loans, and real estate.
Real Estate

You want to invest your hard earned in your Snowball, as you know in the long run markets go up but not in a straight line.
You want to sleep soundly in your bed, you also know most stock market returns in the long run are returned dividends.
You are interested in CTY because having done your research you know they have a very long history of gently increasing their dividends and you also know that CTY have reserves to add to their income to maintain their dividend record.
Remember, if you are a long term holder, those reserves have been paid for by you.

That’s the TR chart, which includes earned dividends.

That’s the chart, where you simply do nothing and re-invest the dividends back into the share, until you want to use those dividends to pay your bills.
Using good ole hindsight, 5k invested would know be worth 80k.
The current yield is 3.7% so income of £2,960 a buying yield of around 60%
Some platforms allow you to re-invest, at zero charge.

Nearer to the end of a bull market than the start, now might not be the best time to start a new position. Money market accounts pay a similar yield, so you could accrue some cash and wait for a better entry/yield point.
One obstacle, you may set a target of say 4.5% and CTY gets close to the yield but never trades that low.

One way of trading would be to buy, after a fall, when the price trades back above the cloud, high risk in the current markets.


This “All-American” 11.6% Dividend Hasn’t Been This Cheap Since 2017
by Michael Foster, Investment Strategist
As America celebrates its 250th, there’s something happening inside its economy that’s not getting enough attention.
A quiet boom.
It’s one more thing worth celebrating this month – and we’re going to do that. We’re also going to get set for the next leg of America’s low-key growth run with a closed-end fund (CEF) yielding north 11.6%.
The chart below, which The Economist published two years ago, nicely sums up the wealth-building power of the US economy over the long haul.

The key piece of info here is on the left side of this chart. Here, we can see that over the last century, each generation of Americans has started its working career earning more than previous ones. And, yes, this data is inflation-adjusted.
No matter how you slice it, America is getting wealthier, generation by generation.
I know that this kind of optimism feels a bit, well, off these days, going by the negativity we read in the press. But the facts are clear. And we can bring this up to the present day by looking at Americans’ disposable income: It’s done nothing but march higher.

Here we see the amount of inflation-adjusted disposable income each worker has, on average. Right now, it’s around $11,072 per person per year, or double what it was 40 years ago.
That’s striking. And despite the gloom hanging over the job market these days, the average person’s employment prospects still look good, with the jobless rate at 4.2%.
Nonetheless, the disconnect between these bullish numbers and consumers’ dour mood is real. You can clearly see it below:

The blue line shows disposable income steadily rising, with things going temporarily haywire during the pandemic, when disposable income suddenly skyrocketed.
Disposable income has since retreated to the normal upward trendline, but no matter. Consumer sentiment (the green line) has slumped, and remains in the dumps years after the last lockdowns ended. Perhaps the memory of all that extra money during COVID is at play here.
In any case, one thing that certainly is true is that inflation is higher than it was in the 2010s – so much so that economists have accepted that we’re probably going to have 3% inflation on average instead of 2% for the long haul. But the fact remains: Americans are still earning more and have more to spend, and this trend has moved steadily along for a hundred years.
An 11.6% Dividend With a Buy American Kicker
What America has accomplished over the last 250 years is incredible, especially since we’ve now seen an entire century of growing wealth as a result.
Which is where the Liberty All-Star Equity Fund (USA) comes in – and not only for its patriotic ticker. In one go, the CEF gives us exposure to leading US firms like NVIDIA (NVDA), Microsoft (MSFT), Alphabet (GOOGL) and Amazon (AMZN).
But it’s not all about tech: Capital One Financial (COF), Visa (V) and health insurer Humana (HUM) show up among its top-10 holdings, too. USA takes its gains on this portfolio and “converts” them into that 11.6% dividend. And as you’d expect in a rising market, that payout has been growing.
USA’s Big – and Rising – Payout

The fund fuels its dividend by aiming to return 10% of its net asset value (NAV, or the value of its underlying portfolio) as payouts every year. That’s why the line above tends to fluctuate over time.
That upward trend in the dividend is, as a result, tied to the fund’s performance: Over the last decade, USA’s market pricebased total return has more than tripled (in purple below), with its total-return NAV (in orange) not far behind.
USA Marches Higher (No Matter How You Measure It)

At the right side of the chart above, you’ll see that the fund’s total NAV return is starting to reel in its market price-based return. That’s resulted in a discount to NAV (the main valuation indicator among CEFs) of 12.9%.
That’s a level not seen since 2017. And it’s completely out of step with the strength of this fund’s performance over time – not to mention its rising payout:
USA’s Back-to-2017 Sale

The power of USA’s high dividend, over time, should not be underestimated, either. The chart below tells the tale of two hypothetical investors: one who bought $100K of USA a decade ago and reinvested their payouts (in orange) and one who used the fund’s dividends to pay their bills, relying solely on USA’s price gains for growth.
Both tales are happy ones:
USA Is a Long-Term Winner, No Matter What You Do With the Dividends

As you can see, an investor who bought USA a decade ago and used the fund’s dividend to pay for living expenses would have still seen their $100,000 initial investment rise to $116,230. Not bad! And our investor who reinvested their payouts would now have a holding worth $317,610.
It just goes to show that a CEF like USA is a smart way to ride along with America’s long-term growth – whether we need the income generated by that growth or not.
4 More “Star-Spangled” 10%+ Dividends as America Turns 250
This quiet boom isn’t just about the American economy as a whole. It’s fueled by several “mini-booms” happening in specific sectors.
Like pharma, where AI is slashing drug-development times, setting up billions more in sales for drugmakers.
Or on the factory floor, where AI-powered robots can make their own decisions, in real time, slashing costs and boosting product quality.
The best news for us is that CEFs give us a way to tap these “mini-booms” while grabbing big income streams at the same time.

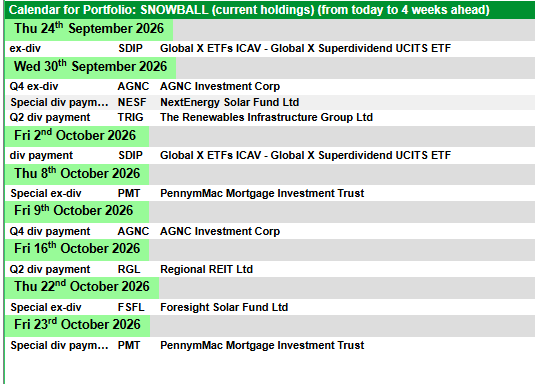
Income to date £8,013.00. Although the SNOWBALL is ahead of this year’s target, do not scale to reach a year end figure, as the total contains a special dividend that may not be repeated next year.
Cash for re-investment £347


TwentyFour Select Monthly Income Fund Limited
(a non-cellular company limited by shares incorporated in the Island of Guernsey under the Companies (Guernsey) Law 2008)
Re: Dividend Announcement
The Directors of TwentyFour Select Monthly Income Fund Limited (“SMIF”), the listed, closed-ended investment company that invests in a diversified portfolio of credit securities, have declared that a dividend of 0.5 pence per share will be paid, in line with the Prospectus, representing the regular monthly targeted dividend for the financial period ended 30 June 2026 as follows:
Ex-Dividend Date 16 July 2026
Record Date 17 July 2026
Payment Date 31 July 2026
Dividend per Share 0.50 pence (Sterling)
Given the ongoing interest rate environment and volatility in the global markets, the Directors have given careful consideration to the Company’s projected income for the year against their assessment of risks currently affecting the markets and those inherent in achieving its target dividend payment of 6 pence per share per annum. Based on this analysis the Directors believe that dividends payable in respect of the year ending 30 September 2026 are likely to be in excess of 6.5 pence per share.

Pair trading is where you split your capital between two Trusts, both that pay a dividend but the first Trust where you hope to make a capital gain and the second Trust where the income is given priority but still with the chance of a modest capital gain. The blended yield remains at 7% or above.


You still receive dividends for re-investment as you wait to see if your stock picking was correct.


2 Monthly Dividend Stocks I’d Buy for Steady Cash Flow
Two dividend stocks are ‘strong buy’ options for investors seeking steady cash flow every month.
Posted by
Christopher Liew, CFA
Published July 8
Dividend stocks are tangible passive-income assets thanks to the stock market. Many retirees fund their living and other expenses with dividend income, while keeping the capital intact. Most publicly listed Canadian companies pay quarterly dividends, although a select few distribute payouts monthly.
My “buy now” monthly dividend stocks for steady cash flow are Bird Construction (TSX:BDT) and RioCan (TSX:REI.UN). There are compelling reasons why these dividend payers are buying opportunities and worthy of consideration.

Yield chasers will not pick Bird Construction for its monthly payouts. However, this industrial stock offers a total return package in 2026, not to mention a long growth runway. At $64.85 per share, current investors delight in the market-crushing 129.7% year-to-date gain on top of the modest 1.3% dividend.
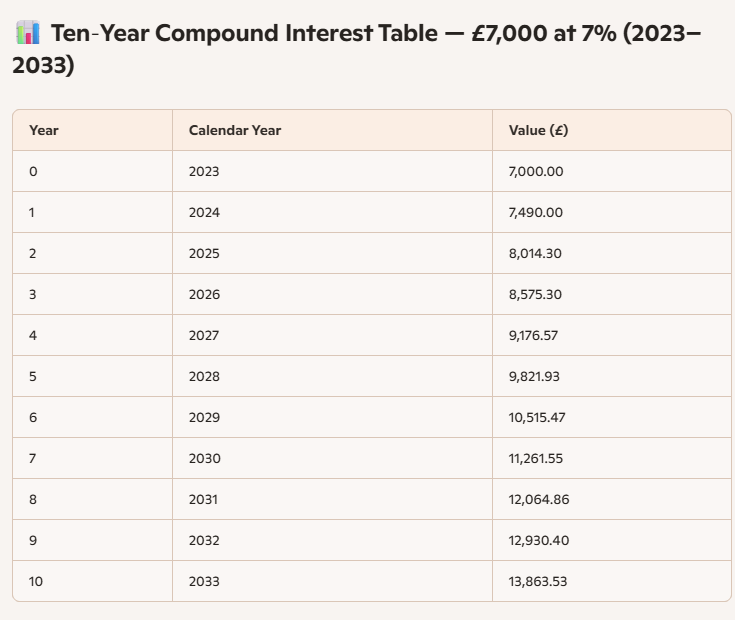
Had you invested $7,000 at year-end 2025 ($28.24 per share), your money would be worth nearly $16,074 today. Note that BDT is a 2025 TSX30 winner, the flagship program highlighting Canada’s 30 top-performing stocks. It ranked 17th and is likely to join the prestigious list again this year. The total three-year return is plus-753.5%, representing a 104.4% compound annual growth rate (CAGR).
This $3.7 billion construction and maintenance company has become a dominant player in the country’s infrastructure and industrial landscape. It serves all major markets, providing comprehensive construction services and innovative solutions.
One Bird platform was launched as the centrepiece of its 2025–2027 strategic plan. Bird uses its own workforce and equipment to have direct control over project schedules and quality. It also promotes collaboration among internal teams to mitigate against industry-wide labour shortages.
In Q1 2026, construction revenue and net income grew 9% and 21% year-over-year to $783.4 million and $11.4 million, respectively. Notably, the backlog of contracted work rose 5.8% to over $5.4 billion versus Q1 2025. Teri McKibbon, President and CEO of Bird, said, “Record contracted backlog and a sizable pending backlog provide clear visibility into future activity.”
RioCan offers predictable income delivery to investors. The retail-focused real estate investment trust (REIT) boasts highly stable rent collection from resilient, necessity-based tenants such as grocery chains, value retailers, and pharmacies. Also, at $22.86 per share, REI.UN outpaces the TSX, up 25.7% year-to-date versus plus-11%. If you invest today, the dividend yield is 5.1%.
According to this $4.7 billion REIT, its productive retail core assets and future-focused platform will drive durable growth and lasting value to shareholders. The densely populated, supply-constrained urban markets also provide structural market advantages. Around 86% of RioCan’s 167 properties have a grocery component.
The committed commercial and retail occupancy rates at the end of Q1 2026 were 97.9% and 98.6%, respectively. RioCan reported a blended leasing spread of 25.8%, the highest to date, compared to 17.5% in Q1 2025. Meanwhile, portfolio investments and development spending are ongoing. RioCan expects cash NOI to grow by at least 3% annually after 2027, primarily supported by contractual rent steps and positive leasing spreads.
The pairing of Bird Construction and RioCan REIT creates a formidable monthly cash-flow engine. You get total-return power, too – the best of both worlds – with capital growth alongside the dividends.

© 2026 Passive Income Live
Theme by Anders Noren — Up ↑