Passive Income

Investment Trust Dividends

Page 67 of 304

Today’s quest

Накрутка мобильными
arkhipsoft.ru/TermidroidMobilex
isutinne1983@gmail.com
191.102.181.100
It’s interesting to see how the UK economy is showing signs of resilience despite the challenges it has faced in recent years. The 0.7% GDP growth in March is a positive indicator, especially when many were expecting worse. The focus on sectors like aerospace, industrials, and real estate seems strategic, given the current economic climate. I’m curious, though, how sustainable this rebound is, particularly with global uncertainties still looming. The emphasis on big-ticket retail items is intriguing—do you think this is a long-term trend or just a temporary opportunity? Also, with the FTSE 100 playing a significant role, how much of this resilience is tied to global market dynamics rather than domestic factors? Would love to hear more about the potential risks that could derail this positive momentum.

Thanks for the commentary. The Snowball is more of a market follower than a predictor of the future. The main criteria is the current dividend/yield and if future dividends will be paid and not drastically altered.

To follow the market you should read the news when the dividend is announced and any interim/final accounts.

Control share

The 2025 target for the Snowball is 10k.

The value for the control share VWRP is 130k. Using the 4% rule a pension of £5,200.

If you compound both figures by 7% the Snowball would provide a ‘pension’ of 20% on seed capital and VWRP 10.4%. Gambler or Investor ? The choice is yours my friend.

Across the pond

This 9.7% Dividend Trounced Stocks in a Wild April. It’s Just Getting Started

by Michael Foster, Investment Strategist

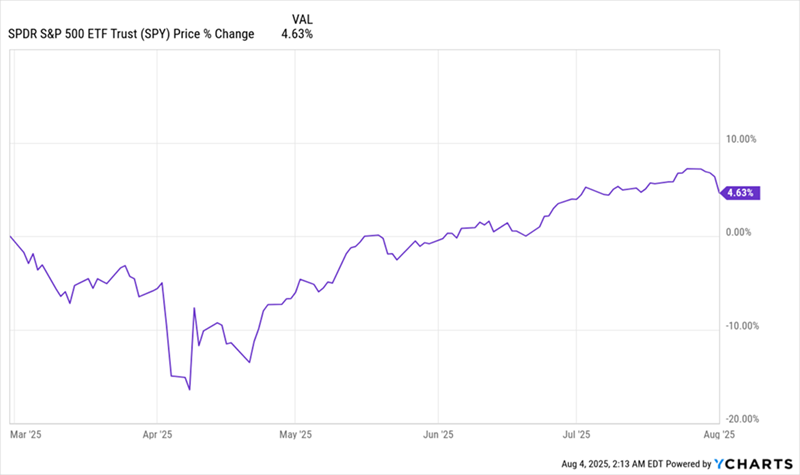
About a month ago, Mike Bird, the Wall Street editor for The Economist, tweeted (or “X-ed,” I guess I should say) the following: “You have to concede that there would be a form of stupid, ridiculous beauty in the S&P 500 closing completely flat for April.”

And, well, after all the drama we saw in April, that’s pretty much where we landed.

A Wild – But in the End, Sideways – April for Stocks

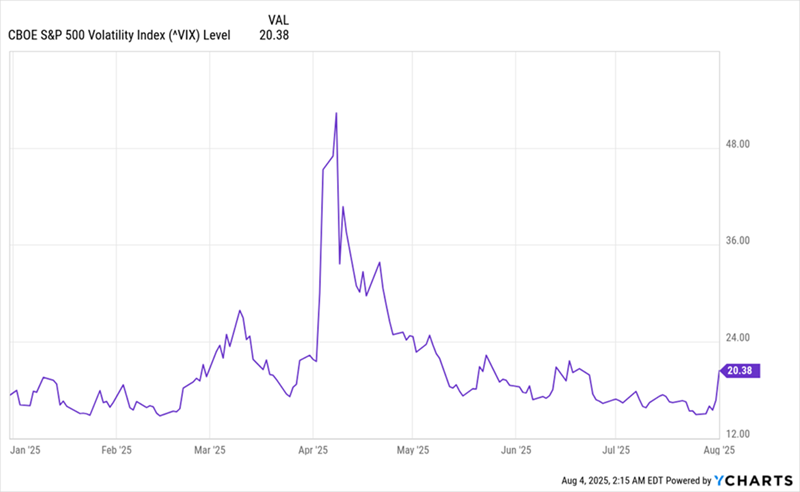
I once met Mike for coffee, and he’s a friendly, intelligent person, so it’s easy for me to agree with him here: Yes, the market behaved stupidly in April, starting with the tariff selloff and ending with the first hints of a deal with China (with various back-and-forth moves on tariffs in between). But there’s a lot we can learn from that wild month.

Let’s look at three things that stand out, especially for those of us who aim to invest for high income and a “dividend-driven” retirement.

April Takeaway No. 1: Diversification Works

While stocks have struggled to get into the green this year (and mightily in April!), corporate bonds are up: The benchmark for corporates, the SPDR Bloomberg High-Yield Bond ETF (JNK), has returned a little more than 2% year to date as I write this.

We, of course, prefer to buy bonds through closed-end funds (CEFs), for two reasons:

  1. Active management: CEFs – especially those with well-connected managers – have a big advantage over ETFs. The bond world is small, and it pays to “know people who know people” to get in on the best new issues.
  2. Bigger dividends: The bond-fund bucket of the CEF Insider portfolio has funds yielding up to 13.7% as I write this, and …
  3. Discounts to net asset value (NAV, or the value of the fund’s underlying portfolio), which give us additional upside as they shrink. That’s in addition to gains in the value of the portfolio.

A good example is the PGIM Global High Yield Fund (GHY), which we added to the CEF Insider portfolio in late January. It’s outperformed the S&P 500 since, as of this writing.

GHY Clobbers the S&P 500

Why is GHY beating stocks? The CEF invests in corporate bonds, whose big yields have held up, thanks to the Fed keeping rates higher. That’s letting GHY sustain its 9.7% dividend and attract more investors, especially since defaults have remained low among US and global companies.

It’s a good example of how we can blunt the effect a stock-market crash on our portfolios by investing elsewhere. And of course (and maybe more important!) we diversify our income stream, too. Let’s talk about that next.

April Takeaway No. 2: Dividends Keep Us From “Forced Losses”

GHY, as mentioned, yields 9.7%, or about $80.83 per month per $10,000 invested. That’s a lot more than the $10.25 per month you’d get from an S&P 500 index fund.

The typical index fund’s tiny income stream means that if an investor needed to sell stocks to fund their needs in April, they faced a much higher risk of being forced to do so at a loss. That’s not the case with GHY, with its 9.7% payout. Hence the month was an opportunity for GHY buyers, especially those who bought more when GHY sold off at the start of April.

April Takeaway No. 3: Irrational Investors Give Us an Opportunity

The market also, of course, gets it wrong and overshoots to the downside all the time. That mispricing is something we can pounce on.

Yet again, GHY is an example here. When we added it to the CEF Insider portfolio in January, it was trading at a 3.25% discount to NAV. Now it is trading around par and has moved solidly into premium territory a number of times since our buy.

GHY’s Discount Narrows

As more investors diversify away from stocks and find streams of income to tide them over amidst uncertainty, I expect GHY to see a healthy premium yet again.

These 11.6% (Monthly) Dividends Can Save You From Another “April Surprise”

April’s chaos showed the power of high-yield CEFs like GHY. While the S&P whipsawed, holders of top-notch CEFs didn’t worry. No matter how things panned out, they knew they’d get 7%, 8% 10% and more in cash dividends – every single year.

The best part is, many CEFs – GHY among them – pay dividends monthly. That means you not only get “recession-resistant” income, but your payouts drop into your account right in line with your bills !

A single step.

How I’d start investing today to aim to build a £1.3m portfolio from scratch

Story by Oliver Rodzianko

BUY AND HOLD spelled in letters on top of a pile of books. Alongside is a piggy bank in glasses. Buy and hold is a popular long term stock and shares strategy.

BUY AND HOLD spelled in letters on top of a pile of books. Alongside is a piggy bank in glasses. Buy and hold is a popular long term stock and shares strategy.© Provided by The Motley Fool

The best time to start investing is today.

Whether I have £500 or £50,000, it’s not about the amount but how wisely I allocate it. The key to success is starting early and staying consistent.

Pound-cost averaging

When I started investing, I found pound-cost averaging to be the most effective method for me. I invest a small amount of disposable income from each paycheque into top companies every month, regardless of their current valuation.

As long as these businesses have solid long-term prospects, I keep buying over the years. It’s a simple and reliable approach to building wealth.

One key principle I stick to is diversification. I spread my investments across different businesses to avoid having all my money tied up in just one, reducing the risk of any single company’s downturn.

Getting started

It couldn’t be easier to begin. First of all, I need a Stocks and Shares ISA or a share-dealing account. The provider I’m most fond of is Interactive Investor

Staying the course

I’ve found that one of the best ways to generate strong portfolio profits is by being part of a solid community of investors. That’s one of the main reasons why I appreciate The Motley Fool UK.

More than anything, investing is a lifelong skill. It takes time, patience, and perseverance to build wealth. Developing a successful portfolio is far from a get-rich-quick scheme, and that’s exactly why it works.

As I mentioned, if I invest £200 per month from scratch, I could grow a portfolio worth £1.3m in 40 years, assuming a 10% annual return. Wealth isn’t about luck, it’s about knowledge, preparation, and time spent in the market.

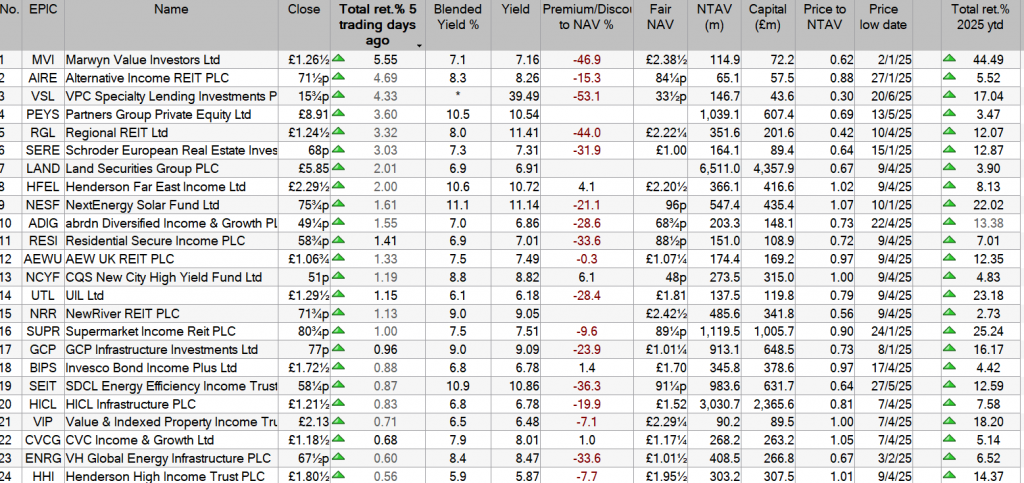
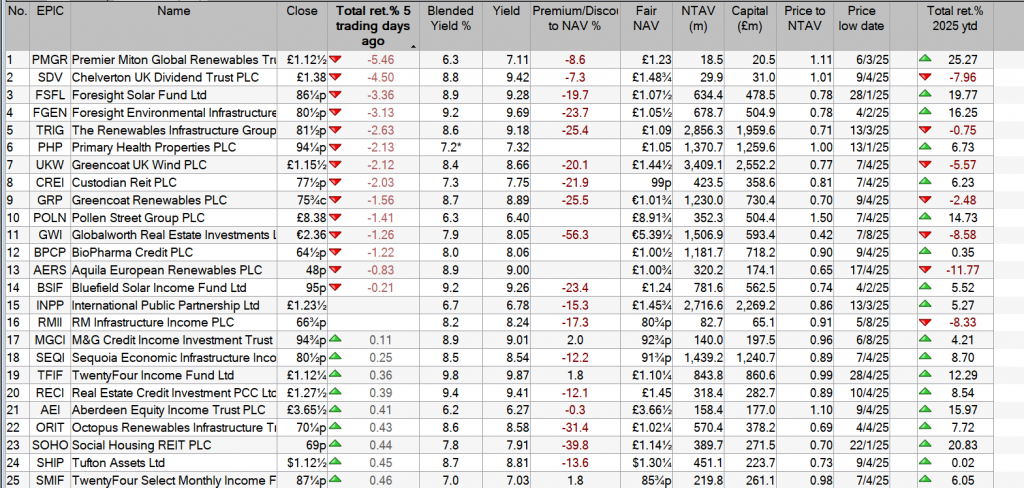
Watch List Leaders year to date

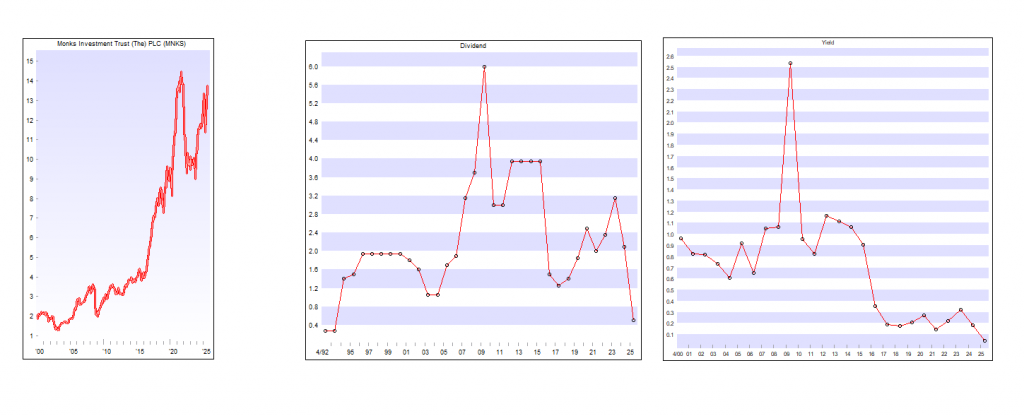
BRLA leaves the Watch List as the Trust is no longer a candidate for the Snowball. As the price rose the yield fell below 6%

* VPC are returning capital so the future yield is the unknown

    Remember although a capital gain is always welcome the only consideration for inclusion in the Snowball is the yield, either the buying yield or the current yield.

    Warren Buffett mini me.

    How much passive income could a £20K Stocks and Shares ISA have made in the past decade?

    Stuffing a Stocks and Shares ISA with dividend shares as a passive income idea is one thing — but what might the results be in practice?

    Posted by Christopher Ruane

    Published 16 May

    Young female couple boarding their plane at the airport to go on holiday.
    Image source: Getty Images

    When investing, your capital is at risk. The value of your investments can go down as well as up and you may get back less than you put in.

    You’re reading a free article with opinions that may differ from The Motley Fool’s Premium Investing Services.

    A Stocks and Shares ISA is a long-term investment vehicle.

    Different investors use it in different ways. Some want to target capital growth by buying shares cheaply and later selling them for a profit. Some focus on passive income: a regular stream of dividends, or putting the dividends to work to try and earn more income down the road.

    So, how much passive income could a £20K Stocks and Shares ISA realistically have earned over the past decade?

    The straightforward dividend approach

    One variable is the average dividend yield. I will use three to illustrate: the current FTSE 100 average of 3.6%, then 5% and what I see as a high yield, 8%. In today’s market, I think both 5% and 8% are possible while sticking to carefully selected blue-chip shares.

    Taking dividends out as they are paid, over a decade, 3.6% would have generated £720 each year – a total of £7,200 over a decade.

    Five percent would have been £1,000 each year – a total of £10,000 in a decade. At 8%, the ISA would generate £1,600 a year in dividends. That means the £20K would have generated £16K of passive income over my chosen timescale.

    On top of that, an investor may benefit from capital gains when the price goes up (although share prices can fall as well as rise).

    Taking the Warren Buffett approach

    A second approach is to do what billionaire investor Warren Buffett does.

    He has run Berkshire Hathaway (NYSE: BRK.A) (NYSE: BRK.B) for decades but during his tenure it has only paid one dividend. That is despite it generating huge cash flows thanks to owning a lot of successful businesses outright while also holding shares in steady dividend payers like Coca-Cola.

    It makes sense for Berkshire to keep some cash on hand. It operates in the insurance industry and there is always a risk that an event — like a hurricane — could suddenly push up its short-term cash needs to meet claims. But Berkshire has hundreds of billions of dollars of cash on hand today!

    Rather than doling it out as dividends, Buffett aims to put it work to try and earn even more money in future, by making more investments (although the current cash pile means Berkshire hasn’t done as much of that lately).

    Compounding an ISA

    A similar approach (known as compounding) can be applied to the dividends received in a Stocks and Shares ISA.

    Compounding a £20K ISA at 3.6% for a decade, it would be worth over £28,400 – enough to earn £1,025 in dividends at a 3.6% yield.

    Compounding at 5%, the ISA would be worth over £32,500 after a decade. That could then earn around £1,628 each year in dividends.

    Meanwhile, compounding the £20K ISA at 8% for 10 years, it would be worth over £43K and could then earn £3,454 in passive income annually.

    Compounding would have meant sacrificing dividends for a decade but hopefully earning bigger ones from this year onwards (or whenever the investor chose to stop compounding and start withdrawing).

    Selecting the right shares is key, but the costs of a Stocks and Shares ISA can eat into overall returns, especially over the long So a savvy investor will start by comparing different ISAs on the market and decide which one suits their needs best.

    Something for the Anoraks

    Nine global funds with the highest Sharpe ratios year in, year out

    16 May 2025

    Trustnet looks for global funds with high Sharpe ratios in most years of the past decade.

    By Gary Jackson

    Funds run by Legal & General Investment Management, Columbia Threadneedle and Fidelity are among the handful of global equity strategies that have consistently made their sectors’ highest Sharpe ratios, Trustnet research has found.

    The Sharpe ratio measures the risk-adjusted return of an investment by comparing its excess return over the risk-free rate to its standard deviation. A higher Sharpe ratio indicates more return per unit of risk, making it a useful tool for evaluating the efficiency of investment performance.

    In this series, Trustnet is looking at the Sharpe ratios of funds over the past decade to find out which ones have spent at least six of those years in their sector’s top quartile for this closely watched risk/return metric.

    We start with funds that have a global reach, putting the IA Global, IA Global Equity Income and IA Global Emerging Markets sectors under the spotlight.

    Across these three peer groups, there are 381 funds with a track record of 10 or more years, but only nine have been in the top quartile for Sharpe ratio in six of the past decade. They can be seen in the table below, along with their total return over the entire period.

    Source: FE Analytics. Total return in sterling between 1 Jan 2025 and 31 Dec 2024.

    At the top of the table is L&G Global 100 Index Trust, which has made the highest total return of the nine shortlisted funds – it was up 304.6% over the decade under consideration, compared with a rise of 154.3% for the average fund in the IA Global sector.

    The £1.8bn tracker physically replicates the S&P Global 100 index, which is made up of the largest 100 companies from across the globe. This means the portfolio’s biggest holdings are the likes of Apple (11.8%), Microsoft (10%) and Nvidia (9.3%), resulting in a hefty skew towards the US (78.6% of the portfolio).

    Performance of L&G Global 100 Index Trust vs sector between 1 Jan 2015 and 31 Dec 2024

    Source: FE Analytics. Total return in sterling between 1 Jan 2015 and 31 Dec 2024

    The remaining eight funds on the shortlist are active strategies, with Fidelity Responsible Global Equity Income putting in the second-best performance after making 272.7% since the start of the period we examined.

    It has been managed by Aditya Shivram since July 2021, although he has run the offshore Fidelity Global Equity Income fund since its launch in 2013. The approach behind the £189m fund looks for sustainable, higher quality companies with stable and/or improving returns on capital, reasonable valuations, low leverage and predictable, stable business models.

    Fidelity Responsible Global Equity Income has a much lower allocation to the US than many global portfolios. It has just one-third of its portfolio in US companies, compared with 64.6% in its MSCI AC World benchmark. Six of its top 10 holdings are from outside of the US, including Deutsche Boerse, Munich Re Group, Relx and Unilever.

    CT Global Extended Alpha came in third place. Like all the funds on the shortlist, it was top quartile in its sector for Sharpe ratio in six of the 10 full years we examined and made a 232.6% across the decade.

    This fund has been run by Neil Robson since 2012 and, unlike the typical global equity fund, follows an ‘equity extension strategy’ that allows proceeds from short positions to be used to extend the portfolio’s long positions – thereby offering more exposure to the strongest investment ideas.

    As can be seen, most of the consistent top Sharpe ratio funds are in the IA Global sector while two reside in IA Global Equity Income. Only one – Templeton Emerging Markets Smaller Companies – is in the IA Global Emerging Markets sector.

    Templeton Emerging Markets Smaller Companies has been run by Chetan Sehgal since 2017, with FE fundinfo Alpha Manager Vika Chiranewal joining as co-manager in 2020. Like all Templeton emerging market funds, it takes a valuation-oriented approach with a focus on bottom-up analysis and little emphasis on top-down views.

    While the nine funds in the table above are the only ones to have achieved top-quartile Sharpe ratios in six of the past 10 full years, there are 35 without a single year in the first quartile.

    Among them are Pictet Global Megatrend Selection, CT Global Equity Income, Jupiter Merlin Worldwide Portfolio, TM Stonehage Fleming Global Equities and abrdn Emerging Markets Equity.

    The Sharpe ratio is a composite metric which reflects two closely related attributes of an instrument, the reward and ‘risk’. In general, if the risk is expected to be higher then the expected return should also be higher to compensate for the higher chance of a lower or negative return.

    The Sharpe ratio is defined as the mean (average) return minus a risk-free return divided by the standard deviation of past returns. Note that the risk-free rate should reflect the periods used (e.g. don’t use an annual risk-free rate for monthly periods). Regardless of the periods selected, the Sharpe ratio value is given as a monthly figure.

    Furthermore, the Sharpe ratio graphically represents the slope of a portfolio’s capital market line. Because of this, it can be interpreted also as an amount of additional reward required by an additional 1% of risk. Higher Sharpe ratios are better

    The investment trust sectors driving UK outperformance

    Story by Dan McEvoy

     The investment trust sectors driving UK outperformance

    The investment trust sectors driving UK outperformance© da-kuk via Getty Images

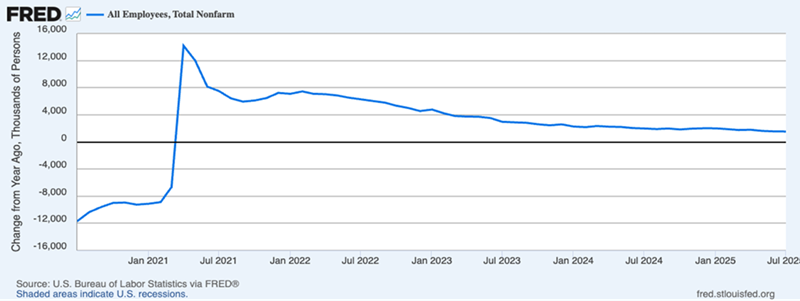
    Are these fears overblown ? Perhaps. UK GDP growth reached 0.7% in March, defying pessimistic expectations. Inflation is relatively under control, and as such the Bank of England has leeway to keep reducing interest rates, unlike its US counterpart the Federal Reserve.

    Increased European defence spending could prove a boon for UK aerospace and other sectors.

    Research from the Association of Investment Companies (AIC) shows UK equities have been more resilient than global counterparts. In the year to 8 May, the average UK All Companies investment trust is up slightly over 10%, compared to 1% for the average Global sector trust.

    “It may be that the UK market has already started its rebound after several years of underperformance,” says Annabel Brodie-Smith of the AIC. “We certainly aren’t out of the woods, but with two trade deals signed and interest rates on their way down, the stars may finally be aligning for UK companies.

    The tariff turmoil produced winners and losers, and to trust managers surveyed by the AIC, the UK economy has good exposure to those sectors that came off best.

    Which sectors have driven UK resilience?

    The composition of the UK stock market, particularly the FTSE 100, is a large driver of the resilience that the UK has seen.

    Large caps in the UK stock market are typically in highly defensive sectors like consumer staples, says David Smith, portfolio manager of Henderson High Income Trust (LON:HHI). In these sectors, “earnings are typically more resilient in an economic slowdown,” he adds.

    With global stock markets having largely fixated on growth stocks, like the Magnificent Seven, for the past decade and more, the defensive sectors that make up much of the UK’s stock market have become relatively undervalued.

    “We have been finding new investment opportunities in domestically orientated cyclical areas, such as industrials, advertising and staffing,” says Wright, “while also selectively adding back exposure to real estate stocks and housing related names, where demand appears to be stabilising and valuations remain attractive.”

    While the retail sector is much-maligned, for contrarians like Wright now is the perfect time to buy in. He explains that FSV has been increasing its exposure to “retailers specialising in big-ticket items such as kitchens and sofas, where sales are 10% to 25% below historical volumes.” Improving growth outlooks and the prospect of falling interest rates, he says, could lift this sector in the future.

    “We believe the company can continue to take share in a fragmented market,” says Luke. “The shares trade on a mid-teens price-earnings ratio with a dividend yield of around 4%, and this has typically been supplemented by an additional annual special dividend given the strength of the balance sheet.”

    Why the UK economy is appealing across all sectors

    Stepping back, there are broader structural reasons that make the UK an appealing market for investment trust managers, across all sectors.

    “There are a number of reasons to invest in the UK now,” says Smith. “The starting valuation of the UK equity market is low and trading at a discount to its long-term average and other global indices, especially the US, helping to absorb negative sentiment around trade tensions.”

    Smith adds that the UK is not a large exporter to the US, so the impact of tariffs is relatively lower. That is also helped by the UK-US trade agreement reached week, which reduces the tariffs applied to some car exports to the US to 10%.

    “The tariff shock is happening at a time when the outlook for UK-listed companies is improving, energy and food prices are falling, pressures on the UK consumer are easing, while the labour market remains healthy and savings are elevated,” says Luke.

    “UK equities are valued attractively, especially compared to US equities, and UK equities have been consistently overlooked by international investors. It may be that, having monopolised investment returns for years, the attractions of the US equity market are beginning to wane.”

    « Older posts Newer posts »

    © 2025 Passive Income

    Theme by Anders NorenUp ↑