Dave Baxter explains what cautious investors need to think about when building an ISA portfolio, and assembles a hypothetical portfolio of 10 funds.
24th March 2026
by Dave Baxter from interactive investor
Building an ISA for different market conditions has felt like a hugely daunting task, even in calmer times.
But with conflict on the agenda, plus the prospect of renewed inflation and disruptive themes such as the rise of artificial intelligence (AI), putting together a portfolio to weather different conditions looks especially trying.
One approach is to avoid making too many knee-jerk reactions and instead focus on having a mix of assets that roughly corresponds to your goals and sense of risk. Defining the latter, and working out a broad asset allocation, is a good first step.
In this three-part series, we look at what kind of portfolio ISA investors might build in accordance with broad risk appetites. This first piece looks at how an ISA portfolio might shape up for a cautious investor.
The cautious approach
“Cautious” is a very subjective term, but here we look at those investors who largely want to protect their capital without going for too much growth. That might include those in retirement.
The levels could be dialled up and down, but for argument’s sake we land on the idea that a cautious investor would have a very limited 20% of their portfolio in “conventional” equity exposure.
That leaves 40% of the portfolio in bonds and 40% of the assets in so-called alternatives. The bond allocation might prove controversial, and we explore that later.
A few rules of thumb can help you determine how your portfolio might be invested. One approach (and there are many different ones) is to take your age and subtract that number from 100. The resulting number should tell you what percentage of your portfolio to have in equities.
But there are plenty of nuances, and you should generally invest in line with how much time you have to ride out the ups and downs of stock markets, as well as how well you can deal with such volatility psychologically.
Some core options
Investors who want to take a hands-off approach, or to put most of their money into a core holding, do have plenty of options available to them.
Having set their asset allocation, they could always use a tracker fund, or a couple of them, to get a core equity exposure.
When it comes to investing more defensively there are various options.
which holds a mixture of “defensive” fixed-income instruments including government and investment-grade corporate bonds. There are also physical gold exchange-traded funds (ETFs).
Investors also have catch-all funds that could house their entire investment or serve as the core of their portfolio, from Vanguard’s (UK-heavy) LifeStrategy offerings to rival franchises from iShares and others, including interactive investor’s very own Managed ISA range.
A set of options with special relevance to cautious investors are, meanwhile, the risk-obsessed “wealth preservation” names Ruffer Investment Company RICA
Below, we outline the rough asset allocations used by those wealth preservation teams as of late.
Wealth preservation allocations
Capital Gearing
Ruffer
Personal Assets
Equities
24
34.6
38
Corporate bonds
13
0
0
“Nominal” government bonds
15
42.2
21
Index-linked government bonds
45
5.3
27
Gold, precious metals and related exposure
1
4.8
10
Cash
2
2
4
Credit and derivative strategies
0
9.4
0
Commodities
0
1.6
0
Source: Recent factsheets. Based on funds’ own definitions.
That all seems simple enough, although there are of course question marks around any kind of “set and forget” fund or portfolio. There is no free lunch. And as our own selection shows, trade-offs have to be made for those trying to build a defensive portfolio.
A cautious portfolio
The hypothetical cautious ISA portfolio is fairly straightforward, although a focus on simplicity does mean it has just 10 holdings and looks relatively concentrated on the surface.
Investors could, if they wished, dial up some of these exposures (for example to a broad bond or gold fund), or add in the likes of a wealth preservation fund on a big weighting, and use some of the more niche names as satellite holdings on lower allocations.
We have opted for a chunky exposure to bonds, at 40%, which allows for pretty diversified allocations here.
Mentioned earlier, the iShares Global Aggregate Bond ETF has around half its portfolio in government debt and a good amount of exposure to corporate bonds with high credit quality ratings.
offering exposure to UK government bonds of different maturities, an inflation-linked UK bonds ETF, and the MI TwentyFour AM Dynamic Bond I Acc.
The latter stands out because it delves into more esoteric parts of the bond market (such as mortgage-backed securities) and has achieved a decent yield, and return, from this. It should act as a diversifier against both equities and the other bond exposure, although it does have its own risks.
The hope with a 40% bond allocation is that investors get a decent mix of exposures to an asset class that has had a rocky few years, but where yields are high enough (and valuations low enough) to offer some protection.
Government bonds are in theory meant to perform well when stocks sell off – but any environment involving higher inflation and interest rates alters the dynamic.
We have seen such concerns mount recently, with the yield on the UK 10-year government bond hitting its highest level since 2008 amid conflict in the Middle East.
What to do about such concerns? An index-linked bond fund such as the one in the table tends to perform better than its “nominal” equivalent when inflation expectations rise. But it’s also extremely vulnerable if interest rates rise on the back of that.
Commodities might hold their own in an inflationary environment, and theoretically real assets (such as property, targeted by Schroder Real Estate) should hold up better too. That’s because inflation can limit property development (and boost valuations), while some property leases tend to have inflation linkage baked in.
Also included is Janus Henderson Absolute Return I Acc: while many of its peers have disappointed, this fund has done well to protect investor cash over the years.
The fund has a mixture of long equity positions and shorts, where it bets on a share price falling, and a highly diversified portfolio. It will tend to lag markets in buoyant years, as with its roughly 7% return in 2025, but holds up well when markets struggle.
The fund ended 2022, a year where the MSCI World index lost around 8% in sterling terms, relatively flat.
Back in February, the team noted that it saw long “opportunities” in financials, aerospace and defence stocks and duration-sensitive assets such as utilities, real estate, and high-quality housebuilder stocks, while looking at companies operating in areas such as hotels and leisure as possible short targets thanks to impending cost inflation.
We don’t class it as equity for the purposes of this exercise, although it does boost an investor’s exposure to shares.
Given that the equity exposure in the portfolio is low, we stick with a couple of broad options.
which has a highly diversified exposure to the global stock market and doesn’t deviate too wildly from the MSCI World index, but does have some allocation to private markets. The fund has been pretty steady and served as a good core holding.
Like many of its peers, F&C is quite US-heavy, and with that in mind we also include an MSCI World ex-USA fund. That has decent allocations to Japan, the UK and Europe, although our equity exposure doesn’t capture emerging markets.
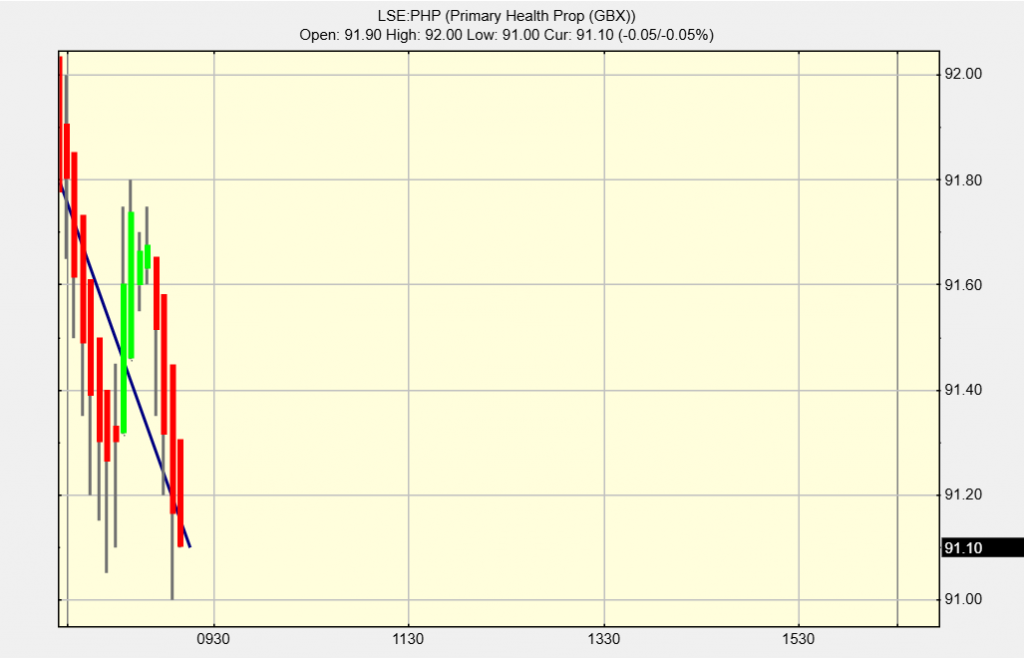
Primary Health Properties — Internal and external momentum
Primary Health Properties (PHP) has reported 2025 results in line with market expectations, with adjusted EPS of 7.3p comfortably covering DPS of 7.1p (+3%). The company has entered 2026 with strong momentum in both organic rental income and the integration of Assura, and management targets a 2026 fully covered DPS of 7.3p (the 30th consecutive year of growth). 83% of the expected £9m cost synergies have been put in place and plans are well advanced to reduce leverage back to within the targeted range ahead of previous expectations, including an expansion of its primary care joint venture (JV) and establishing a new strategic JV for the private hospital portfolio.
Written by
Martyn King
Director, Financials. Property and Insurance
2025 was transformational for PHP, with the acquisition of Assura offering significant financial and strategic benefits. It created a c £6bn portfolio of long-leased, sustainable healthcare infrastructure assets. These are principally let to government tenants and leading UK healthcare providers, underpinned by demographic trends and supported by government policy. Since then, PHP has made impressive progress with integration and realisation of cost synergies, which will solidly underpin 2026 earnings.
The £1.6bn consideration for Assura included £0.4bn in cash and a key focus is returning the immediate post-transaction loan-to-value (LTV) ratio from 57% at end-2025 to PHP’s medium-term 40–50% target. Good progress has been made with the transfer of further assets to the existing primary care JV with USS and a new private hospital JV, likely to release c £700m of cash, substantially meeting the LTV target. Both are expected to complete around mid-2026. For its £700m private hospital portfolio, PHP has received offers from four credible counterparties and is considering which provides the best balance between delivery and the potential for further growth in what is an attractive healthcare property segment. PHP enjoys significant liquidity headroom, with cash and collateralised undrawn loan facilities of more than £0.6bn after capital commitments.
Organic rental growth continues to increase, adding c £9m or c 3% to the annualised rent roll, which reached £342m. The continued acceleration of open market rent reviews (60% of the rent roll) is particularly encouraging. New asset management and development projects are starting to see rents being rebased upwards, making them economically viable while providing crucial evidence for future rent review settlements across the wider portfolio.
With valuation yields stabilising, rental growth is also generating capital growth. EPRA NTA of 99p/share was 4p lower than at end-2024 but increased 2p on a pro forma basis, excluding the expected acquisition effects. We will review the financial report in detail (which now includes Assura) but expect no change to our EPS, DPS or EPRA NTA forecasts despite changes to the earnings composition.
Paid for research by Edison, currently in the SNOWBALL at least until after the xd date.
Octopus Renewables – Final Results to 31 December 2025
24 March 2026
LEI: 213800B81BFJKWM2JV13
Octopus Renewables Infrastructure Trust plc
(“ORIT” or the “Company”)
Full Year Results
Disciplined capital allocation and active portfolio management in a challenging operating environment
Octopus Renewables Infrastructure Trust plc, the diversified renewables infrastructure company, announces its audited results for the year ended 31 December 2025 (“FY 2025”).
As at 31 December 2025 (FY 2025)(audited)
As at 31 December 2024 (FY 2024)(audited)
NAV per Ordinary Share (p)
93.8
102.6
Ordinary Share price (p)
61.1
68.0
Dividends declared per Ordinary Share (p)
6.17
6.02
Dividend cover
1.14x
1.24x
Net asset value (“NAV”) (£m)
494.8
570.4
Gross asset value (“GAV”) (£m)1
896.9
1,028.8
NAV total return in the year
-2.8%
+2.5%
Total shareholder return
-1.5%
-18.3%
Generation (including compensation from curtailment) (GWh)
1,304
1,240
Revenue (operational portfolio) (£m)
138.8
131.7
EBITDA (operational portfolio) (£m)
88.3
85.5
FY 2025 Financial Highlights
· Declared dividends of 6.17 pence per share (“pps”), meeting the FY 2025 target (FY 2024: 6.02pps)
o Increased for the fourth consecutive year
o Represents a dividend yield of 10.1% against the 31 December 2025 closing share price
· Dividends fully covered by cash flows generated from the operational portfolio
· In-line with progressive policy, increased dividend target of 6.23pps announced for FY 2026
· Approximately 88% of revenues fixed over the two-year period to December 2027
· Provides strong protection against near-term market volatility and supporting predictable cash generation
· NAV of £494.8 million (FY 2024: £570.4 million), reduction reflecting sector-wide valuation pressures, largely driven by lower power price and green certificate assumptions
· Cost of debt reduced to 3.3% at year-end (FY 2024: 4.0%) following several proactive measures taken
FY 2025 Operational Highlights
Overall operational performance improved year on year across all three key metrics
· Generation and revenue each grew by 5%, and EBITDA by 3%
· Reflects greater control over operational performance across the portfolio during FY 2025
· Value-enhancement programme launched across the portfolio to identify and deliver long-term value accretive opportunities
Ongoing active portfolio management
· In February 2025, the Company announced it committed an additional €3.4 million (£2.8 million equivalent) to Nordic Generation (“Norgen”), a specialist developer focused on the Finnish wind and solar market
· In June 2025, the conditional acquisition of ORIT’s sixth Irish solar site was announced
· In October 2025, the sales of interest in HYRO Energy Limited and stake in Simply Blue offshore wind platform were announced
· In December 2025, the Company announced the disposal of a 49% stake of its full ownership in the 67 MW Breach solar farm in Cambridgeshire, and the disposal of 51% (ORIT’s entire holding) in the 46 MW Crossdykes onshore wind farm in Scotland
Proactive debt management
· Revolving credit facility (“RCF”) maturity extended to June 2028 and size reduced from £270.8 million to £150 million
· Signed a new £100 million five-year term-loan facility and repaid £98.5 million on the RCF
Capital allocation strategy executed and ‘ORIT 2030’ announced
· ‘ORIT 2030’ a strategic roadmap for growth was announced in September 2025 with four objectives:
o Grow: Invest for NAV growth
o Scale: Build a larger, more investable company
o Return: Deliver attractive risk-adjusted total returns
o Impact: Scale with purpose and resilience
· Over FY 2025, ORIT completed asset sales totalling £74.3 million (including deferred components), against a stated target of £80 million. These disposals were agreed at or above carrying value.
· ORIT has now recycled a total of approximately £235 million since its capital recycling programme began in June 2023, the highest proportionate amount of the peer group compared to the Company’s size
· As at 31 December 2025, the Company had deployed approximately £26 million of its £30 million share buyback programme
· The remaining £4 million remains available to be used, subject to market conditions and capital allocation priorities.
Phil Austin, Chair of Octopus Renewables Infrastructure Trust plc, commented: “The year under review was characterised by disciplined capital allocation and active portfolio management in a challenging operating environment. Against a backdrop of power price volatility, higher-for-longer interest rates and evolving regulatory considerations, the Board remained focused on positioning ORIT for long-term resilience and growth, while continuing to deliver sustainable income to shareholders. Despite these actions the Company delivered a negative total return over the year, driven by sustained pressure on valuations.
“Whilst the prevailing discount remained a frustration the Company continues to focus its efforts on the actions that present the most effective means of supporting long-term shareholder value.
“FY 2025 marked a period of considered action across strategy, governance and cost management, all taken with shareholders’ interests firmly in mind and within the context of our ORIT 2030 strategy launched in September to guide the Company’s future direction.
“The ORIT 2030 strategic framework provides a clear structure for capital allocation and portfolio development over the medium term. The actions taken during FY 2025, particularly in relation to capital recycling, operational optimisation and capital structure discipline, are consistent with the early execution of this strategy.”
Annual Report and Accounts
To view the Company’s Annual Report and Accounts please visit ORIT’s website here:
There will be a virtual presentation for sell-side analysts today at 11am. Please contact Burson Buchanan for details on octopus@buchanan.uk.com.
The Company’s management team will also provide a live presentation via the Investor Meet Company platform, today at 1.30pm. The presentation is open to all existing and potential shareholders. Questions can be submitted at any time during the live presentation and a recording will be made available on demand after the presentation has concluded. Investors can sign up to Investor Meet Company for free here:
1.A measure of total asset value including debt held in unconsolidated subsidiaries, but excluding any outstanding equity or debt commitments.
2.The dividend target stated in this announcement is a target only and not a profit forecast. There can be no assurance that this target will be met, or that the Company will make any distributions at all and it should not be taken as an indication of the Company’s expected future results. The Company’s actual returns will depend upon a number of factors, including but not limited to the Company’s net income and level of ongoing charges. Accordingly, potential investors should not place any reliance on this target and should decide for themselves whether or not the target dividend is reasonable or achievable. Investors should note that references in this announcement to ‘dividends’ and ‘distributions’ are intended to cover both dividend income and income which is designated as an interest distribution for UK tax purposes and therefore subject to the interest streaming regime applicable to investment trusts.
About Octopus Renewables Infrastructure Trust
Octopus Renewables Infrastructure Trust (“ORIT”) is a London-listed closed-ended investment company incorporated in England and Wales focused on providing investors with an attractive and sustainable level of income returns, with an element of capital growth, by investing in a diversified portfolio of renewable energy assets in Europe and Australia. As an impact fund, ORIT is helping accelerate the transition to net zero by investing in green energy, whilst also contributing to a broader set of UN Sustainable Development Goals through its impact initiatives. ORIT’s investment manager is Octopus Energy Generation. Further details can be found at: www.octopusrenewablesinfrastructure.com.
About Octopus Energy Generation
Octopus Energy Generation is driving the renewable energy agenda by building green power for the future. Its specialist renewable energy fund management team invests in renewable energy assets and broader projects helping the energy transition, across operational, construction and development stages. The team was set up in 2010 based on the belief that investors can play a vital role in accelerating the shift to a future powered by renewable energy. It has a 14-year track record with approximately £7.0 billion of assets under management (AUM) (as at 31 December 2025) across 21 countries and with a total c.4.9 GW capacity under management. Octopus Energy Generation is the trading name of Octopus Renewables Limited. Further details can be found at: www.octopusenergygeneration.com.
Page number references in this announcement refer to pages in the Company’s simultaneously published Annual Report and Accounts.
Chair’s Statement
Introduction and overview
The year under review was characterised by disciplined capital allocation and active portfolio management in a challenging market environment. Against a backdrop of power price volatility, higher-for-longer interest rates, evolving regulatory considerations and ongoing geopolitical uncertainty, the Board remained focused on positioning ORIT for long‑term resilience and growth, while continuing to deliver sustainable income to shareholders. Despite these actions the Company delivered a negative total return over the year, driven by sustained pressure on valuations – primarily lower power price and green certificate assumptions, increased discount rates and the impact of the Renewables Obligation Certificate (“ROC”) indexation moving from the Retail Prices Index (“RPI”) to the Consumer Prices Index (“CPI”). In response to the proposed changes to ROC indexation, the Board made a formal submission to the consultation, emphasising that stable and predictable policy frameworks are critical to attracting long-term capital into renewables infrastructure, as well as maintaining investor confidence in the asset class.
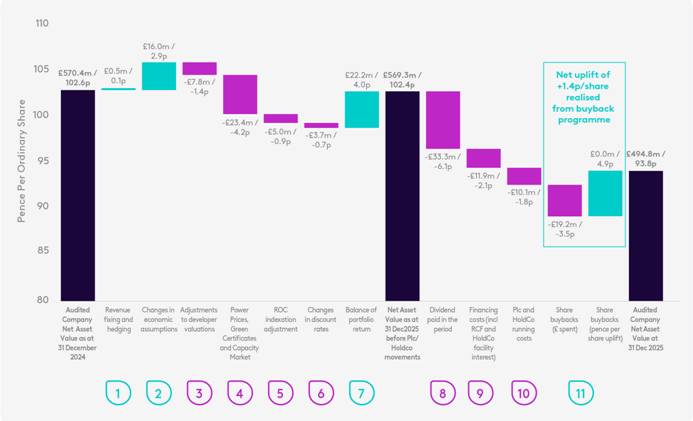
As at 31 December 2025, the Company’s Net Asset Value (“NAV”) stood at £495 million, or 93.8 pence per Ordinary Share, compared with a market capitalisation of £322 million – a discount of approximately 35%. While parts of the global infrastructure market have shown signs of recovery, UK listed renewables continue to trade at elevated discounts, averaging approximately 39% across the peer group at 31 December 20251. ORIT’s discount reflects this broader sector de-rating, driven by higher interest rates, downward valuation adjustments and the uncertainty posed by the UK policy changes proposed by the UK Government late last year and confirmed in January. The Board is frustrated with the prevailing discount and continues to focus on the actions that present the most effective means of supporting long-term shareholder value.
Throughout the year, the Board worked closely with the Investment Manager, providing challenge and oversight while maintaining a clear focus on near-term priorities and long-term positioning for the Company. FY 2025 marked a period of considered action across strategy, governance and cost management, all taken with shareholders’ interests firmly in mind and within the context of the ORIT 2030 strategy which was formally launched in September to guide ORIT’s future direction. Details of these actions follow later in my statement.
Capital allocation, portfolio optimisation and gearing
During the financial year, there was a distinct focus on decisive capital allocation, with clear objectives set in March 2025. Over the 12-month period ORIT completed asset sales totalling £74.3 million (including deferred components), just shy of its target of £80 million. These disposals were agreed (including deferred components) at or above the assets’ net asset value and demonstrate the Investment Manager’s ability to successfully execute transactions in challenging market conditions.
Since the Company began recycling capital in 2023, it has sold seven assets for approximately £235 million at a weighted average uplift of 9%, representing one of the most significant programmes in the UK listed renewables sector relative to its NAV. Capital recycling remains a core component of ORIT’s strategy. By selectively realising assets to support goals to deleverage, as well as investing capital into opportunities with stronger growth potential, the Company can enhance portfolio resilience, improve capital efficiency and drive long-term value creation.
During the year, ORIT repurchased c.28 million Ordinary Shares for a total consideration of £19.2 million, increasing NAV per Ordinary Share by 1.4 pence. As at 31 December 2025, the Company had deployed approximately £26 million of its £30 million share buyback programme. The Board continues to assess buybacks alongside other strategic priorities, ensuring that capital is allocated in a way that supports long-term shareholder value while maintaining appropriate liquidity and a prudent capital structure.
Alongside asset sales, ORIT proactively addressed debt management during the period, with several measures significantly reducing the cost of debt to 3.3% at year-end (2024: 4.0%). While absolute debt reduced over the period, the downward pressure on valuations meant that the leverage ratio remained broadly flat year on year at 45% of GAV.
The Board and Investment Manager remain committed to gearing target of 40% over the medium term. However, shareholders should expect gearing to fluctuate around this level as we balance disciplined debt reduction with selective reinvestment alongside other actions that help us deliver our ORIT 2030 strategy, as detailed later in my statement.
1 Peel Hunt Investment Companies Data Sheet, 2 January 2026
Financial performance and dividends
Revenue quality remains a key strength of ORIT’s portfolio. Approximately 88% of revenues over the two-year period to December 2027 are fixed through power purchase agreements and government support schemes, providing strong protection against near-term market volatility and supporting predictable cash generation. This high proportion of contracted income continues to be market leading1 amongst peers across the listed renewables investment company sector.
While the year-end negative NAV return was impacted by multiple valuation headwinds, the underlying portfolio continues to deliver robust cash generation. The Board remains committed to its progressive dividend policy, with a core focus on ensuring that dividends are fully covered by operational cash flow on an annual basis.
The Company declared total dividends of 6.17 pence per share, meeting its FY 2025 target in full and representing an increase on the prior year. Dividends were fully covered by cash flows generated from the operational portfolio, with dividend cover of approximately 1.14x. An increased dividend target of 6.23 pence per share has been announced for the current financial year (“FY 2026”), reflecting confidence in the underlying cash-generating capability of the portfolio.
Operational performance and asset management
Total generation was 1,304 GWh, materially improved on the prior year, but slightly below budget as favourable solar conditions were offset by below-average wind speeds. Actions taken during the year included enhancements to asset availability, targeted remediation and maintenance programmes, blade optimisation initiatives and the progression of battery co-location opportunities at selected sites. These measures are expected to support more stable output and enhance returns over time. Active asset management also played a key role in mitigating controllable losses and managing operational risk as well as supporting improvements in underlying portfolio yield, reflecting the Investment Manager’s continued focus on targeted value-enhancing measures.
Through close oversight of contractors and targeted interventions at asset level, ORIT continued to maximise net energy production and improve performance consistency. Lifecycle management initiatives, including upgrades, repowering and hybridisation, are helping to extend asset life and future-proof performance across the portfolio.
Market context and portfolio resilience
Energy markets during the year continued to be shaped by power price volatility and revisions to external reference curves, particularly downward adjustments to medium- and long-term power price forecasts. These factors created valuation headwinds for renewable infrastructure assets across the sector. Regulatory outcomes also presented challenges, as illustrated by the UK Government’s decision to change the indexation applied to ROC revenues, which has placed further pressure on sector valuations.
Despite periodic shifts in global political rhetoric, European energy policy continues to demonstrate strong alignment between energy security, climate objectives and economic resilience. Renewable capacity is being built out across the continent as governments prioritise domestic energy supply and long-term infrastructure investment. ORIT operates within this supportive policy framework, which remains anchored in structural energy security and decarbonisation goals.
The accelerating build-out of data centres and increased electrification across economies – including AI-driven demand from hyperscale operators – is contributing to a structural increase in power demand, reinforcing the strategic importance of reliable renewable generation across Europe.
Against this backdrop, ORIT’s portfolio has demonstrated relative resilience. The high proportion of contracted and inflation-linked revenues has helped insulate cash flows from short-term market volatility, while diversification across geographies, technologies and asset stages has reduced concentration risk and smoothed performance through varying market and weather conditions.
The Board has maintained rigorous oversight of valuation processes and assumptions, all of which are subject to independent review and challenge. While short-term NAV movements reflect prevailing market conditions, the Board remains confident in the robustness of the valuation methodology and the long-term fundamentals of the portfolio, particularly in light of successful asset sales at or above net asset value, and benchmarking of comparable assets.
1 Peer-group analysis, Jefferies report.
Governance, oversight and board composition
Strong and proportionate governance remains central to ORIT’s ability to execute its strategy effectively. During the year, the Board devoted significant time to overseeing capital allocation decisions, valuation processes and risk management, while maintaining constructive challenge of the Investment Manager. A key development was the revision of the Company’s investment management fee arrangements, switching from NAV-based fees to a blend of market capitalisation and NAV, improving alignment with shareholders and delivering a reduction in ongoing costs. From the inception of this change on 1 November 2025, this has saved ORIT shareholders £150k, which equates to an approximate annualised cost saving of c.£1 million.
Non-Executive Director James Cameron will stand down from the Board at the forthcoming AGM in June 2026. The Board would like to thank James for his contribution and service. The Board does not intend to appoint a replacement at this time, reflecting a desire to maintain an appropriately sized Board and demonstrate cost discipline, while continuing to keep succession planning and skills coverage under regular review.
ESG and stewardship
Environmental, social and governance (“ESG”) considerations remain integral to ORIT’s approach to long-term value creation and risk management. ORIT is classified as an Article 9 fund, reflecting its core objective of contributing to environmental and social outcomes alongside delivering sustainable returns. ESG factors are embedded across asset management and capital allocation decisions, supporting portfolio resilience and alignment with the Company’s long-term objectives.
Alongside financial performance, ORIT continues to deliver tangible benefits in the communities where it operates. During the year, community benefit funds, local engagement initiatives and partnerships focused on education and skills supported positive social outcomes and helped strengthen long-term relationships around portfolio assets.
Strong governance and active stewardship underpin this approach. The Board maintains oversight of ESG risks and opportunities to ensure consistent standards are applied across the portfolio and that sustainability considerations are integrated into decision-making. Further detail on ESG performance, community initiatives and impact outcomes is set out elsewhere in this report.
ORIT 2030 strategy and outlook
ORIT’s 2030 strategic framework, announced in September 2025, provides a clear structure for capital allocation and portfolio development over the medium term. The actions taken during FY 2025 – particularly in relation to capital recycling, operational optimisation and debt management – are consistent with the early execution of this strategy.
Since the year end, geopolitical tensions in several regions have intensified, contributing to heightened volatility in global energy markets and further reinforcing the importance of secure and resilient domestic power generation across Europe. Over the medium term, ORIT’s diversified portfolio, contracted revenue profile and active asset management all provide important mitigants against prolonged market volatility. The Company remains focused on navigating this environment through selective capital recycling, disciplined reinvestment and the continued development of flexibility initiatives such as battery co-location, positioning the portfolio to adapt as market conditions evolve.
Looking ahead, while near-term market conditions are likely to remain uncertain, the long-term structural drivers for renewable infrastructure remain compelling. Policy initiatives such as Clean Power 2030, alongside the continued focus on energy security, decarbonisation and long-term demand for clean power, are supporting the need for new renewable capacity and creating opportunities for competitively priced projects. ORIT is well positioned to navigate this environment through its pan-European diversification, operational focus and clear strategic framework. Progress within the development pipeline during the year, including the award of a Contract for Difference in AR7 at one of our developers, reinforces the depth of opportunity available to the Company as market conditions evolve.
On behalf of the Board, I would like to thank shareholders for their ongoing support and the Investment Manager for their continued commitment. The Board remains focused on delivering long-term value through the execution of ORIT 2030 and driving actions to support NAV growth over time.
1 How do you assess ORIT’s overall performance in 2025, given the challenging backdrop for listed renewables?
2025 saw sustained pressure on valuations driven by higher discount rates and downward revisions to power price assumptions, alongside a more cautious investor backdrop. These valuation headwinds contributed to ORIT’s first year of negative NAV total return, reflecting market conditions.
For ORIT, this environment reinforced the importance of decisive action at the company level, including asset sales and capital recycling, alongside a continued emphasis on active portfolio management. Our core focus for the year has been on protecting income, maintaining balance sheet resilience and positioning the portfolio to support NAV growth over the long term.
While operational performance from the portfolio was below budget by 7%, there was a marked improvement over the prior year (below by 13%) (as highlighted on pages 24 to 29). On a weather-normalised basis, we were encouraged by the year-on-year improvement in the portfolio generation against budget; testament to the technical asset management that has been delivered and improvements made to availability. Overall output increased in the period, and the cash flows produced-supported by a high proportion of contracted revenues-allowed us to deliver fully covered dividends.
We are also pleased with how we tracked against the capital allocation objectives we set out earlier in the year. Against a challenging backdrop, we completed ~£74 million in asset sales – all at NAV or slightly above (at a time when many market participants have found disposals difficult) – and renegotiated portions of our capital structure to bring down the cost of debt.
2 What does active management mean for ORIT?
Active management for ORIT is about making deliberate, forward-looking choices rather than simply responding to events. On the asset side in 2025, this meant prioritising interventions with the greatest long-term impact, strengthening performance visibility and accelerating resolution of underperformance. On the financial side, it meant actively managing leverage, debt costs and liquidity to preserve flexibility in an uncertain environment. These decisions are often incremental rather than transformational in any single year, but collectively they shape the portfolio’s resilience, risk profile and ability to compound value over time. Our aim is not simply to manage assets, but to actively steward capital through the cycle.
3 How are you thinking about capital allocation and the role of construction in driving future NAV growth?
With capital scarce across the sector, efficient deployment has become paramount. Our approach is to be highly selective – protecting our capital structure first, funding high-conviction opportunities next, and returning capital where appropriate. Capital recycling has played an important role in this, allowing us to crystallise value, and as we move through our ORIT 2030 strategy, redeploy proceeds into areas with stronger growth potential. This might include increasing exposure to co‑located battery storage and repowering opportunities within the existing portfolio, where we can enhance asset flexibility, extend asset life and capture additional value from system volatility.
Looking forward, we are increasingly excited about investing more in construction – returning to what has historically been a core part of our strategy – through which we believe a meaningful portion of future NAV growth will be generated. Construction assets offer the opportunity to capture value through taking on construction risk and then managing the asset to operational stage through disciplined delivery and risk management. ORIT benefits from OEGen having deep expertise and experience in construction, and is well-placed to deliver on this higher-growth strategy which forms a core component of the ORIT 2030 strategic priorities.
4 How does ORIT’s platform support confidence in the long-term strategy, despite current sector challenges?
The listed renewables sector is in a challenging period, but we remain confident in the long-term fundamentals of renewable infrastructure. Demand for cleaner, lower-cost power, system flexibility and energy security continues to grow, irrespective of short-term market cycles. Through ORIT, we can add capacity and help meet these needs, delivering benefits for consumers while supporting the transition to net zero.
While the asset class is long-term in nature, delivering sustainable growth requires near-term agility and proactive portfolio management. We have demonstrated this through our actions during the year and remain confident that this approach will strengthen ORIT’s foundations for long-term value creation.
Furthermore, OEGen’s deep sector specialism gives ORIT access to more than 150 energy professionals across development, construction, asset management and optimisation. This scale and depth of expertise is increasingly important as the system evolves to require greater flexibility through storage, smart optimisation and co-located solutions, and positions ORIT to capture potential value-creation opportunities in areas such as battery storage. In addition, our proximity to the wider Octopus Energy group provides valuable insight into how renewable assets interact with end consumers and power markets in practice.
The ORIT 2030 strategy launched in September 2025 provides a clear framework for navigating the current environment that the sector is in. ORIT will place a strong focus on growth through strategic capital allocation, active management and value creation. While progress will not be linear, we believe this approach positions the Company to grow NAV sustainably as market conditions normalise, whilst continuing to offer a progressive dividend.
Operating Assets: Supporting Income
Top ten operating assets by capacity (pro-rata)
Site name
Technology
Country
Description
Pro rata capacity(MW)1
Start of operations
Remaining asset life (years)
Stake %1
Fidorfe2
Solar
Ireland
Fidorfe is a 68 MW solar farm that forms part of the operational Ballymacarney complex – the largest solar complex in Ireland. Fidorfe benefits from a 15-year fixed price offtake with Microsoft.
68
18/12/2023
38
100%
Ballymacarney2
Solar
Ireland
Ballymacarney is a 54 MW solar farm that forms part of the operational Ballymacarney complex that also benefits from a 15-year fixed price offtake with Microsoft.
54
18/12/2023
38
100%
Cumberhead
Onshore Wind
UK
Cumberhead is a 50 MW onshore wind farm in South Lanarkshire, Scotland. The site has a PPA with Kimberly-Clark.
50
31/03/2023
27
100%
Muckerstown2
Solar
Ireland
Muckerstown is a 48 MW solar farm that forms part of the operational Ballymacarney complex that also benefits from a 15-year fixed price offtake with Microsoft.
48
18/12/2023
38
100%
Harlockstown2
Solar
Ireland
Harlockstown is a 42 MW solar farm that forms part of the operational Ballymacarney complex.
42
23/09/2024
39
100%
Lincs
Offshore Wind
UK
Lincs Wind Farm is a 270 MW offshore wind farm located 8 kilometres (5 miles) off the coast of Skegness, England. ORIT and the Octopus Energy Generation-managed Octopus Renewables Infrastructure SCSp fund together own 31% of the windfarm through an SPV, which has a PPA with Centrica.
42
31/10/2013
23
15.50%
Suolakangas
Onshore Wind
Finland
Suolakangas is a 38 MW onshore wind farm in North Finland. The site has a 100% hedged PPA contract for 2026 with Eesti Energia and is investigating ancillary service potential for 2027.
38
29/12/2021
26
100%
Leeskow
Onshore Wind
Germany
Leeskow is a 35 MW onshore wind farm in Germany. The site holds a 20-year, fixed-rate EEG contract backed by the German state for full production.
35
30/09/2022
27
100%
Saunamaa
Onshore Wind
Finland
Saunamaa is a 34 MW onshore wind farm in North Finland. The site has a 100% hedged PPA contract for 2026 with Eesti Energia and is investigating ancillary service potential for 2027.
34
28/08/2021
26
100%
Breach3
Solar
UK
Breach solar is a ground-mounted, utility-scale solar farm with a capacity of 67.4 megawatts peak, located in Burwell, Cambridgeshire. The site has a PPA with Iceland Foods.
34
25/06/2024
38
51%
Note: Shaded rows indicate exited in the year.
1 As at 31 December 2025.
2 Note that these five sites are sometimes (in this report and elsewhere) collectively referred to as ‘the Ballymacarney solar complex’.
3 ORIT owned 100% of this asset until 30 December 2025, when it exited 49%. At year-end ORIT held (and continues to hold) 51%.
Remaining operating assets
Site name
Technology
Country
Pro rata capacity (MW)1
Start of operations
Remaining asset life (years)
Stake %1
Ermine Street
Solar
UK
32
29/07/2014
19
100%
Kilsallaghan2
Solar
Ireland
29
18/12/2023
38
100%
Abbots Ripton
Solar
UK
25
28/03/2014
28
100%
Cerisou
Onshore Wind
France
24
15/11/2022
27
100%
Wilburton 2 (Mingay)
Solar
UK
19
29/03/2014
18
100%
Westerfield
Solar
UK
13
25/03/2015
19
100%
Chisbon
Solar
UK
12
03/05/2015
25
100%
Ollieres 1
Solar
France
12
19/03/2015
29
100%
Arsac 2
Solar
France
12
05/03/2015
17
100%
Arsac 5
Solar
France
12
30/01/2015
16
100%
Wiggin Hill
Solar
UK
11
10/03/2015
14
100%
Ollieres 2
Solar
France
11
19/03/2015
28
100%
Chalmoux
Solar
France
10
01/08/2013
28
100%
Fontienne
Solar
France
10
02/07/2015
29
100%
Istres
Solar
France
8
18/06/2013
27
100%
Saint Antonin du Var
Solar
France
8
28/11/2013
28
100%
Cuges
Solar
France
7
17/04/2013
27
100%
Ottringham
Solar
UK
6
07/08/2013
29
100%
Charleval
Solar
France
6
26/03/2013
27
100%
La Verdière
Solar
France
6
27/06/2013
27
100%
lovi 1
Solar
France
6
17/07/2014
29
100%
lovi 3
Solar
France
6
17/07/2014
29
100%
Brignoles
Solar
France
5
26/06/2013
27
100%
Penhale
Solar
UK
4
08/03/2013
27
100%
Crossdykes3
Onshore Wind
UK
NA
30/06/2021
NA
NA
Note: Shaded rows indicate exited in the year.
1 As at 31 December 2025.
2 Note that these five sites (see prior page) are sometimes (in this report and elsewhere) collectively referred to as ‘the Ballymacarney solar complex’
3 ORIT owned 51% of this asset until 30 December 2025, when it exited its entire holding.
Weighted average remaining asset life by capacity
Technology
Years
Onshore wind
26.5
Offshore wind
22.7
Solar
31.4
Total
29.7
Developer Portfolio: Supporting Capital Growth
Our developer portfolio is a core driver of ORIT’s long-term growth strategy, providing the future pipeline of construction-ready projects that will underpin value creation across the decade.
Simply Blue Group
• 4% stake• Floating offshore wind• UK, Europe
2025 marked a pivotal year for Simply Blue as ORIT completed a partial sale of the floating offshore wind platform, reducing capital intensity while retaining a small position in the remaining projects. The transaction delivered c. £5 million proceeds to ORIT (£3 million upfront and £2 million through deferred proceeds), while governance and capital structure were significantly simplified. The 100 MW Salamander project achieved planning approval and secured a new lead partner to take it forward. In addition, the 100 MW Erebus project secured a Contract for Difference (CfD) in the UK’s AR7 auction in January 2026, marking a significant de-risking milestone for the platform. With ORIT now holding a small continuing interest, Simply Blue will no longer be included in the Company’s published pipeline metrics.
Nova sustainable fuels
• 22.5% stake• Sustainable e-Fuels• Canada
Following the carve-out of the e-Fuels business (Nova) from Simply Blue, Nova made strong progress on its Nova Scotia sustainable aviation fuel project during 2025. The project design was advanced and long-term supply of sustainable biomass was secured with a major forestry partner. The team is also preparing the next phase of funding, planned for 2026, to continue development. Nova remains well positioned as demand for low-carbon aviation fuels grows in North America.
Wind2
• 25% stake• Onshore wind• UK
Wind2 continued development activity across its 1 GW+ pipeline during the year. A number of planning submissions are now complete, and several sites are expected to reach determination during 2026. The first of these has been negative, with Kirkton being denied consent by the Scottish Minister. A number of projects in Wales and Scotland either received ‘gate 2’ offers as part of the grid reform process, or are expected to qualify for protected grid offers should they receive consent. This provides a pathway for ready-to-build status from 2029 onwards.
BLC Energy
• 100% stake• Solar and BESS• UK
BLC has maintained strong momentum, with five projects totalling 394 MW now submitted for planning approval and currently awaiting decisions. While the UK grid reform process has extended timelines across the sector, BLC’s focus on larger, higher-quality sites and their positioning within the reformed grid queue is expected to support improved delivery certainty. The most advanced BLC projects could reach ready-to-build status later this year, subject to the timing of final planning and grid outcomes. Post-period, an additional £1.2 million of funding was committed, taking the total commitment to £4.7 million.
Nordic Generation
• 30% stake• Solar and Onshore wind• Finland
Nordic Generation continued to progress its strongest projects, with the first targeting ready-to-build in 2026. The updated plan forecasts around 1 GW reaching ready-to-build by the end of 2030 after two sites were removed due to defence restrictions. The team is now focusing on advancing the most mature projects and supplementing the pipeline through selective acquisitions. Also during the year, Nordic Generation supplemented its pipeline through the transfer of project rights of three advanced onshore wind projects totalling up to 800 MW of additional capacity, supporting a more de‑risked route to delivery alongside its existing development activity.
HYRO
• 25% Stake• Green Hydrogen• UK
ORIT exited HYRO in 2025 following the sale of the Northfleet hydrogen project, receiving proceeds in line with valuation. HYRO will not feature in future developer reporting.
Metrics
5
c. 3.3 GW
2026
Developer investments
Combined pipeline of renewable projects
First project expected to reach Ready‑to-Build (“RTB”)
Figure 1: Breakdown of pipeline capacity by stage (GW)
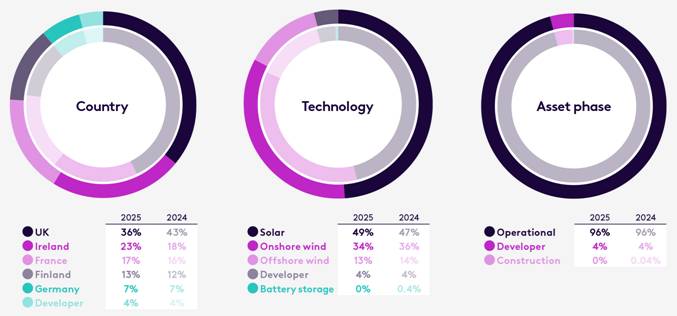
Portfolio composition on a total value of all investments and by MW basis in line with the Company’s investment policy as at 31 December 2025. The investments are valued on an unlevered basis and including amounts committed but not yet incurred.
Portfolio breakdown by total value of all investments (£m)
Year-on-year changes in country exposure primarily reflect the partial disposal of the UK Breach solar asset and the sale of ORIT’s 51% interest in the Crossdykes wind farm, reducing the UK weighting and increasing the relative share of continental European assets.
Technology mix movements primarily reflect the exit from the Woburn Road battery storage asset and modest rebalancing following the Breach and Crossdykes disposals.
Asset phase movements reflect the exit from the Woburn Road battery project, leaving no assets under construction at year end. Construction exposure is expected to increase over time as the ORIT 2030 strategy prioritising higher-growth construction investments is progressed.
Note: Outer ring as at 31 December 2025, inner ring as at 31 December 2024
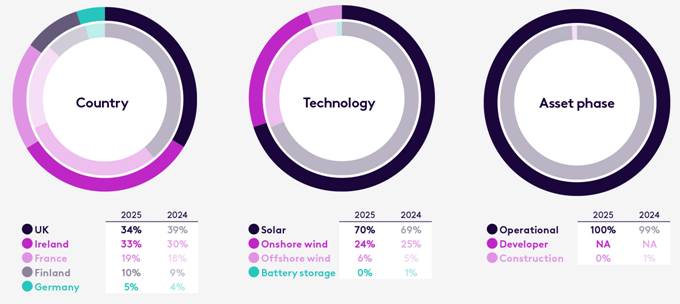
740 MW
Capacity owned
Portfolio composition broken down by MW of capacity pro rata for ORIT’s ownership on a current invested basis as at 31 December 2025
Portfolio breakdown by capacity (MW)
Year-on-year changes in country exposure primarily reflect the partial disposal of the UK Breach solar asset and the sale of ORIT’s 51% interest in the Crossdykes wind farm, reducing the UK weighting and increasing the relative share of continental European assets.
Technology mix movements primarily reflect the exit from the Woburn Road battery storage asset and modest rebalancing following the Breach and Crossdykes disposals.
Asset phase movements reflect the exit from the Woburn Road battery project, leaving no assets under construction at year end. Construction exposure is expected to increase over time as the ORIT 2030 strategy prioritising higher-growth construction investments is progressed.
Note: Outer ring as at 31 December 2025, inner ring as at 31 December 2024
£908m
Total value of all investments
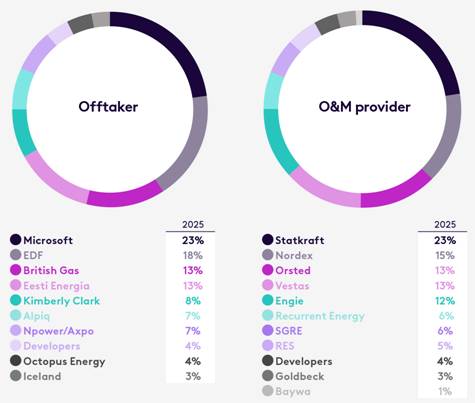
Portfolio composition broken down by offtaker and O&M providers as a percentage of total value of all investments as at 31 December 2025.
Having multiple offtakers offers advantages such as risk diversification and offers local expertise in ORIT’s key geographical markets.
A diversified group of O&M providers allows ORIT to leverage competitive pricing and specialised expertise.
Totals may not add up due to rounding
Capital Allocation in 2025
ORIT’s capital recycling programme, launched in 2023 as part of a broader capital allocation strategy, has remained a central focus over the financial year and in March 2025 ORIT set out three capital allocation objectives. Progress against each objective is outlined below.
Objective
2025 Update
Commentary
£20m buyback extensionAnnounced in March 2025, taking the programme to £30 million
£19.2m spent
Over the year the Company bought back 28,081,835 shares adding 1.4 pence to NAV per share. This brings the total to £26.0 million since the programme began.
Realise at least £80m from asset salesBy the end of FY 2025 to fund capital allocation initiatives together with making selected accretive investments
£74m realised
During 2025, the Investment Manager completed asset disposals generating proceeds of approximately £74 million (of which £4.3 million represent deferred components), in line with its capital recycling programme. These transactions support the underlying asset valuations and provide capacity to reduce debt and reinvest into higher-growth opportunities aligned with the ‘ORIT 2030’ strategy. ORIT continues to progress discussions with prospective buyers for additional assets and maintains its partnership with Tokyo Century through the Breach project.
<40% leverage targetBring total gearing down to below 40% GAV by year end
45%
The gearing ratio ended the year broadly flat year on year. However, over the period total debt reduced by £56.3 million to £402.1 million from £458.4 million. During the year, £100 million of borrowings were refinanced into a lower-cost facility, reducing the Company’s blended cost of debt from 4.0% to 3.3%. Disposal proceeds and portfolio cash generation were used to fund repayments across the Group’s revolving credit and project-level debt facilities. Despite the reduction in absolute debt, gearing was broadly unchanged as NAV and GAV also declined over the year. We continue to view c.40% gearing as an appropriate anchor for the Company, with further reductions expected as disposal proceeds are received and applied.
Company Developments During 2025
Portfolio activity – Investments
Portfolio activity – Exits
June
Conditional acquisition of sixth Irish solar siteAgreed to conditionally acquire a 32.6 MW Irish solar site for €27 million through a forward purchase agreement. This project, Irishtown, is the sixth at the Ballymacarney complex, and will increase total capacity by 14% to 274 MW. Construction is ongoing and progressing in line with the project plan. ORIT is expected to complete the purchase after operational testing in the second half of 2026. No capital is required until then.
December
Sale of stake in Breach solar and of entire holding in Crossdykes onshore windCompleted the sale of 49% of the 100% interest in Breach solar farm, and of the entirety of the 51% holding in Crossdykes onshore wind, with pricing at a modest uplift to holding value.
April
Simply Blue Group carve outSimply Blue Group’s Canadian sustainable fuel project was carved out to form Nova Sustainable Fuels (“Nova”), with new investment provided by two other funds managed by Octopus Energy Generation; ORIT retains a 22.5% stake in the Nova business.
October
Sale of Interest in HYROCompleted the sale of its entire interest in HYRO Energy Limited, a UK-based green hydrogen and e-fuels development platform, for a total expected consideration of £4.6 million, in line with the latest holding value. £2.6 million was received immediately, with the remainder contingent on the delivery of key construction milestones for HYRO’s first project, which has recently received planning consent.
March
Follow-on investment into BLC Energy LimitedMade a follow-on investment of £1.5 million into BLC Energy Limited (“BLCe”), a renewable energy development company, specialising in developing solar PV and co-located battery storage projects across the UK. This follows the initial investment on 31 July 2023, where ORIT secured preferential rights for development funding to the new pipeline. The new funding will support BLCe’s most advanced projects, leveraging the UK’s reformed grid queue process.
October
Sale of stake in Simply Blue’s offshore wind platformORIT’s investee company, Simply Blue, agreed to sell 80% of its offshore wind development arm to Kansai Electric, in line with ORIT’s valuation. The deal follows the carve-out of Nova and enabled partial repayment of ORIT’s shareholder loan, and leaves ORIT with a minority interest in the platform.
February
Norgen commitmentCommitted an additional €3.4 million (£2.8 million equivalent) to Nordic Generation (“Norgen”), a specialist developer focused on the Finnish wind and solar market and converted its existing holding into a direct 30% stake in the integrated Norgen development business.
MarchDebt managementThe Company signed a £100 million, five-year term loan facility on attractive terms, with net proceeds used to pay down the RCF. At the same time the RCF was reduced in size from £270.8 million to £150 million and the maturity extended to June 2028.
Portfolio Performance
Figure 3: Performance of Company’s underlying operational investments
Output1
Revenue
Opex
EBITDA
Operational portfolio
1,304 GWh
£138.8m
£50.4m
£88.3m
+5% vs 2024
+5% vs 2024
+9% vs 2024
+3% vs 2024
-7% vs budget
-4% vs budget
-1% adverse to budget
-6% vs budget
(2024: 1,240 GWh)
(2024: £131.7m)
(2024: £46.2m)
(2024: £85.5m)
Solar
537 GWh
£60.2m
£15.6m
£44.7m
+18% vs 2024
+15% vs 2024
+17% vs 2024
+15% vs 2024
-2% vs budget
-0.1% vs budget
-1% adverse to budget
+0.3% vs budget
(2024: 457 GWh)
(2024: £52.2m)
(2024: £13.3m)
(2024: £38.9m)
Onshore wind
615 GWh
£36.8m
£11.0m
£25.7m
+2% vs 2024
-9% vs 2024
+13% vs 2024
-16% vs 2024
-11% vs budget
-9% vs budget
-0.2% % adverse to budget
-13% vs budget
(2024: 631 GWh)
(2024: £40.3m)
(2024: £9.7m)
(2024: £30.6m)
Offshore wind
151 GWh
£41.7m
£23.8m
£17.9m
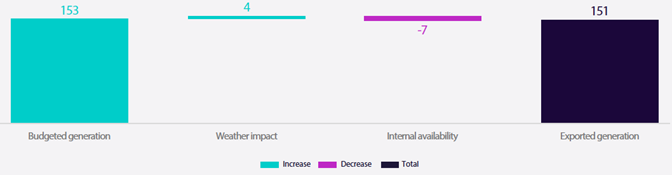
-1% vs 2024
+6% vs 2024
+3% vs 2024
+12% vs 2024
-2% vs budget
-5% vs budget
-2% adverse to budget
-10% vs budget
(2024: 153 GWh)
(2024: £39.2m)
(2024: £23.2m)
(2024: £16.0m)
Note: Totals may not add up due to rounding.
1 Generation quoted is post-compensation (actual output + compensation for equivalent lost production ORIT is entitled to under curtailment and/or contractual mechanisms).
Commentary
Operations
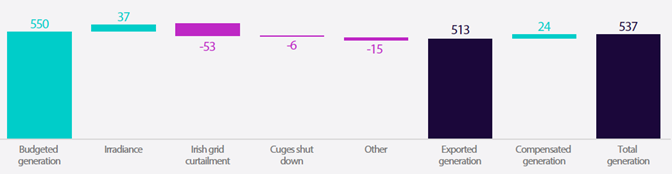
In 2025, ORIT’s compensated generation increased by 5.1% year-on-year (from 1,240 GWh to 1,304 GWh), but was 6.5% below budget, equivalent to a shortfall of 90.2 GWh.
On a weather-normalised basis (i.e adjusted for variations from expected wind and solar resource), portfolio performance in 2025 was 4.9% below budget. After further adjusting for Irish grid curtailment, generation was 2.6% below budget. This represents a material improvement compared with the prior year, when weather-normalised performance was 9.3% below budget, reflecting greater control over operational performance across the portfolio during FY 2025 compared to the prior year.
Revenues of £138.8 million were achieved in the year under review (2024: £131.7 million), representing an increase year-on-year driven by higher output, albeit 4% below budget. Overall Opex amounted to £50.4 million in the year (2024: £46.2 million), less than 1% adverse to budget. The resulting total EBITDA, across ORIT’s operational portfolio, was £88.3 million, slightly up on the previous year (2024: £85.5 million), but 6% below budget.
During FY 2025, ORIT benefitted from a full year of operations from the five Irish solar assets that were acquired in 2024, helping to increase solar output by 17.7% (from 456.6 GWh to 537.4 GWh) year on year.
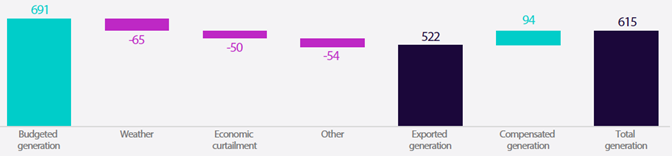
Onshore wind generation dropped by 2.4% (or 17 GWh) over the same period; however, it is important to note that the 2024 generation included 67 GWh contributed by the Swedish wind asset, which was sold in Q3 2024.
Most of the variance versus budget in 2025 was driven by factors outside ORIT’s operational control, primarily grid curtailment in Ireland. This resulted in 52.5 GWh of lost generation, of which 17.3 GWh was compensated during the year. As noted in the 2025 Interim Report, there remains potential for the full curtailment losses to be compensated, subject to the outcome of the ongoing proceedings before the Court of Justice of the EU later this year, representing upside which is not included in the portfolio valuations. Adverse weather conditions were the second most significant factor, contributing to 23.6 GWh of lost generation. While solar irradiance was favourable, delivering an additional 36.9 GWh, this was more than offset by below-average wind speeds, which reduced output by 60.5 GWh.
Strong contractual protections across the portfolio mitigated much of the remaining losses. This was most evident in the onshore wind portfolio where, after adjusting for low wind conditions, total gross losses amounted to 104.3 GWh. Of this, 93.6 GWh was compensated under contractual arrangements, leaving only limited residual economic exposure. Across the whole portfolio, this includes discrete operational issues, several of which have now been resolved, including losses from lichen covering panels at the Arsac 2 and Arsac 5 solar sites in France and static bat curtailment at the Cerisou onshore wind asset, which has since been replaced with a dynamic system. Other items, including the repowering of the Cuges solar site after the shutdown, are scheduled to be addressed in 2026.
Improvements and optimisation initiatives
During the period, ORIT launched its dedicated Value Enhancement Programme (“VEP”), establishing a formal, portfolio-wide framework to identify and deliver long-term value accretive interventions. The programme targets hybridisation, co-location, repowering, life-extension and strategic upgrade opportunities, enabling systematic prioritisation of initiatives that enhance resilience and risk-adjusted returns. Early workstreams are already under way, including repowering assessments at the UK ROC solar assets, and hybridisation analysis at the Leeskow wind farm in Germany.
Operational excellence remains a central focus. A transformer-health triage process is being deployed across the UK solar fleet to support condition-based asset management, inform spares strategies and guide repowering decisions. On the wind portfolio, we partnered with a data expert to employ automated performance and component health monitoring. This is complemented by a new energy-yield benchmarking tool, enabling more granular diagnostics and continuous benchmarking of performance. Our compliance capability was further strengthened through the introduction of an automated Curtailment Compliance Tool to monitor alignment between National Grid instructions, site response and forecasting. Additionally, a Blade Management System, which integrates turbine-level analytics, structured annual inspections and centralised repair planning has been rolled out in 2025. A portfolio-wide blade-repair tender is currently in progress to secure consistent pricing and improved commercial terms.
Targeted interventions delivered measurable value, most notably at the Mingay solar farm in the UK, where the team worked with our partners to successfully convert an 83-day static DNO outage into a 35-day dynamic curtailment regime, materially reducing (1) the length of the downtime, and (2) the impact of the downtime by allowing partial export. ORIT continued to benefit from OEGen’s cross-fund scale and procurement leverage. A cross-fund initiative secured a recovery of nearly €2 million for defective modules for ORIT, following earlier unsuccessful stand-alone warranty claims. Similarly, OEGen’s coordinated engagement with two external asset managers – who oversee several ORIT sites as well as assets across the wider OEGen portfolio – is improving accountability, reporting quality and responsiveness. This collective approach strengthens commercial negotiation power, enhances issue-management processes and enables consistent delivery standards across ORIT’s assets.
Alongside these initiatives, the HSE programme continued to reinforce strong operational standards across the portfolio. Contractor and site audits were completed at Breach, with Cumberhead scheduled next, supporting contractor accountability, environmental compliance and the continued embedding of a robust safety culture.
Note: Totals may not add up due to rounding.
Figure 4: 2025 solar output variance to budget (GWh)
Figure 5: 2025 onshore wind output variance to budget (GWh)
Figure 6: 2025 offshore wind output variance to budget (GWh)
Case study
Protecting revenue through active curtailment management
In Q4 2025, the 19 MWp Mingay Farm was impacted by a grid outage to facilitate substation upgrade works by the distribution network operator, UK Power Networks (“UKPN”). The outage was originally expected to last over three months, posing a risk to revenue and breaching the project’s loan covenant, which restricts the duration of grid export interruptions. Through early and sustained engagement with UKPN, the outage period was successfully reduced to 45 days, running from 6 October 2025 to 19 November 2025. To minimise the impact, the asset management team implemented a dynamic curtailment strategy, enabling the site to export energy based on daily export limits issued by UKPN. Working closely with the O&M contractor, export caps were remotely adjusted each day to align with available grid headroom. As a result, the site exported c. 432 MWh, generating c. £85k in revenue, income that would otherwise have been lost under a zero-export scenario. This approach ensured compliance with lender requirements and protected revenues, without any additional capital expenditure.
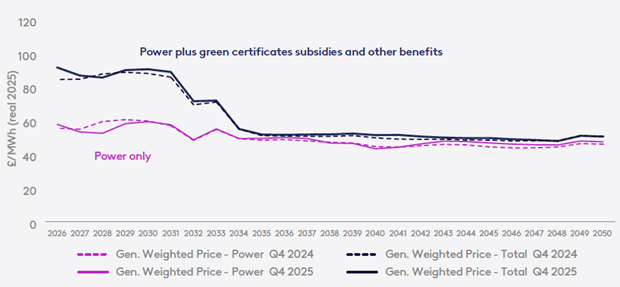
Generation-weighted price
The combination of forward market prices and independent long-term power price forecasts, together with the power purchase agreements (“PPAs”) which the Investment Manager has originated, make up the portfolio’s forecast power only generation-weighted price (“Power only GWP”). The total generation-weighted price, is derived by including subsidies and additional benefits, such as green certificates (“Total GWP”). The Power only GWP and Total GWP for the period to 2050 are shown in Figure 7. The curves are blended across the markets in which the portfolio’s generation assets are located, weighted by the portfolio generation mix and converted into £/MWh. On average, the graph shows power only GWP of £55.99/MWh (real 20) in the period 2026-2030 and £47.67/MWh in the period 2031-2050. Movements in the portfolio’s Power only GWP and Total GWP have been limited both due to the revenue hedges which the Investment Manager has proactively executed across the portfolio as well as the diversification exhibited across the portfolio.
Figure 7: Generation-weighted price forecast
A summary of the capture price discounts utilised in the assets’ valuations is presented below in Figure 8. The percentages are the average differences between the generation-weighted and time-weighted power prices. These assumptions are provided by third party advisors and use site-specific assumptions for onshore and offshore wind.
Figure 8: Baseload price and capture discount forecasts
Value
Market
Technology
Units
2025-2029
2030-2034
2035-2039
2040-2044
2045-2050
Baseload price
GB
£/MWh (real 2025)
72
72
68
66
Capture price discount
GB
%
25%
25%
25%
28%
Capture price discount
GB
%
11%
18%
21%
25%
25%
Capture price discount
GB
%
9%
17%
21%
23%
24%
Baseload price
FR
EUR/MWh (real 2025)
78
82
79
75
Capture price discount
FR
%
12%
12%
Capture price discount
FR
%
42%
41%
41%
43%
Baseload price
FI
EUR/MWh (real 2025)
49
63
65
66
65
Capture price discount
FI
%
17%
19%
22%
22%
22%
Baseload price
DE
EUR/MWh (real 2025)
82
78
Capture price discount
DE
%
25%
29%
Baseload price
I-SEM
EUR/MWh (real 2025)
89
89
Capture price discount
I-SEM
%
22%
23%
Note: Values in the above table are not shown where the relevant asset has no merchant exposure in three or more years in the relevant period.
Portfolio revenue forecasts
Figure 9 presents ORIT’s forecast revenues through to 2050, categorised by price structure. The revenues are categorised as fixed via either subsidy (Fixed – Subsidy) or fixed price PPA (Fixed – Power) and the variable revenues derive from power being sold on a merchant basis (Variable – Power) or from other sources of variable revenue (Variable – Other).
88% of ORIT’s forecast revenues for the 24 months up to 31 December 2027 are fixed, which represents an increase of four percentage points compared with ORIT’s position 12 months ago due to continued revenue hedging across ORIT’s Finnish and GB portfolio despite asset disposals (Breach and Crossdykes). On a present value basis 49% of the portfolio’s value derives from fixed price revenues and 51% from variable price revenues.
All of ORIT’s power price hedges continue to be structured on a pay-as-produced basis. This contrasts with other commonly observed hedge structures – such as baseload or fixed shape hedges – which require the asset to assume additional (often costly) risks, especially during periods of underproduction, given the need to buy back power at the market price in order to deliver under the hedge’s baseload or fixed shape generation profile.
ORIT’s portfolio continues to offer protection against inflation, owing to its high proportion of contractually inflation-linked revenues. These derive from subsidies and inflation-linked corporate PPAs which the Investment Manager has originated, such as the PPA between Breach solar farm and Iceland Foods. Over the 10 years to 31 December 2035, 43% of ORIT’s forecast revenues are inflation-linked. This is a 5 percentage point decrease compared with ORIT’s position 12 months ago, due to:
· Asset sales: sales of stakes in Crossdykes and Breach, both of which benefitted from inflation-linked corporate PPAs
· Regulatory updates: the outcome of the UK government’s ROC indexation consultation confirms that ROC buyout prices will be indexed to CPI, rather than RPI, from April 2026 onwards
· Contractual maturities: the natural progression of the 10-year look-forward period brings the expiry dates of inflation-linked subsidies and PPAs closer to the present.
ROC revenues have been adjusted based on the outcome of the recent UK government’s consultation on ROC indexation, specifying that from April 2026 onwards, indexation will be calculated against CPI rather than RPI. Of the forecast “Fixed – Subsidy” revenues for the 24 months up to 31 December 2027, 56% derive from the ROC buyout. This is equivalent of 28% of total revenues over 24 months, and 24% of total revenues on a ten-year look forward.
Figure 9: Fixed vs variable revenue forecasts (see page 29 of the annual report)
Figure 10: Revenue forecasts by inflation-linkage (see page 29 of the annual report)
Financial Review
The financial statements of the Company for the year ended 31 December 2025 are set out in the Company’s Annual Report. The financial statements have been prepared in accordance with UK-adopted International Accounting Standards in conformity with the requirements of the Companies Act 2006. In order to continue providing useful and relevant information to its investors, the financial statements also refer to the “intermediate holding companies”, which comprise the Company’s wholly owned subsidiary, ORIT Holdings II Limited and its indirectly held wholly owned subsidiaries ORIT UK Acquisitions Limited, ORIT Holdings Limited and ORIT UK Acquisitions Midco Limited.
Net assets
Net assets have decreased from £570.4 million as at 31 December 2024 to £494.8 million as at 31 December 2025, primarily due to a decrease in the fair value of the portfolio of assets as described in the Portfolio Valuation section. The net assets comprise the fair value of the Company’s investments and net current assets, as detailed in the table 16 on the right.
Income
In accordance with the Statement of Recommended Practice: Financial Statements of Investment Trust Companies and Venture Capital Trusts (“SORP”) issued in July 2022 by the Association of Investment Companies (“AIC”), the statement of comprehensive income differentiates between the ‘revenue’ account and the ‘capital’ account, and the sum of both items equals the Company’s profit for the year. Items classified as capital in nature either relate directly to the Company’s investment portfolio or are costs deemed attributable to the long-term capital growth of the Company (such as a portion of the Investment Manager’s fee).
Table 16: Results as at 31 December
2025
2024
£m
£m
Fair value of portfolio of assets
603.2
699.6
Cash held in intermediate holding companies
1.8
7.1
Bank loans and accrued interest held in the intermediate holding companies
-116.2
-151.2
Fair value of other net assets/(liabilities) in the intermediate holding companies
-3.4
5.8
Fair value of Company’s investments
485.4
561.3
Company’s cash
10.8
11.9
Company’s other net liabilities
-1.4
-2.8
Net asset value as at 31 December
494.8
570.4
Number of shares (million)
527.6
555.7
Net asset value per share (pence)
93.79
102.65
Details of the Company’s income can be found in the Statement of Comprehensive Income and supporting notes.
Ongoing charges
The ongoing charges ratio (“OCR”) is a measure, expressed as a percentage of average net assets, of the regular, recurring annual costs of running the Company. It has been calculated and disclosed in accordance with the AIC methodology, as annualised ongoing charges (i.e. excluding acquisition costs and other non-recurring items) divided by the average published undiluted Net Asset Value in the year. For the year ended 31 December 2025, the ratio was 1.22% (2024: 1.21%).
Debt
ORIT continues to actively manage its capital structure in line with its disciplined approach to capital allocation. During the year, £100 million of borrowings were refinanced into a lower-cost facility, reducing the Company’s blended cost of debt from 4.0% to 3.3%. Disposal proceeds and portfolio cash generation were used to fund repayments across the Group’s revolving credit and project-level debt facilities. Despite the reduction in absolute debt, gearing was broadly unchanged as NAV and GAV also declined over the year.
Table 17: Debt summary
2025
2024
Debt as % GAV
45%
45%
% hedged
75%
62%
Average cost of debt
3.3%
4.0%
Average remaining term
10
10
Dividends
During the year, interim dividends totalling £33.3 million were paid (2024: £33.5 million), equivalent to 6.13p per share. Post year end, a further interim dividend of 1.55p per share was paid on 27 February 2026 in respect of the quarter ending 31 December 2025 to shareholders recorded on the register on 13 February 2026. Consequently, dividends totalling £33.0 million have been paid in respect of the year under review. These dividends are fully covered from the operational cash flows of the underlying portfolios.
During 2025, the Company’s net cash flows from operations, of £61.3million pre scheduled debt amortisation, and £37.7 million post scheduled debt amortisation supported the payment of £33.0 million dividends to shareholders for the period, resulting in a dividend coverage of 1.86x and 1.14x respectively.
ORIT’s key portfolio characteristics of diversification, high proportion of fixed revenues and inflation-linkage help maintain a growing, covered dividend.
Following the year-end, in line with the Company’s progressive dividend policy, ORIT announced a further increase in the target dividend to 6.23p1 per ordinary share for the financial year from 1 January 2026 to 31 December 2026. This increase of 1.0% over FY 2025’s dividend target continues the Company’s progressive dividend policy, marking the sixth consecutive year the Company has increased its dividend target. The FY 2026 dividend target is expected to be fully covered by cash flow generated from the Company’s operating portfolios.
1 The dividend target is a target only and not a profit forecast. There can be no assurance that this target will be met, or that the Company will make any distributions at all and it should not be taken as an indication of the Company’s expected future results. The Company’s actual returns will depend upon a number of factors, including but not limited to the Company’s net income and level of ongoing charges. Accordingly, potential investors should not place any reliance on this target and should decide for themselves whether or not the target dividend is reasonable or achievable. Investors should note that references in this announcement to “dividends” and “distributions” are intended to cover both dividend income and income which is designated as an interest distribution for UK tax purposes and therefore subject to the interest streaming regime applicable to investment trusts.
Portfolio Valuation
£495mNet asset value(31 December 2024: £570m)
93.8pNAVper ordinary share(31 December 2024: 102.6p)
£897mGross asset value(31 December 2024: £1,029m)
£908mTotal value of all investments(31 December 2024: £1,029m)
The portfolio of assets is valued quarterly using a discounted cash flow (DCF) approach for operational assets, consistent with the International Private Equity Valuation Guidelines. Developer and early-stage investments are valued at cost or recent price of investment, with adjustments for material changes such as milestone outcomes, further investment rounds or other development that reflect progress or risks. The Company’s NAV therefore reflects movements in market power prices, inflation, discount rates, asset performance, contracted revenues, and development progress across the year.
Including the Company’s and its intermediate holding companies’ net liabilities (which mostly comprise Holding Company debt and cash), the total NAV as at 31 December 2025 is £494.8 million or 93.8 pence per Ordinary Share.
Figure 19: Plc NAV bridge
Movements in the fair value of the underlying portfolio of assets
1 Revenue fixing and hedging £0.5 million (+0.1p per share)
Additional revenue fixing during the year reduced merchant exposure and strengthened near-term cash flow visibility. The year saw ~100% hedging of Otso’s 2026 production and full hedging of UK ROC solar assets for April 2027-March 2028, both secured at attractive pricing relative to market forwards.
2 Changes in economic assumptions £16.0 million (+2.9p per share)
Movements in inflation, foreign exchange and tax produced a net uplift over the year. Higher short-term UK inflation supported inflation-linked revenue, while the weakening of sterling against the euro contributed to valuation gains that were partly offset by hedging. Finnish corporate tax reductions provide a small structural benefit.
3 Adjustments to developer valuations -£7.8 million (-1.4p per share)
For valuation purposes, the following platforms generated material adjustments during the year:
• Norgen: uplift following pipeline consolidation, improved visibility on RTB timing and progress across several priority projects;
• Simply Blue Group: write-down reflecting delays in offshore wind development, liquidity constraints and continued weakness in floating wind markets; and
• Conservative discounts applied to deferred consideration on sales of developer investments, reflecting time value and remaining uncertainty on delivery of milestones – these discounts are expected to unwind as milestones are achieved.
4 Power prices, green certificates and capacity market -£23.4 million (-4.2p per share)
Updating market revenue forecasts resulted in a net valuation reduction, driven mainly by more conservative long-term power price and Green Certificate assumptions, particularly in the UK.
• Power prices – Short-term forward prices fell marginally across ORIT’s core markets as lower gas prices and system fundamentals fed through to 2026-27 curves. Longer-term external consultant forecasts also reduced with adjustments reflecting updated expectations for renewable build-out, demand growth and commodity trends.
• Green Certificates – a negative movement followed the adoption of more conservative long-term green certificate curve more aligned with market pricing.
• Capacity Markets – updated forecasts reflected recent auction outcomes and updates to external long-term assumptions, with only minor valuation impact.
5 ROC indexation adjustment -£5.0 million (-0.9p per share)
The valuation reflects a £5.0 million reduction arising from the outcome of the UK Government’s consultation on the indexation of Renewables Obligation Certificates (“ROCs”), published on 28 January 2026. The Government confirmed that it will adopt option 1, switching indexation of the ROC buyout price from the Retail Price Index (“RPI”) to the Consumer Price Index (“CPI”) effective March 2026. ORIT has therefore reflected the full impact of this change on its NAV as at 31 December 2025.
6 Discount rates -£3.7 million (-0.7p per share)
The weighted average discount rate increased slightly during the year, reflecting elevated long-term interest rates and changes to the portfolio mix following asset sales in the year. Assumptions remain in line with market evidence for contracted renewables. Further information can be found on page 43.
Movements in the fair value of the Plc and holding companies
7 Balance of portfolio return £22.2 million (+4.0p per share)
The expected return on the portfolio of assets represented by the unwind of discounting contributed positively as future cash flows moved closer, but this was partially offset by lower-than-expected operational generation, especially weaker wind resource and uncompensated curtailment in Ireland, as well as updated near-term opex and capex assumptions.
8 Dividends paid -£33.3 million (-6.13p per share)
Dividends totalling £33.3 million in respect of Q4 2024 to Q3 2025 were paid during the 12-month period to 31 December 2025.
9 Financing costs -£11.9 million (-2.1p per share)
Financing costs (incl. RCF and HoldCo facility interest) reduced NAV. Repayment and refinancing into lower-cost facilities reduced RCF utilisation and lowered overall finance costs compared with the prior year.
10 Running costs (plc & HoldCo) -£10.1 million (-1.8p per share)
Management fees and corporate costs at the plc and HoldCo level.
11 Share buybacks -£19.2 million (+1.4p per share)
Share repurchases at a significant discount to NAV were accretive for shareholders on a pence per Ordinary Share basis.
Key valuation assumptions
See below a summary of the key inputs that drive ORIT’s portfolio value
Long-term inflation
Taxation
UK
2.25%1
=
25.0%
=
France
2.00%
=
25.0%
=
Ireland
2.00%
=
12.5%
=
Finland
2.00%
=
18.0%2
↓
Germany
2.00%
=
15.8%
=
↑ Positive change to valuation assumption
= No change
↓ Negative change to valuation assumption
Power price forecasts
Where not fixed under PPAs or hedged, we use forward market prices in the near term before transitioning to a blend of two independent consultants’ long-term forecasts. Capture prices are updated regularly to reflect cannibalisation effects. For solar, we apply generic country-level capture prices, while for wind we reflect site-specific curves to account for greater variation in output and pricing.
Asset lives and decommissioning
Operational lives are assessed on an asset-by-asset basis, taking into account lease terms, planning consents, extension rights and technical performance. We also include decommissioning and land restoration costs as end-of-life outflows, ensuring valuations capture the full lifecycle economics of each project. The valuations do not include any terminal value, despite the potential opportunity for repowering.
1 UK RPI (annual average): 4.0% during 2025, 3.25% to 2029 and then 2.25% from 2030 onwards. The RPI forecasts for 2026 to 2029 were revised upwards during the period from 3.0% to 3.25%.
2 Valuation movement reflects a planned reduction in Finland’s corporation tax rate from 20% to 18%, effective from 2027.
Discount rates
A range of discount rates are applied in calculating the fair value of the investments, reflecting factors such as the location, technology and lifecycle stage of each asset, as well as capital structure and the split of fixed and variable revenues.
As at 31 December 2025, the weighted average discount rate (“WADR”) implied by ORIT’s portfolio valuations was 7.8%, compared with 7.9% as at 30 June 2025. The marginal decrease over the second half of the year reflects portfolio composition changes following asset disposals and asset-specific adjustments, partly offset by updates to Renewables Obligation indexation assumptions.
The WADR does not include the expected return associated with development-stage assets or additional Company-level leverage. Including these elements results in an adjusted average discount rate of 8.2% as at 31 December 2025.
Table 20: Discount rate summary
31 December
30June
31 December
2025
2025
2024
UK Assets
Levered IRR (GBP)
8.1%
8.4%
7.6%
Gross Asset Value (GAV) (£m)
351
467
460
Asset Leverage %GAV
18%
35%
16%
European Assets
Levered IRR (GBP)
7.0%
7.5%
7.2%
Levered IRR (EUR)
6.5%
6.9%
6.6%
Gross Asset Value (GAV) (£m)
546
544
569
Asset Leverage %GAV
41%
43%
42%
Total Portfolio
Levered IRR (GBP)
7.8%
7.9%
7.4%
Levered IRR (local currency)
7.3%
7.5%
7.0%
Gross Asset Value (GAV) (£m)
897
1010
1029
Total Leverage %GAV
45%
47%
45%
Weighted average discount rate as at 31 December 2025
7.8%
(i) Return expected on the Company’s investments into development stage assets
0.3%
(ii) Increase in return associated with the additional leverage from the RCF
0.1%
Adjusted average discount rate as at 31 December 2025
8.2%
Portfolio valuation sensitivities
Details of these can be found in the notes to the financial statements on pages 106 to 108, but are summarised in Figure 21 below.
Figure 21: NAV sensitivities per ordinary share (see page 44 of the annual report)
Risk Management
Risk appetite and risk management
The Board determines the Company’s risk appetite in accordance with the Investment Policy, which sets clear boundaries around the types and levels of risk the Company is willing to accept to meet its investment objectives.
The Board, through the Audit and Risk Committee, carries out a regular review of the risk environment in which the Company operates, changes to the environment and individual risks. The Board also considers emerging risks which might affect the Company. The Company maintains a structured risk management framework which has key inputs from the Company’s key service providers:
• AIFM (Octopus Energy AIF Management Limited)
Oversees portfolio and risk management, maintains the Company’s risk register, and applies stress testing and risk limits.
• Investment Manager (Octopus Energy Generation)
Conducts detailed due diligence, ongoing asset monitoring, and provides regular insights on sector trends, asset-level risks, and emerging issues.
• Broker
Advises on sector developments, peer performance and investor sentiment to inform shareholder engagement.
• Company Secretary and Auditors
Provide guidance on regulatory developments, governance matters and financial reporting risks.
Principal risks and uncertainties
The Board has undertaken a robust assessment of the principal and emerging risks facing the Company as at 31 December 2025. The following pages outline these risks, their current mitigants, and how they have evolved during the reporting period.
How to read this section: Principal risks key
Residual risk rating
Represents the Board’s assessment of each risk after considering existing controls and mitigants.
High risk could have a material impact on NAV, strategic delivery, liquidity, or reputation.
Moderate risk may cause financial or operational disruption but is managed within existing frameworks.
Low risk has limited impact due to strong mitigants or low likelihood.
Direction of movement
Shows how the residual risk rating has changed compared to the prior reporting period.
Increased – Risk level has risen due to external developments or internal reassessment.
No change – Risk exposure and controls remain broadly consistent with the previous period.
Decreased – Risk level has reduced, typically due to improved mitigants or reduced exposure.
Note: These assessments are based on the Company’s structured risk management framework and are reviewed quarterly by the Board and its committees.
1. Share price and market sentiment
2. Asset valuation sensitivity
3. Power markets
4. Gearing and financing
The Company’s shares have continued to trade at a discount to the value of the net assets, reflecting weaker investor sentiment and broader macroeconomic uncertainty. This dynamic limits the Company’s ability to raise equity capital and reduces strategic flexibility – for example, by constraining opportunities to reinvest capital through new opportunities. Persistent sector discounts may also undermine investor confidence and lead to weaker trading liquidity over time.
The valuation of the Company’s portfolio is inherently sensitive to a range of financial assumptions, including long-term inflation, discount rates and future power price forecasts. If these assumptions diverge materially from actual outcomes, the Company’s NAV could be adversely affected.
The Company’s revenues remain partially exposed to wholesale electricity prices through merchant sales and Power Purchase Agreements (PPAs). Power price volatility, driven by supply- demand dynamics, commodity prices and weather trends, can therefore impact income stability. Changes to subsidy regimes or pricing frameworks in the UK and EU also present structural risk.
The Company is exposed to refinancing risk and interest rate volatility, particularly as macroeconomic conditions continue to influence borrowing costs and access to credit. Higher interest rates and a more constrained lending environment may limit flexibility, increase the cost of capital, or create pressure on covenant headroom.
Mitigants:A capital allocation strategy has been implemented through ‘ORIT 2030’. Investor communications have been strengthened to reinforce the investment case and address key market concerns.
Mitigants:Valuations are independently reviewed each quarter and informed by external market consultants. The Company tests key assumptions through regular sensitivity analysis and maintains internal processes to ensure that inputs remain robust and consistent.
Mitigants:The Company maintains a diversified revenue base, combining fixed-price PPAs and subsidy-backed arrangements. OEGen’s Energy Markets team actively monitors forecasts and market conditions, and employs hedging where appropriate to reduce short-term volatility.
Mitigants:The Company follows a disciplined gearing policy, maintains significant liquidity headroom, and has diversified its lending relationships. Covenants are reviewed quarterly and integrated into forward-looking financial planning.
Recent developments:Broader sentiment towards the sector remains conservative. As such, the risk remains elevated and continues to be actively monitored.
Recent developments:There were no material changes to the valuation methodology or key assumptions during 2025. Although market volatility persisted, governance and valuation processes remained stable and the risk level is unchanged.
Recent developments:Power prices have softened during 2025. The Company continued to secure PPAs at competitive rates, and no material changes were made to the hedging strategy. The overall risk level remains unchanged.
Recent developments:While ORIT remains well within its mandated leverage policy, refinancing conditions and interest rate volatility contributed to a maintained moderate risk.In response to tightening market conditions, the Company announced a soft target to anchor gearing to around 40% of GAV through selected asset disposals and funding of construction.
Increased High
No change Moderate
No change Moderate
No change Moderate
5. Asset and operational risk
6. Cybersecurity and IT
7. Environmental, social and governance (“ESG”)
8. Construction and development
Underperformance at the asset level, arising from outages, grid constraints, weather variability or equipment failure, may reduce cash generation and investor returns. Health, Safety and Environment (“HSE”) risks also apply at operational sites.
Cybersecurity threats, including phishing, ransomware, and third-party data breaches, present an ongoing risk to business continuity and sensitive information. Reliance on third-party systems for reporting, data processing and asset management compounds the potential exposure.
The portfolio is exposed to physical risks from climate change, including resource variability, storm events, and extreme weather. Transition risks, such as regulatory shifts, changing investor expectations and supply chain scrutiny, may also impact long-term performance or stakeholder confidence. Governance risks, including key person dependency, conflicts of interest or ineffective oversight, could impair decision-making or the effective management of the Company.
Construction risk across the portfolio is currently minimal, with all operational assets fully commissioned. The Company holds no direct construction exposure in relation to the conditional acquisition of the Irishtown project. However, development risk remains elevated. Challenges such as planning uncertainty, grid access delays, cost inflation, and the performance of development partners can impact project timelines, valuation, or the ability to convert pipeline into operational assets.
Mitigants:Performance is closely monitored by OEGen with the support of third-party O&M providers under structured contracts. Preventative maintenance regimes, robust HSE procedures and comprehensive insurance are in place to manage potential disruptions.
Mitigants:Cybersecurity controls are embedded within service provider contracts. OEGen conducts regular penetration testing, incident response planning, and mandatory staff training to reduce exposure.
Mitigants:ESG is integrated into the investment process via a formal scoring matrix. Climate and physical risk assessments are incorporated into asset monitoring, supported by scenario analysis and HSE reviews. A formal conflicts policy, structured succession planning and regular Board and committee evaluations support effective governance and oversight.
Mitigants:The Company’s financial exposure to development-stage equity is capped at 5% of GAV. All development investments are subject to rigorous due diligence, milestone tracking, and internal approvals. The team continues to monitor planning, permitting, and developer counterparty risk closely across the portfolio.
Recent developments:During 2025, there were isolated instances of underperformance across the portfolio due to external factors, but no ongoing material issues remain. The overall risk level is unchanged, reflecting continued resilience at the asset level, while recognising that the broader operating environment (including weather and grid constraints) remains a source of potential volatility.
Recent developments:Although no cybersecurity incidents have occurred within ORIT or its key service providers during the year, the frequency, complexity and sophistication of cyberattacks reported across the UK and European infrastructure and financial services sectors have increased. In particular, attacks targeting third-party service providers and supply chains have become more prevalent. Given ORIT’s reliance on external systems and data platforms, the Board considers that the inherent threat environment has heightened. Controls and oversight arrangements remain robust, and no control deficiencies have been identified.
Recent developments:There were no material ESG incidents or climate-related disruptions in 2025, and the Company maintained compliance with evolving standards. Although regulatory expectations are rising, controls are considered effective and the residual risk remains stable. During the year, Audrey McNair stepped down as Audit Chair and was succeeded by Sally Duckworth following a planned transition. The Board remains satisfied that its composition, independence and committee structures meet regulatory and governance best practice requirements. The overall risk level remains low and stable.
Recent developments:Construction risk has reduced significantly following the commissioning of all portfolio assets. However, the residual development risk rating increased during 2025 due to continued delays in permitting and grid access across multiple markets, as well as slower-than-anticipated progress in the development pipeline.
No change Moderate
Increased Moderate
No change Low
No change Moderate
9. Regulation and policy
10. Geopolitical risk
ORIT is exposed to changes in energy policy, taxation, market design and investment trust regulation across the UK and Europe. Changes in government priorities or intervention in electricity pricing could adversely affect asset economics, investor sentiment or operating model.
Geopolitical tensions and armed conflicts can create volatility in global energy markets, as well as negatively impact financial market stability and investor sentiment. Events such as the wars in Ukraine and the Middle East demonstrate how geopolitical developments can influence commodity prices, inflation and power market dynamics.
Mitigants:ORIT engages specialist legal and regulatory advisers to monitor developments in key markets and participates in industry consultations to anticipate change. Geographic and revenue diversification reduces concentrated regulatory exposure.
Mitigants:The Company’s diversified portfolio and high proportion of contracted revenues through subsidies and fixed-price PPAs reduce exposure to short-term market disruption. The Investment Manager monitors geopolitical developments and incorporates relevant macroeconomic scenarios into financial planning and risk assessments.
Recent developments:In 2025, the UK Government confirmed it would not proceed with the Review of Electricity Market Arrangements (REMA), removing uncertainty around potential power market reform. The outcome of the ROC indexation consultation (changing from RPI to CPI) also provided clarity on subsidy support for legacy assets. However, shifting political dynamics, including the growth of Reform UK, may influence future policy direction. Regulatory reform also remains active across parts of Continental Europe. The Company continues to monitor policy developments across all jurisdictions in which it operates.
Recent developments:Geopolitical tensions remained elevated during 2025, including the ongoing war in Ukraine and emerging instability in the Middle East. While these developments are being closely monitored, the Company has not experienced direct operational or supply chain impacts and, given the portfolio’s largely contracted revenue profile, no material financial effects are currently expected. The overall risk level therefore remains moderate, although the situation remains under review should conflicts become more prolonged.
Increased Moderate
No change Moderate
Directors’ Report
The Directors present their report and the audited financial statements for the year ended 31 December 2025.
The Directors of the Company who were in office during the year and up to the date of signing the financial statements were:
Philip Austin MBE (Chair)
James Cameron
Sally Duckworth (appointed 21 March 2025)
Elaina Elzinga
Audrey McNair (resigned 13 June 2025)
Sarim Sheikh
Legal and taxation status
The Company is an investment company within the meaning of Section 833 of the Companies Act 2006. The Company conducts its affairs to meet the requirements for approval as an investment trust under section 1158 of the Corporation Tax Act 2010. The Company has received initial approval as an investment trust and the Company must meet eligibility conditions and ongoing requirements for investment trust status to be maintained. In the opinion of the Directors, the Company has met the conditions and requirements for approval as an investment trust for the year ended 31 December 2025.
Market information
The Company’s Ordinary Shares are listed on the main market of the London Stock Exchange. The unaudited NAV Ordinary Share of the Company is published quarterly through a regulatory information service.
Retail distribution of Investment Company shares via financial advisers and other third-party promoters
As a result of the Financial Conduct Authority (“FCA”) rules determining which investment products can be promoted to retail investors, certain investment products are classified as “non-mainstream pooled investment products” and face restrictions on their promotion to retail investors.
The Company has concluded that the distribution of its shares, being shares in an investment trust, is not restricted as a result of the FCA rules described above.
The Company currently conducts its affairs so that the shares issued by the Company can be recommended by financial advisers to retail investors and intends to continue to do so for the foreseeable future.
Articles of Association
Amendments to the Company’s Articles of Association require a Special Resolution to be passed by shareholders. The Company’s Articles of Association were last changed at the time of IPO and new Articles of Association are proposed to be adopted at the upcoming Annual General Meeting to alter the frequency of the continuation vote. For further information, refer to pages 128 and 129 .
Management
The Board
The Board comprises independent non-executive directors who are responsible to Shareholders for the overall stewardship of the Company’s affairs. There is a Schedule of Matters Reserved for the Board which sets out the division of responsibilities between the Board and its various committees. Further details can be found in the Corporate Governance Statement on pages 64 to 73. Through the Committees and the use of external independent advisers, the Board oversees the risk management function and overall governance within the Company. The Board, in conjunction with the AIFM, actively supervises the Investment Manager in the performance of its functions.
Directors’ indemnities
Subject to the provisions of the Companies Act 2006, the Company has agreed to indemnify each Director against all liabilities which any Director may suffer or incur arising out of or in connection with any claim made, or proceedings taken against him/her, or any application made by him/ her, on the grounds of his/ her negligence, default, breach of duty or breach of trust in relation to the Company or any associated Company. This policy remained in force during the financial year and also at the date of approval of the financial statements.
Appointment and replacement of directors
The rules concerning the appointment and replacement of directors are contained in the Company’s Articles of Association which require that each Director shall be subject to election at the first AGM after appointment and re-election annually thereafter. Further details of the Board’s process for the appointment and replacement of Board members can be found on page 66.
Alternative Investment Fund Manager
The Company is classified as an Alternative Investment Fund under the UK AIFM Directive as defined on page 60 and has appointed Octopus Energy AIF Management Limited as its AIFM, which entity is governed by AIFMD and regulated by the Central Bank of Ireland. The AIFM is responsible for portfolio management of the Company, including the following services:
• Risk management, with the exception that portfolio management is delegated to the Investment Manager;
• Approval of quarterly portfolio valuations through the AIFM Valuations Committee;
• The review of financial reporting as prepared by the Administrator;
• Ensuring compliance with the UK AIFM Directive regulations and reporting;
• Ensuring compliance with FATCA reporting requirements; and
• Monitoring and ensuring compliance with Investment Restrictions and policies as set out in the Company’s prospectus.
The arrangements related to management fees changed during the period. For the period from 1 January 2025 to 31 October 2025, The AIFM was entitled to a management fee of 0.95% per annum of the Net Asset Value of the Company up to £500 million and 0.85% per annum of Net Asset Value in excess of £500 million, payable quarterly in arrears. With effect from 1 November 2025, the AIFM is entitled to a management fee calculated by applying the existing percentage rates to an equal weighting of (i) the average closing daily market capitalisation for each quarter and (ii) the published NAV for that quarter. The fee payable will be capped at the lower of (a) the amount calculated under this revised methodology and (b) a calculation based solely on NAV, in line with the previous AIFM agreement. No performance fee or asset level fees are payable to the AIFM under the Management Agreement. The AIFM is responsible for the payment of the Investment Manager’s fees.
The Management Agreement is subject to termination on not less than 12 months’ written notice by either party. It can be terminated at any time in the event of the insolvency of the Company or the AIFM, in the event that the AIFM ceases to be authorised and regulated by the CBI (if required to be so authorised and regulated to continue to carry out its duties under the Management Agreement) or if certain key members of the Octopus Energy Generation team cease to be involved in the provision of services to the Company and are not replaced by individuals satisfactory to the Company (acting reasonably).
The Company has given an indemnity in favour of the AIFM (subject to customary exceptions) in respect of the AIFM’s potential losses in carrying on its responsibilities under the Management Agreement. The Management Agreement is governed by the laws of England and Wales.
Investment Manager
The AIFM has delegated portfolio management services to Octopus Renewables Limited (trading name – Octopus Energy Generation) as Investment Manager to provide Investment Management services to the AIFM in respect of the Company pursuant to the Management Agreement. As part of these delegated portfolio management services, the Investment Manager has responsibility for managing cash not yet invested by the Company or otherwise applied in respect of the Company’s operating expenses with the aim of preserving capital value.
Company Secretary and Administrator
Apex Listed Companies Services (UK) Limited provides company secretarial and administration services to the Company, including but not limited to the calculation of its quarterly Net Asset Value and financial reporting.
Depositary
BNP Paribas S.A. has been appointed as the Company’s depositary.
UK AIFM Directive
In accordance with the UK AIFM Directive, the AIFM must ensure that an annual report containing certain information on the Company is made available to investors for each financial year. The investment funds sourcebook of the FCA (the “Sourcebook”) details the requirements of the annual report. All the information required by those rules are included in this Annual Report or will be made available on the Company’s website.
Appointment of service providers
The Management Engagement Committee undertakes an annual review of the Company’s service providers to evaluate service levels and to develop recommendations for their continued appointment or for the commencement of a process to replace a service provider as appropriate, taking into account the long term interests of the Company’s shareholders. The outcome of the review of the Company’s service providers can be found on page 66.
Issued share capital
During the year ended 31 December 2025, the Company did not issue any further Ordinary Shares. At the year end the Company’s issued share capital comprised 564,927,536 Ordinary Shares, including 37,350,597 held by the Company in treasury.
Voting rights
Each Ordinary Share held entitles the holder to one vote. All Ordinary Shares carry equal voting rights and there are no restrictions on those voting rights. Voting deadlines are stated in the Notice of Meeting and Form of Proxy and are in accordance with the Companies Act 2006.
Restrictions
There are no restrictions on the transfer of Ordinary Shares, nor are there any limitations or special rights associated with regard to control attached to the Ordinary Shares. There are no agreements between holders regarding their transfer known to the Company, no restrictions on the distribution of dividends and the repayment of capital, and no agreements to which the Company is a party that might affect its control following a successful takeover bid.
Dividend policy and target returns
The Company intends to pay dividends on a quarterly basis with dividends typically declared in respect of the quarterly periods ending March, June, September and December and typically paid in May, August, November and February respectively.
Distributions made by the Company may take either the form of dividend income, or of “qualifying interest income” which may be designated as interest distributions for UK tax purposes. Prospective investors should note that the UK tax treatment of the Company’s distributions may vary for a shareholder in the Company depending on the classification of such distributions. Prospective investors who are unsure about the tax treatment which will apply to them in respect of any distributions made by the Company should consult their own tax advisers.
The Company has a progressive dividend policy and is targeting a total dividend of 6.23p pence per Ordinary Share in respect of the financial year to 31 December 2026, representing a 1% increase from the 6.17 pence per Ordinary Share dividend declared in respect of the financial year ended December 2025. This marks the fifth consecutive year the Company has increased its dividend target.1 The Company is targeting a net total shareholder return of 9% to 11% per annum over the medium to long-term. Further information on the Company’s financial objectives can be found on pages 10 to 11.
1 The dividend and return targets stated are targets only and not profit forecasts. There can be no assurance that these targets will be met, or that the Company will make any distributions at all and they should not be taken as an indication of the Company’s expected future results. The Company’s actual returns will depend upon a number of factors, including but not limited to the Company’s net income and level of ongoing charges. Accordingly, potential investors should not place any reliance on these targets and should decide for themselves whether or not the target dividend and target net total shareholder return are reasonable or achievable.
Results and dividend
The Company’s revenue profit after tax for the year amounted to £37.5 million (2024: £36.8 million). The Company made a capital loss after tax of £60.4 million (2024: £25.1 million loss). Therefore, the total loss after tax for the Company was £23.0 million (2024: £11.8 million profit). The Company has paid the following interim dividends during the year under review:
Dividend
per ordinary
Payment
Record
Ex-dividend
Period
share (pence)
date
date
date
Q4 2024
1.51
28 Feb 2025
14 Feb 2025
13 Feb 2025
Q1 2025
1.54
30 May 2025
16 May 2025
15 May 2025
Q2 2025
1.54
29 Aug 2025
15 Aug 2025
14 Aug 2025
Q3 2025
1.54
28 Nov 2025
14 Nov 2025
13 Nov 2025
On 2 February 2026 the Company declared an interim dividend of 1.55p per Ordinary Share in respect of the three months to 31 December 2025, a total of £8.2 million. The ex-dividend date was 13 February 2026, the record date was 14 February 2026 and the dividend was paid on 27 February 2026.
Substantial shareholders
As at 31 December 2025, the Directors have been formally notified of the following interests in the Company’s Ordinary Shares, comprising 3% or more of the issued share capital of the Company:
%
Date of
Shareholder Name
Holding
Holding
notification
Rathbone Investment Management Ltd
41,703,191
7.40
12 Jul 2022
Brewin Dolphin Limited
29,615,256
5.24
7 Jun 2023
Schroders plc
28,294,909
5.01
29 Sep 2023
Baillie Gifford & Co
28,273,333
4.15
1 Apr 2025
EFG Private Bank Limited
28,212,542
4.90
23 May 2025
Quilter PLC
24,261,042
4.29
14 Nov 2022
Sarasin & Partners LLP
26,562,005
4.07
1 Mar 2024
Stichting Privium Sustainable Impact Fund
21,851,529
4.00
22 May 2025
Newton Investment Management Limited
17,288,560
3.06
9 Mar 2021
EdenTree Investment Management
16,067,067
3.05
12 Nov 2025
Post period end up until 17 March 2026, the Company did not receive notification of any further interests, or changes in interests, in its Ordinary Shares comprising 3% or more of the issued share capital.
Based on information provided by analysis of the Company’s share register as at 27 February 2026, the Company is aware that the following shareholders own more than 3% of the issued share capital of the Company:
%
Shareholder Name
Holding
Holding
Hargreaves Lansdown, stockbrokers (EO)
47,764,166
9.05
Schroder Investment Management
35,584,717
6.74
Interactive Investor (EO)
32,528,927
6.17
Evelyn Partners (Retail)
29,443,711
5.58
Privium Fund Management
24,483,793
4.64
EFG Harris Allday, stockbrokers
22,214,473
4.21
Rathbones
22,203,434
4.21
RBC Brewin Dolphin, stockbrokers
19,602,217
3.72
AJ Bell, stockbrokers (EO)
16,742,215
3.17
EO = Execution only
Shareholder engagement
The Board is mindful of the importance of engaging with the Company’s shareholders to gauge their views on topics affecting the Company. See page 54 for further information on how the Company engages with its shareholders.
The Company will be holding an Annual General Meeting on 12 June 2026, which will be streamed live, and at which members of the Board and Investment Manager will be available to answer shareholder questions. Shareholders are encouraged to vote their holdings using the enclosed Form of Proxy or electronically using the instructions contained in the notes to the Notice of AGM and notes to the Form of Proxy. Proxy voting figures will be made available shortly after the AGM on the Company’s website (https://www.octopusrenewablesinfrastructure.com/ ) where shareholders can also find the Company’s quarterly factsheets, dividend information and other relevant information.
Appointment of auditors
The Company’s auditors, PricewaterhouseCoopers LLP, having expressed their willingness to continue in office as auditors, will be put forward for re-appointment at the Company’s Annual General Meeting and the Board will seek authority to determine their remuneration for the forthcoming year.
Going concern
The Directors have considered the Company’s ability to continue as a going concern, taking into account its liquidity position, cash flow forecasts and access to financing facilities. The Directors have assessed the going concern position over a period of at least 12 months from the date of approval of the financial statements and conclude that it is appropriate to prepare the financial statements on a going concern basis. In forming this conclusion, the Directors considered the Company’s ongoing access to liquidity and the resilience of cash flows under plausible downside scenarios.
Further detail on the Directors’ going concern assessment is set out in the notes to the financial statements.
Viability statement
In accordance with the UK Corporate Governance Code and the UK Listing Rules, the Directors have assessed the prospects of the Company over a longer period than the 12 months required for the going concern assessment. The Directors have assessed the viability of the Company over the five-year period to 31 December 2030 (the “Period”). The Board considers this Period to be appropriate given the long-term nature of the Company’s investment strategy and the time horizon over which the Company’s cash flows and capital commitments are forecast.
In assessing the viability of the Company, the Directors considered the principal risks and uncertainties set out in this report, with particular focus on those risks that could impact the Company’s solvency or liquidity over the Period. The assessment included a review of projected income and expenditure, the resilience of the Company’s cash flows under plausible downside scenarios, and the Company’s access to financing.
The Company receives income in the form of dividends and interest from its portfolio of renewable energy infrastructure assets. These revenues are derived primarily from the sale of electricity and green certificates through power purchase or similar agreements, and, in some cases, subsidies. The Directors considered the impact of adverse movements in key variables, including wholesale power prices, asset output and discount rates, and are satisfied that the Company would remain viable under such downside scenarios.
The Directors also considered the Company’s forecast cash outflows, including dividends, capital commitments and contingent acquisitions, together with the Group’s access to debt facilities. While the revolving credit facility held by an intermediate holding company matures in June 2028, the Directors consider that the Company is well positioned, based on the quality of its asset base and its track record, to maintain appropriate access to financing over the Period.
Based on this assessment, the Directors have a reasonable expectation that the Company will be able to continue in operation and meet its liabilities as they fall due over the five-year period to 31 December 2030.
Auditors’ information
Each of the Directors at the date of the approval of this report confirms that:
• so far as the Director is aware, there is no relevant audit information of which the Company’s auditors are unaware; and
• the Director has taken all steps that he/she ought to have taken as director to make himself/herself aware of any relevant information and to establish that the Company’s auditors are aware of that information.
This confirmation is given and should be interpreted in accordance with the provisions of Section 418 of the Companies Act 2006.
Annual General Meeting
The following information is important and requires your immediate attention. If you are in any doubt about the action you should take, you should seek advice from your stockbroker, bank manager, solicitor, accountant, or other financial adviser authorised under the Financial Services and Markets Act 2000.
Resolutions relating to the following items of special business will be proposed at the Annual General Meeting (“AGM”) to be held on 12 June 2026. The Notice of AGM (the “Notice”) together with detailed explanation of the proposed resolutions can be found on pages 125 to 131.
Issuance of ordinary shares and dis-application of pre-emption rights
Resolutions 11 to 13 provide authority to issue Ordinary Shares. The Directors intend to use the net proceeds of any issuance to invest in Renewable Energy Assets, in accordance with the Company’s investment objective and Investment Policy and for working capital purposes.
At the forthcoming Annual General Meeting, the Board is seeking authority to allot up to a maximum of 126,617,745 Ordinary Shares (representing approximately 24% of the Ordinary Shares in issue at the date of this document) and to dis-apply pre-emption rights when allotting those Ordinary Shares. The authority granted under Resolutions 11 to 13 will expire at the conclusion of the Annual General Meeting to be held in 2027. The full text of these resolutions is set out in the Notice of Meeting on pages 125 and 126.
The authority granted by shareholders to issue Ordinary Shares will provide flexibility to grow the Company and further expand the Company’s assets. Ordinary Shares issued under this authority will only be issued at a premium to the NAV (cum income). Ordinary Share issues are at the discretion of the Board.
Authority to purchase own shares
At the AGM of the Company held on 13 June 2025, the Directors were granted authority to make market purchases of up to 14.99% of the Ordinary Shares in issue, equating to a maximum of 84,682,637 Ordinary Shares. The Company utilised this authority to purchase its own shares, buying back c.£12.04 million as at 17 March 2026, which is the last practicable date before this report was printed.
The current authority to make market purchases expires at the conclusion of the 2026 AGM of the Company. The Directors recommend that a new authority to purchase up to 79,083,700 Ordinary Shares (subject to the condition that not more than 14.99% of the Ordinary Shares in issue, excluding treasury Shares, at the date of the AGM are purchased) be granted and a resolution to that effect will be put to the AGM. Any Ordinary Shares purchased will either be cancelled or, if the Directors so determine, held in treasury.
The Companies Act 2006 permits companies to hold shares acquired by way of market purchase as treasury shares, rather than having to cancel them. This provides the Company with the ability to re-issue Ordinary Shares quickly and cost effectively, thereby improving liquidity and providing the Company with additional flexibility in the management of its capital base. No Ordinary Shares will be sold from treasury at a price less than the (cum-income) NAV per existing Ordinary Share at the time of their sale unless they are first offered pro rata to existing shareholders. At the year end the Company held 37,350,597 shares in treasury.
Unless otherwise authorised by shareholders, Ordinary Shares will not be issued at less than NAV and Ordinary Shares held in treasury will not be sold at less than NAV. The Directors take into account the financial resources of the Company, the Company’s share price and any discount to NAV, and future investment opportunities when exercising the authority to purchase the Company’s Ordinary Shares. The authority will continue to only be exercised if the Directors believe that to do so would be in the best interest of Shareholders as a whole.
Authority to declare all dividends as interim dividends
At the AGM of the Company held on 13 June 2025, the Directors were granted authority to declare and pay all dividends of the Company as interim dividends. The Directors intend to ask shareholders to renew this authority at the upcoming AGM.
Adoption of new Articles of Association
The Directors intend to ask shareholders to adopt new Articles of Association to replace the existing five-yearly continuation vote with a three-yearly continuation vote.
Regulatory disclosures – Information to be disclosed in accordance with UK Listing Rule 9.2
The UK Listing Rules requires listed companies to report certain information in a single identifiable section of their annual financial reports. The Company confirms that only UK LR 9.2 (issue of shares) is applicable during the year under review. During the year ended 31 December 2025 the Company did not issue new shares.
For and on behalf of the Board
Philip Austin MBE
Chair
Statement of Directors’ Responsibilities
The directors are responsible for preparing the Annual Report and the financial statements in accordance with applicable law and regulation.
Company law requires the directors to prepare financial statements for each financial year. Under that law the directors have prepared the financial statements in accordance with UK-adopted international accounting standards.
Under company law, directors must not approve the financial statements unless they are satisfied that they give a true and fair view of the state of affairs of the company and of the profit or loss of the company for that period. In preparing the financial statements, the directors are required to:
• select suitable accounting policies and then apply them consistently;
• state whether applicable UK-adopted international accounting standards have been followed, subject to any material departures disclosed and explained in the financial statements;
• make judgements and accounting estimates that are reasonable and prudent; and
• prepare the financial statements on the going concern basis unless it is inappropriate to presume that the company will continue in business.
The directors are responsible for safeguarding the assets of the company and hence for taking reasonable steps for the prevention and detection of fraud and other irregularities.
The directors are also responsible for keeping adequate accounting records that are sufficient to show and explain the company’s transactions and disclose with reasonable accuracy at any time the financial position of the company and enable them to ensure that the financial statements and the Directors’ Remuneration Report comply with the Companies Act 2006.
The directors are responsible for the maintenance and integrity of the company’s website. Legislation in the United Kingdom governing the preparation and dissemination of financial statements may differ from legislation in other jurisdictions.
Directors’ confirmations
Each of the directors, whose names and functions are listed in the Corporate Governance Statement confirm that, to the best of their knowledge:
• the company financial statements, which have been prepared in accordance with UK-adopted international accounting standards, give a true and fair view of the assets, liabilities, financial position and loss of the company; and
• the Directors’ Report includes a fair review of the development and performance of the business and the position of the company, together with a description of the principal risks and uncertainties that it faces.
For and on behalf of the Board
Philip Austin MBE
Chair
Financial Statements
Statement of Comprehensive Income For the year ended 31 December 2025
For the year ended 31 December 2025
For the year ended 31 December 2024
Revenue
Capital
Total
Revenue
Capital
Total
Notes
£’000
£’000
£’000
£’000
£’000
£’000
Investment income
5
42,842
–
42,842
42,541
–
42,541
Movement in fair value of investments
10
–
(59,537)
(59,537)
–
(24,030)
(24,030)
Total net income/(expense)
42,842
(59,537)
(16,695)
42,541
(24,030)
18,511
Investment management fees
6
(3,638)
(1,213)
(4,851)
(4,104)
(1,368)
(5,472)
Other expenses
6
(1,608)
–
(1,608)
(1,563)
–
(1,563)
Net finance income
203
–
203
301
–
301
Profit/(loss) before taxation
37,799
(60,750)
(22,951)
37,175
(25,398)
11,777
Taxation
7
(304)
304
–
(342)
342
–
Profit/(loss) and total comprehensive income/(expense) for the year after taxation
37,495
(60,446)
(22,951)
36,833
(25,056)
11,777
Earnings/(losses) per Ordinary Share (pence) – basic and diluted
9
6.92p
(11.15)p
(4.23)p
6.55p
(4.45)p
2.10p
The “Total” column of this statement is the profit and loss account of the Company. The “Revenue” and “Capital” columns represent supplementary information prepared under guidance issued by The Association of Investment Companies. All expenses are presented as revenue items except 25% of the investment management fee, which is charged as a capital item within the Statement of Comprehensive Income. Costs incurred on aborted transactions and investment acquisitions are charged as capital items within the Statement of Comprehensive Income.
The Company has no other items of other comprehensive income, and therefore the net profit/(loss) after taxation is also the total comprehensive income/(expense) for the year. All revenue and capital items in the above statement derive from continuing operations. No operations were acquired or discontinued in the year.
The notes on pages 93 to 111 form an integral part of these financial statements.
Statement of Financial Position at 31 December 2025
31 December
31 December
2025
2024
Notes
£’000
£’000
Non-current assets
Investments at fair value through profit or loss
10,16
485,430
561,296
Current assets
Trade and other receivables
11
92
23
Cash and cash equivalents
10,775
11,852
10,867
11,875
Current liabilities: amounts falling due within one year
Trade and other payables
12
(1,497)
(2,801)
Net current assets
9,370
9,074
Total assets less current liabilities
494,800
570,370
Net assets
494,800
570,370
Capital and reserves
Share capital
13
5,649
5,649
Share premium
14
217,283
217,283
Special reserve
14
313,222
332,590
Capital reserves
14
(71,746)
(11,300)
Revenue reserve
14
30,392
26,148
Total shareholders’ funds
494,800
570,370
Net assets per ordinary share (pence)
15
93.79p
102.65p
The financial statements on pages 91 to 111 were approved by the Board of Directors and authorised for issue on 23 March 2026 and were signed on its behalf by:
Philip Austin MBE
Chair
The notes on pages 93 to 111 form an integral part of these financial statements.
Registered in England and Wales as a public company limited by shares. Company registration number: 12257608
Statement of Changes in Equity For the year ended 31 December 2025
Notes
Sharecapital£’000
Sharepremium£’000
Specialreserve£’000
Capitalreserve£’000
Revenuereserve£’000
Totalshareholders’ funds£’000
Balance at 1 January 2025
5,649
217,283
332,590
(11,300)
26,148
570,370
Shares bought back and held in treasury
–
–
(19,201)
–
–
(19,201)
Costs on share repurchases
–
–
(167)
–
–
(167)
Profit/(loss) and total comprehensive income/(expense) for the year
–
–
–
(60,446)
37,495
(22,951)
Dividends paid in the year
8
–
–
–
–
(33,251)
(33,251)
Balance at 31 December 2025
5,649
217,283
313,222
(71,746)
30,392
494,800
For the year ended 31 December 2024
Notes
Sharecapital£’000
Sharepremium£’000
Specialreserve£’000
Capitalreserve£’000
Revenuereserve£’000
Totalshareholders’ funds£’000
Balance at 1 January 2024
5,649
217,283
339,500
13,756
22,851
599,039
Shares bought back and held in treasury
–
–
(6,837)
–
–
(6,837)
Costs on share repurchases
–
–
(73)
–
–
(73)
Profit/(loss) and total comprehensive income/(expense) for the year
–
–
–
(25,056)
36,833
11,777
Dividends paid in the year
8
–
–
–
–
(33,536)
(33,536)
Balance at 31 December 2024
5,649
217,283
332,590
(11,300)
26,148
570,370
The Company’s distributable reserve consists of the special reserve, capital reserve attributable to realised gains and revenue reserve.
The issued capital and reserves are fully attributable to the shareholders of the Company. The notes on pages 93 to 111 form an integral part of these financial statements.
Statement of Cash Flows For the year ended 31 December 2025
Year ended
Year ended
31 December
31 December
2025
2024
Notes
£’000
£’000
Cash flows from operating activities
(Loss)/profit before taxation
(22,951)
11,777
Movement in fair value of investments
10
59,537
24,030
Income from investments
5,10
(42,842)
(42,541)
(Increase)/decrease in trade and other receivables
(69)
120
Decrease in trade and other payables
(1,304)
(436)
Dividends received from investments
5
18,000
17,000
Interest received from investments
22,874
22,872
Net cash flow generated from operating activities
33,245
32,822
Cash flows from investing activities
Costs associated with acquiring the portfolio of assets
10
(357)
(577)
Repayments of debt principal1
18,654
10,041
Net cash flow generated from investing activities
18,297
9,464
Cash flows from financing activities
Dividends paid to Ordinary Shareholders
8
(33,251)
(33,536)
Shares bought back and held in treasury
(19,201)
(6,837)
Costs on buybacks
(167)
(73)
Net cash flow used in financing activities
(52,619)
(40,446)
Net (decrease)/increase in cash and cash equivalents
(1,077)
1,840
Cash and cash equivalents at start of year
11,852
10,012
Cash and cash equivalents at end of year
10,775
11,852
The notes on pages 93 to 111 form an integral part of these financial statements.
1 Amounts related to the repayment of the loan investment, previously included within distributions from investments, have been moved from being disclosed as operating to investing activities.
Notes to the Financial Statements For the year ended 31 December 2025
1. General information
Octopus Renewables Infrastructure Trust plc (“ORIT” or “the Company”) is registered in England and Wales as a public company limited by shares (registered number 12257608). The Company’s registered office, and principal place of business, is 4th Floor, 140 Aldersgate street, London EC1A 4HY. The Company is a closed-ended investment company with an indefinite life. The Company commenced its operations on 10 December 2019 when the Company’s shares were admitted to trading on the London Stock Exchange. The Directors intend to continue conducting the affairs of the Company so as to retain its status as an investment trust company for the purposes of section 1158 of the Corporation Tax Act 2010, as amended.
The Company’s investment objective is to provide investors with an attractive and sustainable level of income returns, with an element of capital growth, by investing in a diversified portfolio of renewable energy assets in Europe and Australia.
The Company has a wholly owned direct subsidiary, ORIT Holdings II Limited which invests the funds of the investors in ORIT. The registered office of ORIT Holdings II Limited is UK House, 5th Floor, 146-182 Oxford Street, London, United Kingdom, W1D 1NN.
The Company has appointed Octopus Energy AIF Management Limited to be the alternative investment fund manager of the Company (the “AIFM”), for the purposes of the Alternative Investment Fund Managers Regulations 2013 and the Commission Delegated Regulation (EU) No 231/2013 of 19 December 2012 (as it applies in the UK by virtue of the European Union (Withdrawal) Act 2018). Accordingly, the AIFM is responsible for the portfolio management of the Company and for exercising the risk management function in respect of the Company.
Apex Listed Companies Services (UK) Limited (the “Administrator”) provides administrative and company secretarial services to the Company under the terms of the Administration Agreement between the Company and the Administrator.
2. Basis of financial statements preparation
The financial statements have been prepared in accordance with UK-adopted International Accounting Standards (“IAS”) and the requirements of the Companies Act 2006, as applicable to companies reporting under those standards.
Where consistent with the requirements of IAS, the Directors have sought to prepare the financial statements on a basis compliant with presentational guidance set out in the statement of recommended practice for investment trust companies and venture capital trusts (the “SORP”) issued by the Association of Investment Companies (“AIC”) in July 2022.
The financial statements are prepared on the historical cost basis of accounting, except for the revaluation of investments measured at fair value through profit or loss. They have been prepared on the basis of the accounting policies, significant judgements, key assumptions and estimates as set out below.
The Company has one wholly owned direct subsidiary, ORIT Holding II Limited, whose purpose is to invest the funds of ORIT. The Company and its subsidiary both meet the requirements to be classified as an investment entity as defined in International Financial Reporting Standard 10 “Consolidated Financial Statements”. Consequently, the Company measures its subsidiary at fair value through profit or loss and does not prepare consolidated financial statements.
Going concern
The financial statements have been prepared on a going concern basis under the historical cost convention, as modified by the revaluation of investments held at fair value through profit or loss.
The Directors, in their consideration of going concern, have reviewed comprehensive cash flow forecasts prepared by the Company’s Investment Manager which are based on market data and believe, based on those forecasts, the assessment of the Company’s subsidiary’s banking facilities and the assessment of the principal risks described in this report, that it is appropriate to prepare the financial statements of the Company on the going concern basis.
In arriving at their conclusion that the Company has adequate financial resources, the Directors were mindful that the Group had unrestricted cash of £12.1 million as at 31 December 2025 (2024: £19 million) and available headroom on its revolving credit facility (“RCF”) of £110 million (2024: £97 million). The Company’s net assets at 31 December 2025 were £495 million (2024: £570 million) and total expenses for the year ended 31 December 2025 were £6.5 million (2024: £7.0 million). At the date of approval of this document, based on the aggregate of investments and cash held, the Company has substantial operating expenses cover.
The Company receives revenue in the form of dividends and interest from its portfolio of assets. These revenues are derived from the sale of electricity through power purchase agreements in place with large and reputable providers of electricity to the market. A prolonged and deep market decline could lead to falling values to the underlying business or interruptions to cashflow, however the Directors do not foresee any immediate material risk to the Company’s investment portfolio and income from underlying assets. The Directors are also satisfied and are comfortable that the Company would continue to remain viable under downside scenarios, including a decline in long-term power price forecasts. In instances where underlying investments have external debt finance, the covenants associated with these facilities have been tested and are expected to be compliant, even in downside scenarios.
The major cash outflows of the Company are the payment of dividends, commitments payable for construction or development projects and contingent acquisitions. The Company’s direct subsidiary, ORIT Holdings II Limited, holds an RCF with a £150 million facility size and a term to June 2028. The covenants of the RCF have been tested and are expected to be compliant, even in downside scenarios. Plausible downside scenarios include a decrease in wholesale energy prices, a decrease in output and an increase in the discount rate applied to the underlying cash flow forecasts. While in some downside scenarios, the headroom available on the RCF will be lower, the Directors remain confident that the Company has sufficient cash balances, and headroom in the RCF held by ORIT Holdings II Limited in order to fund the commitments, detailed in note 21 to the financial statements, as they fall due.
Having performed the above assessment of going concern, the Directors have considered it appropriate to prepare the financial statements of the Company on a going concern basis. The Company has sufficient financial resources and liquidity and is well placed to manage business risks in the current economic environment and can continue operations for a period of at least 12 months from the date of these financial statements.
3. Critical accounting judgements, estimates and assumptions
Key estimation and uncertainty: Fair value estimation for investments at fair value
The Company’s investments at fair value are not traded in active markets. Fair value is calculated by discounting, at an appropriate discount rate, future cash flows expected to be received by the Company’s intermediate holdings. The discounted cashflow models use observable data, to the extent practicable. However, the key inputs require management to make estimates. Changes in assumptions about these factors could affect the reported fair value of investments.
The discount rates used in the valuation exercise represent the Investment Manager’s and the Board’s assessment of the rate of return in the market for assets with similar characteristics and risk profile. The discount rates are reviewed quarterly and updated, where appropriate, to reflect changes in the market and in the project risk characteristics.
Unless fixed under Power Purchase Agreements (“PPAs”) or otherwise hedged, the power prices used in the valuations are based on market forward prices in the near-term, followed by an equal blend of up to two independent and widely used market consultants’ technology-specific capture price forecasts for each asset. Power prices are updated quarterly in line with the release of updated forecasts. There is inherent uncertainty in wholesale electricity price projection.
Electricity output is based on specifically commissioned yield assessments prepared by technical advisers. Each asset’s valuation assumes a “P50” level of electricity output, which is the estimated annual amount of electricity generation that has a 50% probability of being exceeded – both in any single year and over the long-term – and a 50% probability of being underachieved. The P50 provides an expected level of generation over the long-term.
The short to medium-term inflation inputs used in the valuations are set in reference to independent economic forecasts from a variety of third-party sources. In the longer-term, an assumption is made that inflation will increase at a long-term rate. The estimates and assumptions that are used in the calculation of the fair values of investments are disclosed in Note 10.
The impact of physical and transition risks associated with climate change is assessed on a project by project basis and factored into the underlying cash flows as appropriate.
Further considerations on currency risks, interest rate risks, power price risks, credit risks, and liquidity risks are detailed in Note 17.
Key judgement: Equity and debt investment in ORIT Holdings II Limited
The Company classifies its investments based on its business model for managing those financial assets and the contractual cash flow characteristics of the financial assets. The portfolio of assets is managed, and performance is evaluated, on a fair value basis.
The Company is primarily focused on fair value information and uses that information to assess the assets’ performance and to make decisions. The Company has not taken the option to irrevocably designate any equity securities as fair value through other comprehensive income. The contractual cash flows of the Company’s debt securities are solely principal and interest, however, these securities are not held for the purpose of collecting contractual cash flows. The collection of contractual cash flows is only incidental to achieving the Company’s business model’s objective. Consequently, all investments are measured at fair value through profit or loss.
The Company considers the equity and loan investments to share the same investment characteristics and risks and they are therefore treated as a single unit of account for fair value purposes (IFRS13) and a single class for financial instrument disclosure purposes (IFRS9). As a result, the evaluation of the performance of the Company’s investments is done for the entire portfolio on a fair value basis, as is the reporting to the key management personnel and to the investors. In this case, all equity, derivatives and debt investments form part of the same portfolio for which the performance is evaluated on a fair value basis together and reported to the key management personnel in its entirety.
Key judgement: Basis of non-consolidation
The Company has adopted the amendments to IFRS 10 which states that investment entities should measure all of their subsidiaries that are themselves investment entities at fair value (in accordance with IFRS 9 Financial Instruments: Recognition and Measurement, and IFRS 13 Fair Value Measurement).
Under the definition of an investment entity, the Company should satisfy all three of the following tests:
i. the Company obtains funds from one or more investors for the purpose of providing those investors with investment management services;
ii. the Company commits to its investors that its business purpose is to invest funds solely for returns from capital appreciation, investment income, or both; and
iii. the Company measures and evaluates the performance of substantially all of its investments on a fair value basis.
In assessing whether the Company meet the definition of an investment entity set out in IFRS 10 the Directors note that:
i. the Company has multiple investors and obtains funds from a diverse group of shareholders who would otherwise not have access individually to invest in renewable energy infrastructure investments due to high barriers to entry and capital requirements;
ii. the Company intends to hold its investments for the remainder of their useful lives for the purpose of capital appreciation and investment income. The portfolio of assets are expected to generate renewable energy output for 30 to 40 years from their relevant commercial operation date and the Directors believe the Company is able to generate returns to the investors during that period; and
iii. the Company measures and evaluates the performance of all of its investments on a fair value basis which is the most relevant for investors in the Company. Management use fair value information as a primary measurement to evaluate the performance of all of the investments and in decision making.
The Directors are of the opinion that the Company meets all the typical characteristics of an investment entity and therefore meets the definition set out in IFRS 10. The Directors are satisfied that investment entity accounting treatment appropriately reflects the Company’s activities as an investment trust.
The Directors have also satisfied themselves that the Company’s wholly owned direct subsidiary, ORIT Holdings II Limited, meets the characteristics of an investment entity. ORIT Holdings II Limited has one investor, ORIT, however, in substance ORIT Holdings II Limited is investing the funds of the investors of ORIT on its behalf and is effectively performing investment management services on behalf of many unrelated beneficiary investors.
Being investment entities, ORIT and its wholly owned direct subsidiary, ORIT Holdings II Limited are measured at fair value as opposed to being consolidated on a line-by-line basis, meaning their cash, debt and working capital balances are included in the fair value of investments rather than the Group’s current assets.
The Directors believe the treatment outlined above provides the most relevant information to investors.
4. Material accounting policies
The material accounting policies applied in the preparation of these financial statements are set out below. These policies have been consistently applied to the current and comparative year.
(a) Financial instruments
Financial assets and financial liabilities are recognised in the Company’s Statement of Financial Position when the Company becomes a party to the contractual provisions of the instrument. Financial assets are derecognised when the contractual rights to the cash flows from the instrument expire or the asset is transferred.
Financial assets
As an investment entity, the Company is required to measure its investments in its wholly owned direct subsidiaries at fair value through profit or loss (‘FVTPL’). As explained in note 3, The Company has made a judgement to fair value both the equity and debt investments in its subsidiary together. Subsequent to initial recognition, the Company measures its investments on a combined basis at fair value. Valuation of development and early-stage assets is considered in further detail in Note 16.
Regular purchases and sales of investments are recognised on the trade date, being the date on which the Company commits to purchase or sell the investment. Investments at FVTPL are initially recognised at fair value. Transaction costs are expensed as incurred within the Statement of Comprehensive Income. Investments are derecognised when the right to receive cash flows from the investments have expired or the Company has transferred substantially all risks and rewards of ownership. Subsequent to initial recognition, all financial assets and financial liabilities at FVTPL are measured at fair value. Gains and losses arising from changes in the fair value of investments at FVTPL are included in the Statement of Comprehensive Income in the year which they arise.
Trade and other receivables are non interest bearing and short-term in nature. Accordingly, they are initially recognised at fair value and subsequently at amortised cost.
Cash and cash equivalents may comprise cash and demand deposits which are readily convertible to a known amount of cash and are subject to insignificant risk of changes in value. The carrying amount of these represents their fair value.
Financial liabilities and equity
Debt and equity instruments are classified as either financial liabilities or as equity in accordance with the substance of the contractual arrangement.
The Company’s financial liabilities include trade and other payables and monetary liabilities which are non-interest bearing and short-term in nature. Accordingly, they are initially recognised at fair value and subsequently at amortised cost.
The Company derecognises financial liabilities when, and only when, the Company’s obligations are discharged, cancelled or they expire.
The Company’s shares are classified as equity. An equity instrument is any contract that evidences a residual interest in the assets of an entity after deducting all of its liabilities.
Shares issued by the Company are recognised at the proceeds received, net of direct issue costs. Share issue costs are charged to share premium.
(b) Expenses
All expenses are accounted for on an accruals basis. Expenses are allocated wholly to revenue with the following exceptions:
• The investment management fee is allocated 75% to revenue and 25% to capital in line with the Board’s expected long-term split of revenue and capital return from the Company’s investment portfolio; and
• Transaction costs, including costs of aborted transactions, relating to the purchase or sale of investments, are charged to capital.
(c) Investment income
Investment income comprises interest and dividends receivable from the Company’s subsidiaries. Interest income is recognized in the Statement of Comprehensive Income using the effective interest method. Dividends receivable are recognised when the Company’s entitlement to receive payment is established.
(d) Taxation
The tax charge for the year is based on amounts expected to be received or paid.
Investment trusts which have approval under Section 1158 of the Corporation Tax Act 2010 are not liable for taxation on capital gains. The Company has successfully applied and has been granted approval as an Investment Trust by HMRC.
Deferred tax is provided on all timing differences that have originated but not reversed by the accounting date. Deferred tax liabilities are recognised for all taxable timing differences but deferred tax assets are only recognised to the extent that it is probable that taxable profits will be available against which those timing differences can be utilised.
Deferred tax is measured at the tax rate which is expected to apply in the periods in which the timing differences are expected to reverse, based on tax rates that have been enacted or substantively enacted at the balance sheet date and is measured on an undiscounted basis.
Any tax relief obtained on expenses allocated to capital is credited to the capital account in accordance with the requirements of the SORP.
The underlying intermediate holding companies and project companies in which the Company invests, provide for and pay taxation at the appropriate rates in the countries in which they operate. This is taken into account when assessing the value of the subsidiaries.
(e) Value added tax (VAT)
Expenses are disclosed inclusive of any related irrecoverable VAT.
(f) Foreign currency
The Company’s share capital is denominated in sterling and this is the currency in which its shareholders operate and expenses are generally paid. The Board has therefore determined that sterling is the functional currency and the currency in which the financial statements are presented. Amounts have been rounded to the nearest thousand.
Transactions denominated in foreign currencies are translated into sterling at actual exchange rates as at the date of the transaction. Monetary assets and liabilities denominated in foreign currencies at the year end are reported at the rates of exchange prevailing at the year end. Any gain or loss arising from a change in exchange rates subsequent to the date of the transaction is included as an exchange gain or loss to capital or revenue in the Statement of Comprehensive Income as appropriate. Foreign exchange movements on investments are included in the Capital account of the Statement of Comprehensive Income.
(g) Dividends payable
Final dividends payable are recognised in the financial statements when they have been approved by shareholders via an ordinary resolution and become a liability of the Company. Interim dividends are recognised in the period in which they are paid.
(h) Treasury shares
Treasury shares represent shares repurchased by the Company and do not carry voting rights and are not entitled to dividends. The cost of repurchasing the Company’s shares into treasury, including the related stamp duty and transaction costs is dealt with in the Statement of Changes in Equity and is charged to “Special reserve”. Share repurchase transactions are accounted for on a trade date basis.
(i) Segmental reporting
The Board is of the opinion that the Company is engaged in a single segment of business, being investment in renewable energy infrastructure assets to generate investment returns whilst preserving capital. The financial information used by the Board to manage the Company presents the business as a single segment.
(j) Adoption of new and revised International Financial Reporting Standards
New standards, amendments and interpretations that have become effective for periods beginning on or after 1 January 2025.
There are no new standards, amendments and interpretations that have become effective during the year that had a material effect on the financial statements of the Company.
New standards, amendments and interpretations that have been issued but which are not yet effective.
At the date of authorisation of these financial statements, the following revised International Financial Reporting Standards were in issue but not yet effective:
IFRS 18 Presentation and Disclosure in Financial Statements
IFRS 18, issued in April 2024, and adopted for use in the UK in December 2025, replaces IAS 1 and is effective for annual periods beginning on or after 1 January 2027. The standard introduces a more structured statement of profit or loss, including mandatory categories and subtotals, and new disclosure requirements for management-defined performance measures.
The Company is an investment trust holding renewable infrastructure assets measured at fair value. Under IFRS 18, dividend income and fair value movements on investments are expected to be presented within the investing category, while administrative and management expenses will primarily be presented within operating activities. As a result, the Company’s operating profit is expected to decrease significantly compared with current presentation, and may be negative in some periods.
The adoption of IFRS 18 will not affect the Company’s net asset value, total profit, or cash flows, but will change the presentation of performance in the primary financial statements. The Company also expects additional disclosure requirements to apply to its adjusted performance measures.
The Company is currently assessing the detailed impact of IFRS 18. At this stage, it is not practicable to quantify the impact on the comparative information.
Contracts Referencing Nature-dependent Electricity (Amendments to IFRS 9 and IFRS 7)
The amendments, issued in December 2024, and adopted for use in the UK in July 2025, clarify the accounting for certain contracts referencing electricity generated from renewable sources and introduce related disclosure requirements. The amendments are effective for annual periods beginning on or after 1 January 2026.
The Company is an investment entity under IFRS 10 and measures all investments at fair value through profit or loss. It does not enter into power purchase agreements or similar contracts within the scope of these amendments. Accordingly, the Directors do not expect the adoption of these amendments to have a material impact on the Company’s financial statements.
Annual Improvements to IFRS Accounting Standards – Volume 11
The annual improvements, issued in 18 July 2024, and adopted for use in the UK in February 2025, contains a set of minor amendments to multiple IFRS Accounting Standards. These amendments are effective for annual periods beginning on or after 1 January 2026. The Directors do not expect these annual improvements to have a material impact on the Company’s financial statements.
Amendments to IFRS 9 and IFRS 7 – Classification and Measurement of Financial Instruments
The amendments, issued in May 2024, and adopted for use in the UK in April 2025, clarify certain aspects of the classification and measurement requirements of IFRS 9 and introduce related disclosure requirements in IFRS 7. The amendments are effective for annual periods beginning on or after 1 January 2026.
The Company is an investment entity and measures all investments at fair value through profit or loss. It does not hold financial assets whose classification or measurement would be affected by these amendments. Accordingly, the Directors do not expect the adoption of these amendments to have a material impact on the Company’s financial statements.
IFRS 19 Subsidiaries without Public Accountability: Disclosures
IFRS19, issued in May 2024, has not, as of 31 December 2025, been endorsed for use in UK-adopted IFRS. If adopted, this will be effective for annual periods beginning on or after 1 January 2027. The Standard provides an optional reduced disclosure framework for subsidiaries without public accountability, that elect to apply IFRS 19, instead of the full disclosure requirements in other IFRS Standards.
The Company is not within the scope of IFRS 19 given its status as a publicly traded entity and accordingly, the Directors do not expect the potential future adoption of IFRS 19 to have a material impact on the Company’s financial statements.
5. Income from investments
Year ended
Year ended
31 December
31 December
2025
2024
£’000
£’000
Dividends from investments
18,000
17,000
Interest from investments
24,842
25,541
Total income from investments
42,842
42,541
6. Operating expenses
Year ended 31 December 2025
Year ended 31 December 2024
Revenue
Capital
Total
Revenue
Capital
Total
£’000
£’000
£’000
£’000
£’000
£’000
Investment management fees1
3,638
1,213
4,851
4,104
1,368
5,472
Auditors’ remuneration for the audit of the Company’s annual financial statements2
340
–
340
319
–
319
Directors’ fees3
293
–
293
252
–
252
Other operating expenses
975
–
975
992
–
992
Total operating expenses
5,246
1,213
6,459
5,667
1,368
7,035
1 Details of transactions with the Investment Manager are given in note 18 on page 108.
2 In addition to the fees disclosed above, fees amounting to £212,000 (2024: £198,000) are payable to the Company’s auditors in respect of statutory audit services provided to unconsolidated subsidiaries.
3 The Company has no employees. Details of Directors’ remuneration are given in the Directors’ Remuneration Report on page 74 to 78.
7. Taxation
(a) Analysis of tax charge/(credit) in the year
Year ended 31 December 2025
Year ended 31 December 2024
Revenue
Capital
Total
Revenue
Capital
Total
£’000
£’000
£’000
£’000
£’000
£’000
Corporation tax
304
(304)
–
342
(342)
–
Tax charge/(credit) in the year
304
(304)
–
342
(342)
–
The Company has no corporation tax liability for the year ended 31 December 2025 (2024: nil)
(b) Factors affecting tax charge/(credit) for the year
The Company’s applicable rate of corporation tax for the year is 25% (2024: 25%). The tax charge/(credit) differs (2024: differs) from the charge/(credit) resulting from applying the applicable corporation tax rate. The differences are explained below:
Year ended 31 December 2025
Year ended 31 December 2024
Revenue
Capital
Total
Revenue
Capital
Total
£’000
£’000
£’000
£’000
£’000
£’000
Profit/(loss) before taxation
37,799
(60,750)
(22,951)
37,175
(25,398)
11,777
Corporation tax at 25% (2024: 25%)
9,450
(15,188)
(5,738)
9,294
(6,350)
2,944
Effects of:
Expenses not deductible for tax purposes
–
14,884
14,884
–
6,008
6,008
Income not taxable
(4,500)
–
(4,500)
(4,250)
–
(4,250)
Dividends designated as interest distributions
(4,647)
–
(4,647)
(4,706)
–
(4,706)
Movement in deferred tax not recognised
1
–
1
4
–
4
Total tax charge/(credit) for the year
304
(304)
–
342
(342)
–
The Directors are of the opinion that the Company has complied with the requirements for maintaining investment trust status for the purposes of section 1158 of the Corporation Tax Act 2010. This allows certain capital profits of the Company to be exempt from UK tax.
The Company may designate dividends wholly or partly as interest distributions for UK tax purposes. Interest distributions are treated as tax deductions against taxable income of the Company so that investors do not suffer double taxation on their returns.
Any tax relief obtained on expenses allocated to capital is credited to the capital account.
The financial statements do not directly include the tax charges for the Company’s intermediate holding company or other subsidiaries as these are held at fair value. Each of these companies are subject to taxes in the countries in which they operate.
The Company has an unrecognised deferred tax asset of £18,000 (2024: £17,000) based on excess management expenses of £70,000 (2024: £66,000) at the prospective UK corporation tax rate of 25% (2024: 25%). A deferred tax asset has not been recognised in respect of these management expenses and will be recoverable only to the extent that the Company has sufficient future taxable profits.
8. Dividends
The following dividends were paid in the year:
Year ended 31 December 2025
Year ended 31 December 2024
Pence pershare£’000
Total£’000
Penceper share£’000
Total£’000
Q4 2024 dividend paid on 28 February 2025 (2024: 23 February 2024)
1.51
8,380
1.45
8,191
Q1 2025 dividend paid on 30 May 2025 (2024: 31 May 2024)
1.54
8,467
1.50
8,475
Q2 2025 dividend paid on 29 August 2025 (2024: 30 August 2024)
1.54
8,280
1.51
8,493
Q3 2025 dividend paid on 28 November 2025 (2024: 29 November 2024)
1.54
8,124
1.50
8,377
6.13
33,251
5.96
33,536
The Company was granted status as an investment trust company by HMRC effective from 1 September 2020, and intends to continue to meet the minimum distribution requirements of Section 1158, in order to retain that status. Those requirements are considered on the basis of dividends declared in respect of the financial year as shown below.
The revenue available for distribution by way of dividend for the year is £37,495,000 (2024: £36,833,000).
Year ended 31 December 2025
Year ended 31 December 2024
Pence per share £’000
Total£’000
Pence per share£’000
Total£’000
Q1 2025 dividend paid on 30 May 2025 (2024: 31 May 2024)
1.54
8,467
1.50
8,475
Q2 2025 dividend paid on 29 August 2025 (2024: 30 August 2024)
1.54
8,280
1.51
8,493
Q3 2025 dividend paid on 28 November 2025 (2024: 29 November 2024)
1.54
8,124
1.50
8,377
Q4 2025 dividend paid on 27 February 2026 (2024: 28 February 2025)
1.55
8,177
1.51
8,379
6.17
33,048
6.02
33,724
A final dividend of 1.55p (2024: 1.51p) per share, amounting to £8,177,000 (2024: £8,379,000), has been declared payable in respect of Q4 2025. This dividend was paid on 27 February 2026 to shareholders on the register on 13 February 2026.
9. Earnings/(losses) per share
Year ended
Year ended
31 December
31 December
2025
2024
Revenue profit after taxation (£’000)
37,495
36,833
Capital loss after taxation (£’000)
(60,446)
(25,056)
Total (loss)/profit after taxation (£’000)
(22,951)
11,777
Weighted average number of shares in issue during the year
541,981,848
562,473,374
Revenue earnings per share
6.92p
6.55p
Capital losses per share
(11.15)p
(4.45)p
Total (losses)/earnings per share
(4.23)p
2.10p
There are no diluted returns per share as there are no dilutive or potentially dilutive instruments in issue.
10. Investments at fair value through profit or loss
(a) Changes in the valuation of the Company’s direct holding in its subsidiary, ORIT Holdings II Limited (“the subsidiary”).
Year ended
Year ended
31 December
31 December
2025
2024
£’000
£’000
Opening balance of the subsidiary at fair value
561,296
592,121
Additional investment in intermediate holding companies
357
577
Distributions received
(59,528)
(49,913)
Investment income
42,842
42,541
Movement in fair value
(59,537)
(24,030)
Closing balance of the subsidiary at fair value
485,430
561,296
The additional investment in the intermediate holding companies includes acquisition costs associated with the purchase of the portfolio of assets totalling £nil (2024: £nil), which have been expensed to the profit and loss accounts of the intermediate holding companies and £357,000 (2024: £577,000) of other expenses paid by the Company on behalf of the intermediate holdings companies.
(b) Reconciliation of movement in the fair value of the Company’s underlying portfolio of investments
The table below shows the movement in the fair value of the Company’s investments. These assets are held through intermediate holding companies.
Year ended
Year ended
31 December
31 December
2025
2024
£’000
£’000
Opening balance
699,604
705,970
Portfolio of assets acquired
18,521
104,229
Asset disposals
(70,385)
(62,077)
Distributions received from investments
(57,326)
(69,006)
Movement in fair value of investments
12,781
20,488
Year ended
Year ended
31 December
31 December
2025
2024
£’000
£’000
Fair value of the underlying portfolio of investments at the
end of the year
603,195
699,604
Cash held in the intermediate holding companies
1,781
7,075
Bank loans held by the intermediate holding companies
(116,198)
(151,243)
Fair value of other net assets/(liabilities) held by the intermediate companies
(3,348)
5,860
Fair value of the Company’s investments at the end of the year
485,430
561,296
Of the £57.3 million (2024: £69.0 million) distributions received from investments, £39.1 million (2024: £43.7 million) was received from investments in the UK and £18.2 million (2024 £25.3 million) from European investments.
On 30 December 2025, the Company completed the sale of its entire 51% stake in the Crossdykes wind farm, alongside the sale of 49% of its stake in the Breach solar farm, both in the UK. ORIT received proceeds of approximately £64.9 million, realising a £0.4 million premium over the holding value of the assets at the time of sale.
On 27 October 2025, the Company completed the sale of its entire 25% stake in Hyro Energy, realising proceeds of approximately £2.6 million, in line with ORITs holding value of the investment at the time of sale. The transaction includes contingent consideration of up to £2 million contingent on delivery of key construction milestones for Hyro’s first project. This will be recognised in future periods as it is realised.
On 31 October 2025, the Company received proceeds of approximately £2.9 million following the sale by Simply Blue Holdings of an 80% stake in its offshore wind development arm. This transaction was in line with ORITs holding value of the investment at the time of sale. The transaction includes contingent consideration related to key milestones being achieved by floating offshore wind development projects. This will be recognised in future periods as it is realised.
The Directors have satisfied themselves as to the methodology used, the discount rates applied and the valuation. All operational investments are in renewable energy assets and are valued using a discounted cash flow methodology. This is done using a blended discount rate and the value attributed to loan investments represents their face value, with the residual value attributed to equity investments. As explained in Note 3, the equity and debt instruments are valued as a whole.
Fair value of portfolio of assets
The following assumptions were used in the discounted cash flow valuations:
As at
As at
31 December 2025
31 December 2024
UK RPI (year-on-year)
3.25% to 2029 and then 2.25% from 2030 onwards
3.0% to 2029 and then 2.25% from 2030 onwards
UK RPI (annual average)
3.25% to 2029 and then 2.25% from 2030 onwards
3.0% to 2029 and then 2.25% from 2030 onwards
UK – corporation tax rate
25.00%
25.00%
Ireland – long-term inflation rate
2.00%
2.00%
Ireland – corporation tax rate
12.50%
12.50%
France – long-term inflation rate
2.00%
2.00%
France – corporation tax rate
25.00%
25.00%
Finland – long-term inflation rate
2.00%
2.00%
Finland – corporation tax rate
18.00%
20.00%
Germany – long-term inflation rate
2.00%
2.00%
Germany – corporation tax rate
15.83%
15.83%
Sterling/Euro exchange rate
1.1463
1.2115
Energy yield assumptions
P50 case
P50 case
Other key assumptions include:
Power price forecasts
Unless fixed under PPAs or otherwise hedged, the power price forecasts used in the valuations are based on market forward prices in the near-term, followed by an equal blend of two independent and widely-used market expert consultants’ relevant technology-specific capture price forecasts for each asset. Further information on the impact of power prices over the year is provided in the Portfolio Valuation section of the Investment Manager’s report on page 41.
Asset lives
The length of the period of operations assumed in the valuation is determined on an asset-by-asset basis taking into account the lease agreements, permits or planning permissions in place as well as any extension rights, renewal regimes or wider policy considerations, together with the technical characteristics of the asset.
Decommissioning costs
Where applicable, the present value of the estimated costs to restore the land back to its original use are included in the valuations as a cash outflow at the end of the asset life.
Fair value of intermediate holding companies
The other net assets in the intermediate holding companies substantially comprise working capital balances, for which the carrying value is deemed to be a reasonable approximation of fair value.
Details of key assumption sensitivities to fair values are included in Note 17.
11. Trade and other receivables
31 December
31 December
2025
2024
£’000
£’000
Prepayments and other receivables
92
23
12. Trade and other payables
31 December
31 December
2025
2024
£’000
£’000
Accrued expenses
1,497
2,801
13. Share capital
Changes in called-up share capital during the year were as follows:
Year ended
Year ended
31 December
31 December
2025
2024
£’000
£’000
Ordinary shares of 1p each, allotted, called-up and fully paid
Opening balance of shares of 1p each, excluding shares held in treasury
5,557
5,649
Repurchase of shares into treasury
(281)
(92)
Subtotal of shares of 1p each, excluding shares held in treasury
5,276
5,557
Shares held in treasury
373
92
Closing balance of shares of 1p each, including shares held intreasury
5,649
5,649
Changes in the numbers of shares in issue during the year were as follows:
Year ended
Year ended
31 December
31 December
2025
2024
Opening balance of shares in issue, excluding shares held in treasury
555,658,774
564,927,536
Repurchase of shares into treasury
(28,081,835)
(9,268,762)
Closing balance of shares in issue, excluding shares held in treasury
527,576,939
555,658,774
Closing balance of shares held in treasury
37,350,597
9,268,762
Closing balance of shares in issue, including shares held in treasury
564,927,536
564,927,536
During the year, the Company made market purchases of 28,081,835 (2024: 9,268,762) of its own shares, nominal value £280,818 (2024: £92,687), to hold in treasury, representing 5.1% (2024: 1.6%) of the shares outstanding at the beginning of the year. The total consideration paid for these shares, including transaction costs, amounted to £19,368,000 (2024: £6,910,000). The reason for these purchases was to seek to manage the volatility of the share price discount to net asset value per share and to provide a degree of liquidity to the market.
14. Reserves
Capital reserves
Investment
Other
holding
Share
Special
capital
gains and
Revenue
premium1
reserve2
reserve3
losses4
reserve5
£’000
£’000
£’000
£’000
£’000
Opening balance at 1 January 2025
217,283
332,590
(7,287)
(4,013)
26,148
Repurchase of the Company’s own shares into treasury
–
(19,201)
–
–
–
Costs of share repurchases
–
(167)
–
–
–
Net movement in investment holding gains and losses
–
–
–
(59,537)
–
Investment management fees allocated to capital
–
–
(1,213)
–
–
Tax relief on expenses allocated to capital
–
–
304
–
–
Revenue profit for the year
–
–
–
–
37,495
Dividends paid in the year
–
–
–
–
(33,251)
Closing balance at 31 December 2025
217,283
313,222
(8,196)
(63,550)
30,392
1 The share premium is a non distributable reserve and represents the amount by which the fair value of the consideration received from shares issued exceeded the nominal value of shares issued.
2 Following admission of the Company’s Ordinary Shares to trading on the London Stock Exchange, the Directors applied to the Court and obtained a judgement on 18 February 2020 to cancel an amount standing to the credit of the share premium account of the Company. As stated by the Institute of Chartered Accountants in England and Wales (“ICAEW”) and the Institute of Chartered Accountants in Scotland (“ICAS”) in the technical release TECH 02/17BL, The Companies (Reduction of Share Capital) Order 2008 SI 2008/1915 (“the Order”) specifies the cases in which a reserve arising from a reduction in a company’s capital (i.e., share capital, share premium account, capital redemption reserve or redenomination reserve) is to be treated as a realised profit as a matter of law. The Order also disapplies the general prohibition in section 654 on the distribution of a reserve arising from a reduction of capital. The Order provides that if a limited company having a share capital reduces its capital and the reduction is confirmed by order of court, the reserve arising from the reduction is treated as a realised profit unless the court orders otherwise. The amount of the share premium account cancelled and credited to the Company’s Special reserve was £339.5 million, which can be utilised to fund share buybacks or distributions by way of dividends to the Company’s shareholders. As at 31 December 2025, the Company had a special reserve remaining of £313.2 million. The reduction of £19.4 million (2024: £6.9 million) in the year ended 31 December 2025 represents the total cost of share buybacks (inclusive of stamp duty and associated fees).
3 This is a realised capital reserve. A positive balance on this reserve may be used to repurchase the Company’s own shares or distributed as dividends.
4 This is a non distributable reserve comprising net unrealised losses on the Company’s investment in its subsidiary.
5 The revenue reserve may be distributed as dividends or used to repurchase the Company’s own shares.
15. Net asset value (“NAV”) per share
31 December
31 December
2025
2024
Total Shareholders’ Equity (£’000)
494,800
570,370
Closing balance of shares in issue, excluding shares held in treasury
527,576,939
555,658,774
NAV per share
93.79p
102.65p
16. Financial instruments by category
As at 31 December 2025
Financial assets at amortised cost £’000
Financial assets at fair value through profit or loss £’000
Financial liabilities at amortised cost £’000
Total £’000
Non-current assets
Investments at fair value through profit or loss
–
485,430
–
485,430
Current assets
Trade and other receivables
92
–
–
92
Cash and cash equivalents
10,775
–
–
10,775
Total assets
10,867
485,430
–
496,297
Current liabilities
Trade and other payables
–
–
(1,497)
(1,497)
Total liabilities
–
–
(1,497)
(1,497)
Net assets
10,867
485,430
(1,497)
494,800
As explained in Note 3, the Company values its investments as a whole. In the tables above the total figure of £485.4 million for financial assets at fair value through profit or loss represents the combined value of debt and equity investments. Investments at fair value through profit and loss takes into account additions and disposals in the year.
As at 31 December 2024
Financial
assets at
Financial
fair value
Financial
assets at
through
liabilities at
amortised
profit or
amortised
cost
loss
cost
Total
£’000
£’000
£’000
£’000
Non-current assets
Investments at fair value through profit or loss
–
561,296
–
561,296
Current assets
Trade and other receivables
23
–
–
23
Cash and cash equivalents
11,852
–
–
11,852
Total assets
11,875
561,296
–
573,171
Current liabilities
Trade and other payables
–
–
(2,801)
(2,801)
Total liabilities
–
–
(2,801)
(2,801)
Net assets
11,875
561,296
(2,801)
570,370
As explained in Note 3, the Company values its investments as a whole. In the tables above of the total figure of £561.3 million for financial assets at fair value through profit or loss, £506.5 million relates to the face value of debt investments. Investments at fair value through profit and loss takes into account additions and disposals in the year.
The Company’s financial instruments that are held at fair value comprise its investment portfolio. Other financial instruments held by the Company comprising cash and cash equivalents, receivables and payables, are held at amortised cost.
IFRS 13 requires the Company to classify its investments in a fair value hierarchy that reflects the significance of the inputs used in making the measurements. IFRS 13 establishes a fair value hierarchy that prioritises the inputs to valuation techniques used to measure fair value. The three levels of fair value hierarchy under IFRS 13 are as follows:
Level 1 – valued using quoted prices in active markets.
Level 2 – valued by reference to valuation techniques using observable inputs other than quoted market prices included within Level 1.
Level 3 – valued by reference to valuation techniques using inputs that are not based on observable market data.
Categorisation within the hierarchy has been determined on the basis of the lowest level input that is significant to the fair value measurement of the relevant asset.
Details of the valuation techniques used by the Company are given in Note 3 on page 94. At 31 December 2025, the Company’s investment portfolio, held at fair value through profit and loss, was categorised as follows:
31 December
31 December
2025
2024
£’000
£’000
Level 1
–
–
Level 2
12,491
10,496
Level 3
472,939
550,800
Total
485,430
561,296
There have been no transfers between Levels 1, 2 or 3 during the year.
Included within investments at fair value through profit or loss is an amount of £5.0 million in relation to derivative options associated with a conditional acquisition in Ireland (2024: £nil) recognised in an intermediate holding company.
Reconciliation of fair value measurement of financial assets and liabilities
An analysis of the movement between opening to closing balances of the investments at fair value through profit or loss is given in Note 10. The fair value of the investments at fair value through profit or loss includes the use of Level 3 inputs. Refer to Note 10 for details on the valuation methodology.
Valuation sensitivities of key assumptions are included in Note 17.
Fair value calculation of Level 3 investments
All investments are in renewable energy assets and are valued using a discounted cash flow methodology. This is done using a blended discount rate and the value attributed to debt investments represents their face value, with the residual value attributed to equity investments. The discount rate (cost of equity) applied to the portfolio of assets ranges from 6.5% to 8.3%. For development and early-stage assets, investment values are held at cost or Price of Recent Investment for up to one year from the initial or most recent investment, provided there are no material changes to the business plan set at acquisition. After this period, a detailed evaluation of the portfolio investments will be performed on a semi-annual basis, during which any material changes to the investments shall be thoroughly assessed through Octopus Energy Generation’s Framework for evaluating early-stage investments.
The Directors have satisfied themselves as to the methodology used, the discount rates applied and the valuation. All operational investments are in renewable energy assets and are valued using a discounted cash flow methodology. As explained in Note 3, the equity and debt instruments are valued as a whole.
17. Financial instruments’ exposure to risk and risk management policies
The investment objective is set out on page 1 of this report. In pursuing this objective, the Company is exposed to a variety of financial risks that could result in a reduction in the Company’s net assets or a reduction in the profits available for dividends. These financial risks include market risk (comprising discount rate risk, inflation rate risk, power price risk, generation risk, foreign exchange risk and interest rate risk), liquidity risk and credit risk. The Directors’ policy for managing these risks is set out below. The Board coordinates the Company’s risk management policy.
The objectives, policies and processes for managing the risks and the methods used to measure the risks that are set out below, have not changed from those applying in the comparative year.
The Company’s classes of financial instruments comprise investments in renewable energy assets, short-term debtors, creditors and cash arising from its operations.
(a) Market risk
The fair value or future cash flows of a financial instrument held by the Company may fluctuate because of changes in market conditions. This market risk comprises a number of elements including: discount rate risk, inflation risk, power price risk, generation risk, foreign exchange risk and interest rate risk. Information to enable an evaluation of the nature and extent of these elements of market risk is given in parts (i) to (vi) of this note, together with sensitivity analyses where appropriate. The Board reviews and agrees policies for managing these risks and these policies have remained unchanged from those applying in the comparative year. The Manager assesses the exposure to market risk when making each investment decision and monitors the overall level of market risk on the whole of the investment portfolio on an ongoing basis.
(i) Discount rate risk
The discount rate is considered the most significant unobservable input through which an increase or decrease would have a material impact on the fair value of the investments at fair value through profit or loss.
An increase of 0.5% in the discount rate (levered cost of equity) would cause a decrease in total portfolio value of 4.7p per Ordinary Share (5.0% decrease) and a decrease of 0.5% in the discount rate would cause an increase in total portfolio value of 5.2p per Ordinary Share (5.5% increase).
(ii) Inflation risk
The sensitivity of the investments to movement in inflation rates is as follows:
A decrease of 0.5% in the inflation rate would cause a decrease in total portfolio value amounting to 4.2p (4.5%) per share and a 0.5% increase in the inflation rate would cause an increase in total portfolio value amounting to 4.6p (4.9%) per share.
(iii) Power price risk
The wholesale market price of electricity and gas is volatile and is affected by a variety of factors, including market demand for electricity and gas, the generation mix of power plants, government support for various forms of power generation, as well as fluctuations in the market prices of commodities and foreign exchange. Whilst some of the Company’s renewable energy projects benefit from fixed prices, others have revenue which is in part based on wholesale electricity and gas prices. The Investment Manager continually monitors energy price forecasts and aims to put in place mitigating strategies, such as hedging arrangements or fixed PPA contracts to reduce the exposure of the Company to this risk. The sensitivities of the investments to movement in power prices are as follows:
A decrease of 10% in power price would cause a decrease in the total portfolio value of 9.2p (9.9%) per share and an increase of 10% in power price would cause an increase in the total portfolio value of 9.4p (10.0%) per share.
(iv) Generation risk
Wind and solar assets are subject to power generation risks. The sensitivities of the investments to movement in level of power output are as follows:
The fair value of the investments is based on a “P50” level of power output being the expected level of generation over the long-term. An assumed “P90” level of power output (i.e. a level of generation that is below the “P50”, with a 90% probability of being exceeded) would cause a decrease in the total portfolio value amounting to 14.4p (15.3%) per share. An assumed “P10” level of power output (i.e. a level of generation that is above the “P50”, with a 10% probability of being achieved) would cause an increase in the total portfolio value amounting to 14.3p (15.3%) per share.
(v) Foreign exchange risk
Foreign currency risk is defined as the risk that the fair values of future cashflows will fluctuate because of changes in foreign exchange rates. The Company seeks to manage its exposure to foreign exchange movements to ensure that (i) the sterling value of known future construction commitments is fixed; (ii) sufficient near-term distributions from non‑sterling investments are hedged to maintain healthy dividend cover; (iii) the volatility of the Company’s NAV with respect to foreign exchange movements is limited; and (iv) all settlements and potential mark-to-market payments on instruments used to hedge foreign exchange exposure are adequately covered by the Company’s cash balances and undrawn credit facilities. The sensitivity of the investments to movement in foreign exchange rates is as follows:
If the euro were to weaken by 10% against sterling, this would cause a decrease in total portfolio value amounting to 1.1p per (1.2%) per share and conversely, if the euro were to strengthen by 10%, this would cause an increase in total portfolio value amounting to 1.1p (1.2%) per share. Of the portfolio as at 31 December 2025, 66% (2024: 58%) of the NAV is denominated in non-sterling currencies.
(vi) Interest rate risk
The Company’s interest rate risk on interest bearing financial assets is limited to interest earned on cash and loan investments into project companies, which yield interest at a fixed rate. The portfolio’s cashflows are continually monitored and reforecast, both over the near future and the long-term, to analyse the cash flow returns from investments.
The Group may use borrowings to finance the acquisition of investments and the forecasts are used to monitor the impact of changes in borrowing rates against cash flow returns from investments, as increases in borrowing rates will reduce net interest margins. The Group’s policy is to ensure that interest rates are sufficiently hedged to protect the Group’s net interest margins from significant fluctuations when entering into material medium/ long-term borrowings. This includes engaging in interest rate swaps or other interest rate derivative contracts.
At 31 December 2025
At 31 December 2024
Non-
Non-
Interest
interest
Interest
interest
bearing
bearing
Total
bearing
bearing
Total
£’000
£’000
£’000
£’000
£’000
£’000
Investments at fair value through profit or loss
485,430
–
485,430
506,485
54,811
561,296
Trade and other receivables
–
92
92
–
23
23
Cash and cash equivalents
10,775
–
10,775
11,852
–
11,852
Total assets
496,205
92
496,297
518,337
54,834
573,171
Trade and other payables
–
(1,497)
(1,497)
–
(2,801)
(2,801)
Total liabilities
–
(1,497)
(1,497)
–
(2,801)
(2,801)
In the table above, the interest bearing asset value for investments at fair value through profit or loss relates to the fair value of loan investments. The non-interest bearing asset value, for investments at fair value through profit or loss, relates to the fair value of equity investments. This reduced to £nil during the year ended 31 December 2025, as a result of the movement in fair value of investments reported in the Statement of Comprehensive Income.
(b) Credit risk
Credit risk is the risk that a counterparty of the Group will be unable or unwilling to meet a commitment that it has entered into with the Group. The credit standing of subcontractors is reviewed, and the risk of default estimated for each significant counterparty position. Monitoring is ongoing, and positions are reported to the Board on a quarterly basis. As at 31 December 2025 the Group has no credit risk exposures on a project exceeding 1% of total value of all investments (2024: nil).
The Group ‘s investments enter into Power Price Agreements (“PPAs”) with a range of providers through which electricity is sold. The largest PPA provider to the portfolio at 31 December 2025 was Microsoft Ireland Energy Limited who provided PPAs to projects in respect of 22.7% of the portfolio by total value of all investments (2024: Microsoft Ireland Energy Limited: 18%).
Credit risk also arises from cash and cash equivalents, derivative financial instruments and deposits with banks and financial institutions. The Company and its subsidiaries mitigate their risk on cash investments and derivative transactions by only transacting with major international financial institutions with high credit ratings assigned by international credit rating agencies.
The Company has assessed IFRS 9’s expected credit loss model and does not consider it to have any material impact on these financial statements. No trade and other receivables balances are credit-impaired at the reporting date (2024: none).
(c) Liquidity risk
Liquidity risk is the risk that the Group may not be able to meet its financial obligations as they fall due. The AIFM and the Board continuously monitor forecast and actual cashflows from operating, financing, and investing activities to consider payment of dividends, repayment of trade and other payables or funding further investing activities. The Group ensures that it maintains adequate reserves, banking facilities and reserve borrowing facilities by continuously monitoring forecast and actual cash flows and matching the maturity profiles of financial assets and liabilities.
The Group’s investments are generally in private companies, in which there is no active market. Therefore such investments would take time to realise, and there is no assurance that the valuations placed on the investments would be achieved from any such sale process.
Financial liabilities by maturity at the year end are shown below:
At 31 December2025
At 31 December2024
Less than
Less than
1 year
Total
1 year
Total
£’000
£’000
£’000
£’000
Trade and other payables
(1,497)
(1,497)
(2,801)
(2,801)
18. Related party transactions
AIFM and Investment Manager
The Company has appointed Octopus Energy AIF Management Limited to be the Alternative Investment Fund Manager (“AIFM”). The AIFM has delegated portfolio management services to Octopus Renewables Limited (trading as Octopus Energy Generation), the Company’s Investment Manager.
Up to 31 October 2025, The AIFM was entitled to a management fee of 0.95% per annum of Net Asset Value of the Company up to £500 million and 0.85% per annum of Net Asset Value in excess of £500 million, payable quarterly in arrears. No performance fee is payable under the terms of the AIFM Agreement.
With effect from the 1 November 2025, the Company and the AIFM have agreed that these percentage rates, rather than being applied to NAV on a standalone basis, will be applied to an equal weighting of (i) the average of the closing daily market capitalisation during each quarter and (ii) the published NAV for that quarter.
The investment management fee payable in respect of the year amounted to £4,851,000 (2024: £5,472,000), of which £1,035,000 (2024: £2,274,000) was outstanding at the year end.
No Director of the Company served as a director of any member of the Octopus Group at any time during the year, or prior year.
Subsidiaries
Interest receivable for the year from the Company’s subsidiaries amounted to £24,842,000 (2024: £25,541,000) of which £nil (2024: £nil) was outstanding at the year end.
Directors
Details of the remuneration payable to Directors and Directors’ shareholdings are given in the Directors’ Remuneration Report on pages 74 to 78. There have been no other transactions with related parties during the year (2024: Nil).
19. Subsidiaries, joint ventures and associates
As a result of applying Investment Entities (Amendments to IFRS 10, IFRS 12 and IAS 27), no subsidiaries have been consolidated in these financial statements. The Company’s subsidiaries, joint ventures and associates, as at 31 December 2025, are listed below:
Name
Category
Place of business
Registered office
Ownership interest
ORIT Holdings II Limited
Direct intermediate holdings
UK
A
100%
ORIT Holdings Limited
Intermediate holdings
UK
A
100%
ORIT UK Acquisitions Limited
Intermediate holdings
UK
A
100%
ORIT UK Acquisitions Midco Limited
Portfolio-level holdings
UK
A
100%
Abbots Ripton Solar Energy Limited
Project company
UK
A
100%
Chisbon Solar Farm Limited
Project company
UK
A
100%
Jura Solar Limited
Project company
UK
A
100%
Mingay Farm Limited
Project company
UK
A
100%
NGE Limited
Project company
UK
A
100%
Sun Green Energy Limited
Project company
UK
A
100%
Westerfield Solar Limited
Project company
UK
A
100%
Wincelle Solar Limited
Project company
UK
A
100%
Solstice1A GmbH
Portfolio-level holdings
Germany
C
100%
SolaireCharleval SAS
Project company
France
D
100%
SolaireIstres SAS
Project company
France
D
100%
SolaireCuges-Les-Pins SAS
Project company
France
D
100%
SolaireChalmoux SAS
Project company
France
D
100%
SolaireLaVerdiere SAS
Project company
France
D
100%
SolaireBrignoles SAS
Project company
France
D
100%
SolaireSaint-Antonin-du-Var SAS
Project company
France
D
100%
Centrale Photovoltaique de IOVI 1 SAS
Project company
France
D
100%
Centrale Photovoltaique de IOVI 3 SAS
Project company
France
D
100%
Arsac 2 SAS
Project company
France
D
100%
Arsac 5 SAS
Project company
France
D
100%
SolaireFontienne SAS
Project company
France
D
100%
SolaireOllieres SAS
Project company
France
D
100%
Elysia SAS
Portfolio-level holdings
France
E
100%
CEPE Cerisou
Project company
France
F
100%
Cumberhead Wind Energy Limited
Project company
UK
A
100%
ORIT Irish Holdings 2 Limited
Portfolio-level holdings
UK
A
100%
ORIT Irish Holdings Limited
Portfolio-level holdings
UK
A
100%
Ballymacarney Renewable Energy Limited
Project company
Ireland
B
100%
Nordic Power Development Limited
Portfolio-level holdings
UK
A
100%
Saunamaa Wind Farm Oy
Project company
Finland
H
100%
Vöyrinkangas Wind Farm Oy
Project company
Finland
H
100%
ORI JV Holdings Limited
Portfolio-level holdings
UK
A
50%
Simply Blue Holdings Limited
Portfolio-level holdings
Ireland
I
20%
ORI JV Holdings 2 Limited
Portfolio-level holdings
UK
A
50%
South Kilbraur Wind Farm Limited
Project company
UK
J
25%
Parc Ynni Banc Y Celyn Cyf
Project company
UK
T
25%
Parc Ynni Calon Y Gwent Cyf
Project company
UK
T
25%
Lairdmannoch Energy Park Limited
Project company
UK
J
25%
Wind 2 Project 5 Limited
Project company
UK
J
25%
Wind 2 Project 6 Limited
Project company
UK
J
25%
Wind 2 Project 7 Limited
Project company
UK
T
25%
Bwlch Gwyn Wind Farm Limited
Project company
UK
T
25%
Kirkton Wind Farm Limited
Project company
UK
J
25%
Windburn Wind Farm Limited
Project company
UK
J
25%
ORI JV Holdings 3 Limited
Portfolio-level holdings
UK
A
50%
Nordic Renewables Limited
Portfolio-level holdings
UK
A
30%
Nordic Generation Limited
Portfolio-level holdings
UK
O
30%
Nordic Generation Oy
Project company
Finland
G
30%
Nordic Renewables Holdings 1 Limited
Portfolio-level holdings
UK
A
30%
Haaponeva SPC Oy
Project company
Finland
G
30%
BHill SPC Oy
Project company
Finland
G
30%
Luola S SPC Oy
Project company
Finland
G
30%
Mikkeli S SPC Oy
Project company
Finland
G
30%
Eero S SPC Oy
Project company
Finland
G
30%
S Tuuli SPC Oy
Project company
Finland
G
30%
KNorgen SPC Oy
Project company
Finland
G
30%
ORI JV Holdings 4 Limited
Portfolio-level holdings
UK
A
50%
Gridsource (Woburn Rd) Limited
Project company
UK
A
50%
Blota Germany GmbH
Portfolio-level holdings
Germany
N
100%
Blota GP GmbH
Portfolio-level holdings
Germany
M
100%
UKA Windenergie Leeskow GmbH
Portfolio-level holdings
Germany
L
100%
UGE Leeskow Eins GmbH & Co. KG Umweltgerechte Energie
Portfolio-level holdings
Germany
M
100%
Infrastrukturgesellschaft Leeskow mbH & Co. KG
Project company
Germany
L
70%
Burwell 11 Solar Holdco Limited
Portfolio-level holdings
UK
A
51%
Burwell 11 Solar Limited
Project company
UK
A
51%
ORIT Lincs Holdco Limited
Portfolio-level holdings
UK
A
100%
ORI Lincs Holdings Limited
Portfolio-level holdings
UK
A
50%
Clyde SPV Limited
Portfolio-level holdings
UK
K
50%
UK Green Investment Lyle Limited
Portfolio-level holdings
UK
K
50%
Lincs Wind Farm (Holding) Limited
Portfolio-level holdings
UK
P
15.5%
Lincs Wind Farm Limited
Project company
UK
Q
15.5%
Trio Power Limited
Portfolio-level holdings
UK
A
100%
Trio Power AssetCo 1 Limited
Portfolio-level holdings
UK
A
100%
Trio West Springfield Solar LLP
Project company
UK
A
100%
Trio Power AssetCo 2 Limited
Portfolio-level holdings
UK
S
100%
Trio Dupplin Solar LLP
Project company
UK
S
100%
ORI Canada Sustainable Fuels Holdings Limited
Portfolio-level holdings
Canada
R
22.5%
4571820 Nova Scotia Limited
Portfolio-level holdings
Canada
R
22.5%
4574030 Nova Scotia Limited
Project company
Canada
R
22.5%
Registered offices:
A – Uk House, 5th Floor, 164-182 Oxford Street, London, United Kingdom, W1D 1NN
B – 1 Stokes Place, St. Stephen’s Green, Dublin 2, Dublin, D02 DE03, Ireland
C – Maximilianstraße, 3580539 München, Germany
D – 52 Rue de la Victoire 75009, Paris, France
E – 4 Rue de Marivaux, 75002 Paris, France
F – Z.I de Courtine, 330 rue du Mourelet, 84000. Avignon, France
G – c/o Nordic Generation Oy, Tekniikantie 14, 02150 ESPOO
H – Teknobulevardi 3-5, 01530 Vantaa, Finland
I – Woodbine Hill, Kinsalebeg, Youghal, Co. Cork, Ireland
K – 8 White Oak Square, London Road, Swanley, Kent, United Kingdom, BR8 7AG
L – Dr.-Eberle-Platz 1, 01662 Meißen
M – Lena-Christ-Straße 2, 82031 Grünwald
N – Lorenzgasse 2a, 01662 Meißen
O – 26 Allonby Way, Aylesbury, England, HP21 7JA
P – 5 Howick Place, London, United Kingdom, SW1P 1WG
Q – 13 Queens Road, Aberdeen, Scotland, AB15 4YL
R – 1969 Upper Water Street, Suite 1300, Halifax, Nova Scotia, B3J 3R7
S – C/O Blc Energy Ltd, Mullion House Enterprise Park, Maidenplain Place, Aberuthven, United Kingdom, PH3 1EL
T – Linden House Wrexham Road, Mold Business Park, Mold, Wales, CH7 1XP
20. Capital management objectives, policies and procedures
The Company’s capital management objective is to ensure that the Company will be able to continue as a going concern while maximising the return to equity shareholders. The Company’s investment objective is to provide investors with an attractive and sustainable level of income returns, with an element of capital growth, by investing in a diversified portfolio of Renewable Energy Assets in the UK, Europe and Australia.
The Company considers its capital to comprise ordinary share capital, share premium, special reserve and retained earnings. The Company is not subject to any externally imposed capital requirements. The Company’s total share capital and reserves shown in the Statement of Financial Position are £494,800,000 (2024: £570,370,000).
The Company has implemented an efficient financing structure that enables it to manage its capital effectively.
The Company’s capital structure comprises entirely equity.
The Company’s direct subsidiary, ORIT Holdings II Limited, at 31 December 2025 had a £150.0 million (2024: £270.8 million) revolving credit facility with Allied Irish Banks, National Australia Bank, NatWest and Santander. The facility was £39.9 million drawn as at 31 December 2025 (2024: £151.2 million).
The Board, with the assistance of the Investment Manager, monitors and reviews the broad structure of the Company’s capital on an ongoing basis. This review includes:
• the planned level of gearing, which takes into account the Investment Manager’s views on the market;
• the need to buy back the Company’s own shares for cancellation or to hold in treasury, which takes into account the share price discount;
• the opportunity for issue of new shares; and
• the amount of dividends to be paid, in excess of that which is required to be distributed.
21. Guarantees and uncalled capital commitments
The Company guarantees the foreign exchange hedges entered into by its intermediate holding companies to enable it to minimise its exposure to changes in underlying foreign exchange rates.
As at 31 December 2025, the Company has guarantees in respect of future investment obligations associated with a conditional acquisition in Ireland of £23.7 million (€27.1 million) (2024: £nil).
As at 31 December 2025 the Company’s subsidiaries had future investment obligations totalling £1.25 million (2024: £1.5 million) relating to final wind farm post construction costs.
22. Events after the accounting date that have not been reflected in the financial statements for the year
The Company declared an interim dividend on 2 February 2026 in respect of the three months ended 31 December 2025 of 1.55 pence per Ordinary Share for £8.177 million based on a record date of 13 February 2026, an ex-dividend date of 12 February 2026 and the number of Ordinary Shares in issue being 527,576,939. This dividend was paid on 27 February 2026.
The Directors have evaluated the period since the accounting date and have not noted any other events which have not been reflected in the financial statements.
This information is provided by RNS, the news service of the London Stock Exchange. RNS is approved by the Financial Conduct Authority to act as a Primary Information Provider in the United Kingdom
. Terms and conditions relating to the use and distribution of this information may apply. For further information, please contact rns@lseg.com or visit www.rns.com.
RNS may use your IP address to confirm compliance with the terms and conditions, to analyse how you engage with the information contained in this communication, and to share such analysis on an anonymised basis with others as part of our commercial services. For further information about how RNS and the London Stock Exchange use the personal data you provide us, please see our Privacy Policy.
As we look forward to starting the new financial year, all of the shares in the SNOWBALL have declared their future targets, a couple of have been trimmed but still yield above the current required yield of 7%.
The SNOWBALL is going to buy PHP ahead of their xd date this week.
Regional REIT (LSE: RGL), the regional commercial property specialist, today announces its full year results for the 12 months to 31 December 2025.
Stephen Inglis, Head of ESR Europe LSPIM, Investment Adviser, said:
“Regional REIT delivered good progress last year against its main targets despite continued challenging market conditions. We strengthened the balance sheet with a successful multi-bank refinancing of £72.4m of debt, completed £51.6m of disposals at 1.3% above book value and reduced the LTV to 40.4% at the end of the year. In addition, in a testing letting market the company secured 64 new market lettings at 3.9% above 2024 ERV. We are focussed on continuing this progress in 2026.
However, against a prolonged downturn in the property cycle and with the war in the Middle East adding to geopolitical and economic uncertainty, the leasing market remains subdued, with some tenants taking longer to make decisions, and often choosing not to move at all. While this backdrop continues to temper near‑term activity, emerging supply constraints for quality, energy‑efficient space across key UK regional markets provide a supportive medium‑term outlook.
In this context, the Board feels it is right to act with increased prudence, targeting* an 8p dividend per share for 2026; distributing a minimum 90% of the profit from the property rental business going forward in alignment to the REIT regulation. This will give the Company additional flexibility as we continue our accretive and essential capital expenditure programme to improve our assets and benefit from increasing occupier demand for quality space.
Along with our key objectives to maximise leasing activity and reduce void costs, we remain focused on strengthening the balance sheet further. We are aiming to achieve disposals at a similar level in 2026 as they were in 2025, while progressing targeted asset repositioning to drive long‑term value.
The investment case for regional offices remains clear. There is an increasing supply and demand imbalance for quality office space in the regions, and a looming shortage of Grade A accommodation conforming to EPC A and B. These structural trends, supported by limited new construction in recent years, will ultimately drive higher occupancy in the Regional REIT portfolio and at higher rents, which will underpin improved valuations over the medium term.”
*The dividend target stated in this announcement is a target only and not a profit forecast. There can be no assurance that this target will be met, or that the Company will make any distributions at all and it should not be taken as an indication of the Company’s expected future results.
Portfolio valuation
· Portfolio valuation £555.2m (2024: £622.5m) – driven in part by the sales programme
· Like-for-like portfolio valuation decreased by 5.0% year-on-year, (3.0% decline excluding capital expenditure adjustment, with the benefits yet to be captured in the valuation); reflecting a decline of 2.9% in the second half
· Dividend declared of 10p (2024:7.8p); fully covered
· Plan to distribute a minimum 90% of the profit from the property rental business going forward; targeting a dividend of 8 pence per share dividend for 2026
Return to its Shareholders, with a strong focus on income supported by additional capital growth prospects.
The dividend of 8p is around a yield of 8.5% although if you already own your buying yield will be lower. Nonetheless it provides a fairly ‘secure’ income in troubled times to re-invest back into the SNOWBALL.
Foresight Solar, the fund investing in solar and battery storage assets to build income and growth, announces its results for the year ended 31 December 2025.
Financial highlights
· Delivered a dividend of 8.10 pence per share (pps) for the year, supported by robust operational performance and active power price hedging, with 1.3x cover in line with the Company’s target.
· Announced a target dividend of 8.10pps for 2026, providing flexibility to allocate surplus cash, including to build future dividend cover. At the 23 March 2026 share price, this represents a 13.4% dividend yield.
· Expected 1.1x dividend cover for 2026. Production year-to-date and current contracted revenue hedges are expected to provide 1.0x cover. Uncontracted revenues offer additional upside as energy prices remain elevated.
· Maintained total gearing comfortably within investment policy limits at 41.2%.
· Returned £56.1 million to shareholders through a combination of dividends and share buybacks.
“Based on our track record, I am pleased to announce a target dividend of 8.10pps for 2026. After careful consideration, the Board concluded that it is in the best interest of shareholders to maintain the dividend target. We recognise the importance of cash yield to our investors and remain committed to a progressive dividend strategy. However, holding the target gives us more flexibility to allocate surplus cash, including to build dividend cover for future periods.
BlackRock World Mining Trust PLC ex-dividend date Chelverton UK Dividend Trust PLC ex-dividend date Fidelity European Trust PLC ex-dividend date Gore Street Energy Storage Fund PLC ex-dividend date Pantheon Infrastructure PLC ex-dividend date Primary Health Properties PLC ex-dividend date Ruffer Investment Co Ltd ex-dividend date Schroder Japan Trust PLC ex-dividend date SEGRO PLC ex-dividend date US Solar Fund PLC ex-dividend date Value & Indexed Property Income Trust PLC ex-dividend date