
Investment Trust Dividends

I’ve sold 267 shares in PHP for a ‘profit’ of £250.00.
There are plenty of logical reasons why investors might want to shift out of stocks but the data tells us not to.
By Jonathan Jones,
Editor, Trustnet
‘Time in the market is better than timing the market’ is an old adage used by financial experts and one that is typically thought to be the best way for new investors to think about how to put their money to work.
The idea of staying invested came up again this week in a blog post from abrdn, in which its Asia Pacific team highlighted the below chart.
It shows how much an investor would have made if they had put $10,000 in the S&P 500 back in 2003 and left it fully invested for 20 years.
By comparison, the chart also shows the returns that same investor would have experienced if he or she had missed the 10 best days in the market or fared even worse.
How much an investor would have made with $10,000 over 20yrs
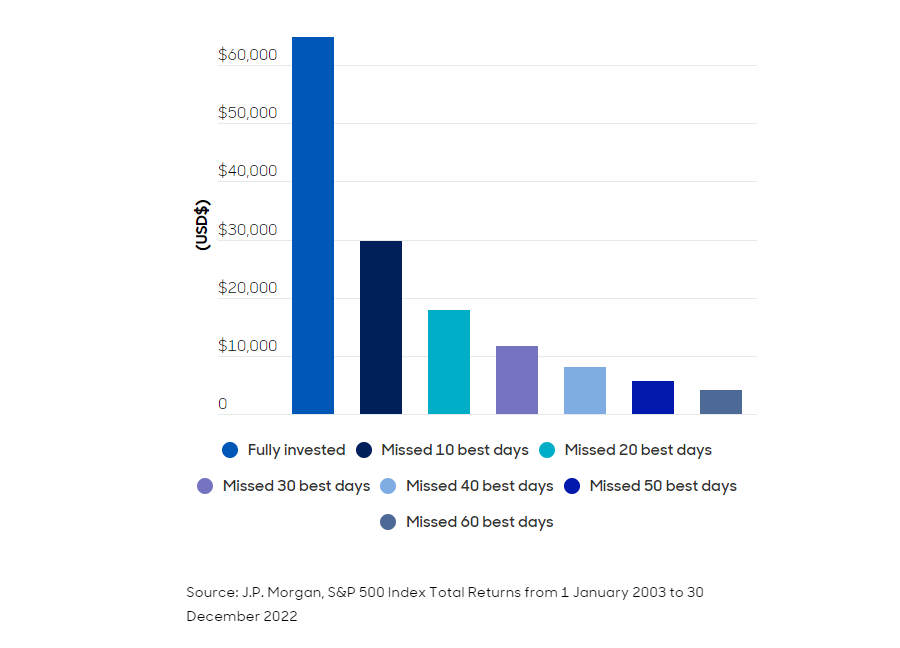
This phenomenon of lowering returns when missing out the best days is particularly compounded for income investors, the research noted, as investors will miss out on dividends throughout any periods their money is not being put to work.
It sounds simple: stay invested throughout and reap the rewards. But there will undoubtedly be some that believe they can do even better – why not try to miss the worst days and still reap the rewards of the best?
The reason this is so difficult to do in practice, however, is because quite often these best days come shortly, or even immediately, after the worst days – making it incredibly hard to time.
Yet it would not come as a surprise if investors have in fact been making changes to their portfolios during the past couple of tumultuous years. Indeed, there are plenty of logical reasons why they might want to consider pulling their money out of stocks.
First, cash and bonds now offer compelling yields for the first time in more than a decade, giving investors the chance to move down the risk scale and still achieve steady returns.
This has been compounded by several big events including Covid-19, war in Europe and the Middle East and – new to 2024 – an array of elections in countries around the world including the UK, US and India. All of these have at times posed significant risks to markets.
Then there are the macroeconomic pressures. Inflation has dropped but the final push to central banks’ 2% target is proving difficult to achieve, leaving interest rates in limbo at present and causing more concern that rates may stay higher for longer – something markets are not favourable on.
Lastly, turning to markets themselves, it is easy to come up with arguments as to why now may be a good time to take profits from expensive US stocks such as Nvidia and the other ‘Magnificent Seven’ names that have dominated for the past 18 months, or the ‘Granolas’ in Europe, which have rocketed in recent years.
An investor looking at any or all of these factors could be forgiven for making changes to their portfolios and shifting exposures, taking profits or selling out entirely.
Despite plenty of reasons to move your money elsewhere, whether it be to take on less risk through bonds and cash options, or to move outside of expensive areas such as the US, the data always reminds us that the best course of action is to stay the course and remain invested.
The January Effect, the Santa Claus Rally, Sell in May – all well known theories surrounding the seasonality of stock markets. But could there also be another one specifically for London’s investment companies?
By Frank Buhagiar

Theories surrounding the seasonality of stock markets are nothing new. There’s the January Effect – the theory that share prices increase in the first month of each year as investors buy back stocks they had sold in December in order to crystallise losses that can then be used to offset capital gains and so lower tax bills.
Then there’s ‘sell in May and go away’, based on the tendency for stocks to perform better during November to April compared to May to October, and according to Fidelity Investments, the numbers since 1990 appear to back this up – on average the S&P 500 has gained 2% between May and October; for the November-April period, this rises to 7%. Fidelity goes on to note that the outperformance is not confined to just large caps – the respective S&P indices for small caps and global stocks show a similar seasonal performance divide too.
And don’t forget the Santa Claus rally, bringing with it buoyant markets in the run-up to the Christmas holidays. According to The Stock Trader’s Almanac which looked at data covering 1950-2022, stocks have rallied during the final five trading days of the year and the first two trading days of the new year on 58 occasions. Out of a total of 73 years, that’s around an 80% hit rate.
Debate continues over whether the above have legs or whether they are merely a series of unrelated statistical coincidences. Why am I mentioning them here? To highlight firstly how stock market seasonality theories are taken seriously (that is if the amount of research and articles on them is anything to go by) and to show that the title of this Deep Dive, Are investment company discounts seasonal ?, is not as leftfield as perhaps it first sounds.
Having said that, an admission. The question around the seasonality of investment company discounts is not based on an extensive historical dataset that stretches back 100 years or so. It doesn’t extend to 50 years or even 20 years for that matter. No, the question is based on just two years’ worth of data. BUT, before readers make a mad dash for the exit, consider the two graphs below.
The first charts the number of investment companies trading at 52-wk high discounts during the first 17 weeks of 2023: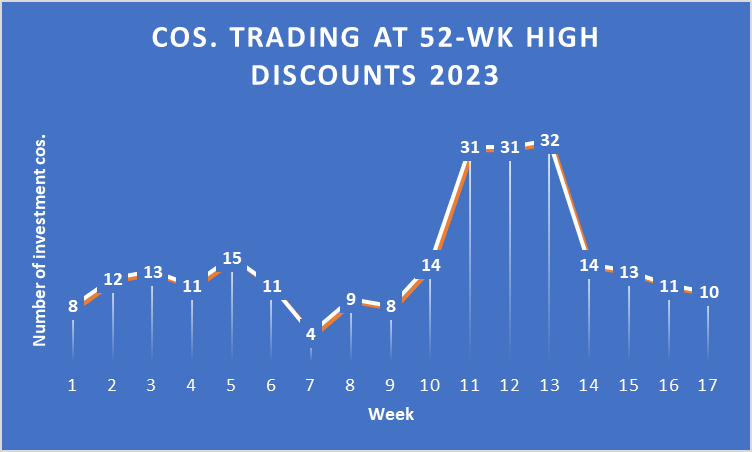
The second charts the number of investment companies trading at 52-wk high discounts during the first 17 weeks of 2024: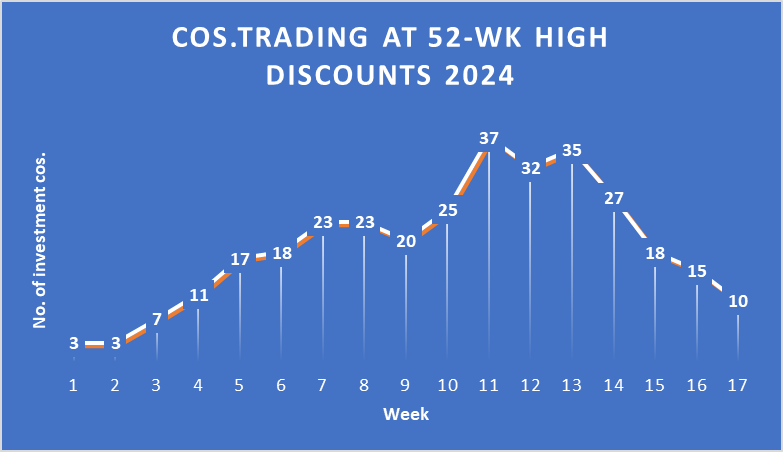
The two graphs were never going to be identical but there is nevertheless a high degree of commonality:
Very limited sample of course. The numbers are not an exact match. And we don’t have two full years’ worth of data. Even so, enough there to catch the eye and enough to warrant having a stab at coming up with a plausible explanation for why the two graphs closely resemble each other.
Looking at each month covered in the above graphs in turn, January appears to be a rather sedate/mildly positive opening to the new year. Possibly, a general feeling of positivity for the 12-month period ahead? New year, new hope and all that.
February/March does reality hit? 2023, it was a banking crisis – Silicon Valley Bank, Signature Bank and First Republic all collapsed within days of each other during March. As for 2024, the February/March 2024 sting coincided with the realisation that central bankers in the US, Europe and the UK were unlikely to be cutting interest rates anytime soon. With the timeframe for interest rate cuts being pushed out deeper into the year, the higher for longer narrative gained momentum, resulting in an uptick in 52-wk high discounts, particularly for those funds sensitive to high interest rates such as alternatives and equity income trusts.
Already, a flaw. February/March movements in the 52-week high discounter tally are centred around seemingly random events – banks don’t just get into trouble in the months of February and March. And neither does the interest rate narrative only shift during those same two months. All a little flimsy.
That may be true for the first three observations above, but what about number 4? Both graphs show a significant drop in companies trading at year-high discounts from week 13 onward – roundabout the end of March. How to explain the decline in 52-wk high discounts at a time when 2023’s bank failures were still fresh in the memory and when the timing of interest rate cuts in 2024 continued to be pushed further out? What could be behind the turnaround in fortunes in terms of investment company discounts?
Perhaps there is something special about Week 13 of the year. Week 13 in 2024 covered the five trading days to Friday 29 March. Week 13 in 2023 covered the five trading days to Friday 31 March. In other words, both fell slap bang in the middle of the annual mad dash to get financial matters in order before the end of the UK tax year on 5 April.
One financial matter to get done and dusted before the financial year end? Utilising the annual Individual Savings Account (ISA) allowance to take advantage of the tax benefits on offer. And what do investors tend to buy in their stocks and shares ISAs? Investment companies, at least that’s what the most successful ISA investors, the ISA Millionaires, buy. According to MoneyWeek’s March 2024 article.
How to invest like an ISA millionaire, investment trusts account for 41.9% of those ISA Millionaire portfolios that use the interactive investor (ii) platform, comfortably ahead of the next biggest share direct equities on 37.8% of portfolios – other funds account for 11%, while exchange-traded funds make up just 4.1%.
Okay, investment trusts may not be top of the tree for all ISA accounts held on ii’s platform, but they do still account for a healthy-looking 24.1% of portfolios.
Of course, not all investors leave it to the last minute to utilise their annual ISA allowances. Chances are though a fair few do. Perhaps enough to generate an uptick in share prices and in the process a narrowing of discounts. After all, investors wouldn’t be the only ones to leave things to the last minute.
And look at what happens after Week 13. In both years, the first few weeks of the new tax year see further falls in the discounter tally. Is this because subscriptions made just before the ending of the old tax year are invested? What’s more, according to ii’s observations, their ISA Millionaires tend to be ‘early bird investors’, meaning they waste no time in investing their ISA allowances for the new financial year – could be another reason why year-high discounter numbers continue to fall off in the first few weeks of the new tax year.
If u invest in a SIPP the government adds to your contributions.
Under current tax law, when u access your SIPP 25% can be withdrawn tax free and the balance is taxed at your current rate.
With an ISA all withdrawals are free of tax.
So if u have a longer term frame and u can compound your contributions, a SIPP could be the better option.
As u get nearer to accessing the funds, current pension age 55, it may be better to contribute some funds to an ISA, which could act as an emergency fund or the dividends could be withdrawn, to supplement your income.

Right now, second incomes are a hot topic. In the current financial environment, everyone is looking to generate a bit of extra money on the side.
The first step in my plan involves opening a Stocks and Shares ISA is a type of investment account in which all gains and income are tax-free.
The tax-free feature is key. If I was to generate £10k in income within this type of account, I wouldn’t have to pay a penny of Income Tax on it.
Please note that tax treatment depends on the individual circumstances of each client and may be subject to change in future. The content in this article is provided for information purposes only. It is not intended to be, neither does it constitute, any form of tax advice. Readers are responsible for carrying out their own due diligence and for obtaining professional advice before making any investment decisions.
The next step involves building up a large lump sum, in order to generate the second income. That £500 a month equates to £6,000 a year.
How much capital would be required to create that much income consistently ?Well, it would depend on the rate of interest/yield that was achievable.
But let’s assume that in the future, it’s possible to achieve a yield of 6% (more on this in step three).
In this scenario, an investor would need to build up £100,000 to generate an income of £6,000 a year (£100,000 x 0.06 = £6,000).
Now, building up this amount of capital may sound like a daunting task. However, with a regular savings plan and a decent investment strategy, a £100k goal is very achievable, even starting from scratch.
For example, I calculate that if an investor puts £1,000 a month into an ISA and achieves a return of 8.5% a year on their money by investing in diversified portfolio of shares they could build £100k in a little over six years.
Of course, picking the right stocks, they might be able to get to £100k much faster.
The final step in my plan involves investing the capital in a mix of income-generating assets to secure the second income.
Now, if I was looking to generate a yield of 6%, I’d take a multi-pronged approach. I’d have some money in high-interest cash savings products (eg Cash ISAs) and bonds.
And then I’d have some money in dividend stocks. These pay out of a proportion of company earnings to shareholders in cash on a regular basis.
And they often have very attractive yields. For example, HSBC shares currently offer a yield of around 8%.
I reckon a 6% yield should be very achievable with this combination of dividend stocks, bonds, and savings accounts.

A Trust for DYOR, could be a buy one day, although today is not one day.
With most of the dividends declared for the first six months of the year the first income prediction at the half way stage for 2024 is around £5,100.00
Which is ahead of the fcast of 8k and the target for the year of 9k, which equates to the plans target for the end of 2027.
Stick to your plan until it sticks to you.

Who Was Micawber and What is His Principle?
In the book David Copperfield, written in 1850 by Charles Dickens, the orphaned title character is sent to work in a factory in another town. Arrangements are made for young David to rent a room in the home of Wilkins Micawber. Mr. Micawber is fond of offering advice to David and not long after he moves in Mr. Micawber confidently states:
Annual income twenty pounds, annual expenditure nineteen, nineteen and six, result happiness. Annual income twenty pounds, annual expenditure twenty pounds ought and six, result misery.
Although impressed with this sound financial advice it soon becomes obvious to David that Mr. Micawber is completely unable to follow it, as he faces one financial crisis after another. Mr. Micawber becomes a father figure to David (it is widely thought the character is based on Dickens’ own father, who also had severe financial troubles) and David is able to observe firsthand the negative consequences of living beyond your means. Mr. Micawber’s financial advice, in spite of his inability to live it, has resonated over the years and has come to be known as The Micawber Principle.
There you have it. In two short, simple sentences Charles Dickens stated the fundamental law of personal finance in an unforgettable way. Spending less than you earn – consistently, over time – will lead to at least some degree of financial success. Spending more than you earn will lead to financial misery, which is likely to negatively affect other areas of your life. It really is that simple. If you can’t live The Micawber Principle no other financial advice matters. It is the foundation of personal financial success.
Of course, we need to acknowledge that while the principle is simple, putting it in practice, as Wilkins Micawber illustrates, is difficult. That is because it requires disciplining ourselves, which is never an easy thing to do.
What We Learn from the Micawber Principle
Although The Micawber Principle is short and simple it communicates several important truths about personal finance. Among these are:
Spending is More Important than Income – The difference between financial happiness and misery isn’t how much you make (annual income is twenty pounds in both scenarios) but in spending less than you make. I think we can all agree that more income is better than less, but if we use our income as an excuse for not living the Micawber Principle we will likely find we cannot live it no matter how much we make. The key is to discipline ourselves to live within our means now and then widen the gap between income and spending as we make more.
Little Things Matter – The difference between financial success and financial difficulty is often small in the short term, but is magnified over time. This leads to the inescapable conclusion that to win we have to keep score. If we don’t know whether we are winning or losing we are more likely to let questionable financial decisions become habits, and before we know it we are in real trouble.
Direction is More Important than Speed – The Micawber Principle could be described as a Get Rich Slow Scheme. Small financial wins give us hope and build momentum for greater wins in the future.
There are Consequences to Financial Decisions – The Micawber Principle clearly illustrates the universal law that there are consequences to our actions. We can choose our actions, but not the consequences.
What Becomes of Wilkins Micawber?
When we left Mr. Micawber he was bumbling through life completely unable to follow his own financial advice. At the end of the story Mr. Micawber and his family emigrate from England to Australia. Mr. Micawber makes the most of his fresh start and becomes a respected lawyer, achieves financial success, and continues teaching the principle that bears his name (now both by word and example). The happy ending should give all of us hope that, regardless of the past, it is never too late to change our financial habits and fortunes. Your new beginning starts now, and you don’t even have to move to Australia.
© 2026 Passive Income Live
Theme by Anders Noren — Up ↑