Are investment company discounts seasonal?
The January Effect, the Santa Claus Rally, Sell in May – all well known theories surrounding the seasonality of stock markets. But could there also be another one specifically for London’s investment companies?
By Frank Buhagiar

Theories surrounding the seasonality of stock markets are nothing new. There’s the January Effect – the theory that share prices increase in the first month of each year as investors buy back stocks they had sold in December in order to crystallise losses that can then be used to offset capital gains and so lower tax bills.
Then there’s ‘sell in May and go away’, based on the tendency for stocks to perform better during November to April compared to May to October, and according to Fidelity Investments, the numbers since 1990 appear to back this up – on average the S&P 500 has gained 2% between May and October; for the November-April period, this rises to 7%. Fidelity goes on to note that the outperformance is not confined to just large caps – the respective S&P indices for small caps and global stocks show a similar seasonal performance divide too.
And don’t forget the Santa Claus rally, bringing with it buoyant markets in the run-up to the Christmas holidays. According to The Stock Trader’s Almanac which looked at data covering 1950-2022, stocks have rallied during the final five trading days of the year and the first two trading days of the new year on 58 occasions. Out of a total of 73 years, that’s around an 80% hit rate.
Debate continues over whether the above have legs or whether they are merely a series of unrelated statistical coincidences. Why am I mentioning them here? To highlight firstly how stock market seasonality theories are taken seriously (that is if the amount of research and articles on them is anything to go by) and to show that the title of this Deep Dive, Are investment company discounts seasonal ?, is not as leftfield as perhaps it first sounds.
The evidence
Having said that, an admission. The question around the seasonality of investment company discounts is not based on an extensive historical dataset that stretches back 100 years or so. It doesn’t extend to 50 years or even 20 years for that matter. No, the question is based on just two years’ worth of data. BUT, before readers make a mad dash for the exit, consider the two graphs below.
The first charts the number of investment companies trading at 52-wk high discounts during the first 17 weeks of 2023: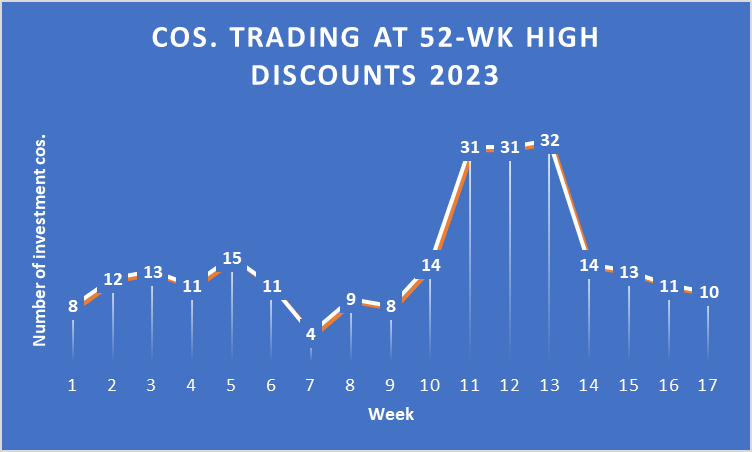
The second charts the number of investment companies trading at 52-wk high discounts during the first 17 weeks of 2024: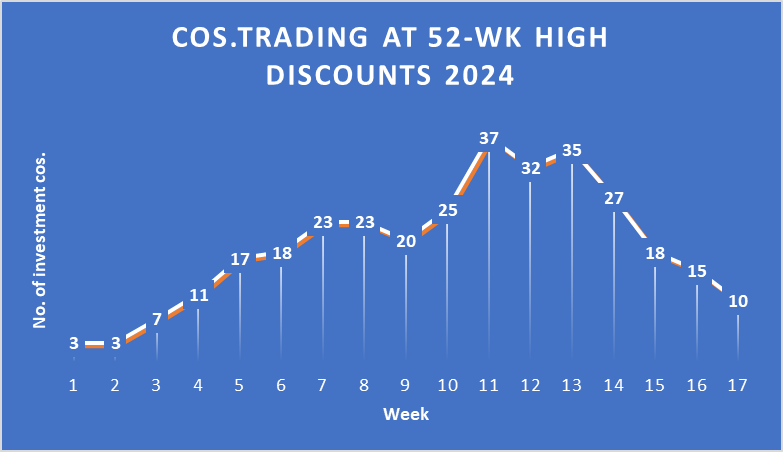
The two graphs were never going to be identical but there is nevertheless a high degree of commonality:
- Both had 10 companies trading at year-high discounts over the course of the 17th week.
- Both start their respective years with relatively low numbers of funds on 52-wk high discounts to net assets
- Both experience a noticeable pick-up in the 52-wk high discounter tally from week nine onwards – roundabout the beginning of March
- Both see the number of 52-wk high discounters top out during weeks 11-13 – the lion’s share of the month of March
- Both enjoy a significant drop in companies trading at year-high discounts from week 13 onwards – roundabout the end of March
Very limited sample of course. The numbers are not an exact match. And we don’t have two full years’ worth of data. Even so, enough there to catch the eye and enough to warrant having a stab at coming up with a plausible explanation for why the two graphs closely resemble each other.
In search of a theory
Looking at each month covered in the above graphs in turn, January appears to be a rather sedate/mildly positive opening to the new year. Possibly, a general feeling of positivity for the 12-month period ahead? New year, new hope and all that.
February/March does reality hit? 2023, it was a banking crisis – Silicon Valley Bank, Signature Bank and First Republic all collapsed within days of each other during March. As for 2024, the February/March 2024 sting coincided with the realisation that central bankers in the US, Europe and the UK were unlikely to be cutting interest rates anytime soon. With the timeframe for interest rate cuts being pushed out deeper into the year, the higher for longer narrative gained momentum, resulting in an uptick in 52-wk high discounts, particularly for those funds sensitive to high interest rates such as alternatives and equity income trusts.
Flawed?
Already, a flaw. February/March movements in the 52-week high discounter tally are centred around seemingly random events – banks don’t just get into trouble in the months of February and March. And neither does the interest rate narrative only shift during those same two months. All a little flimsy.
That may be true for the first three observations above, but what about number 4? Both graphs show a significant drop in companies trading at year-high discounts from week 13 onward – roundabout the end of March. How to explain the decline in 52-wk high discounts at a time when 2023’s bank failures were still fresh in the memory and when the timing of interest rate cuts in 2024 continued to be pushed further out? What could be behind the turnaround in fortunes in terms of investment company discounts?
Week 13 – lucky for some
Perhaps there is something special about Week 13 of the year. Week 13 in 2024 covered the five trading days to Friday 29 March. Week 13 in 2023 covered the five trading days to Friday 31 March. In other words, both fell slap bang in the middle of the annual mad dash to get financial matters in order before the end of the UK tax year on 5 April.
One financial matter to get done and dusted before the financial year end? Utilising the annual Individual Savings Account (ISA) allowance to take advantage of the tax benefits on offer. And what do investors tend to buy in their stocks and shares ISAs? Investment companies, at least that’s what the most successful ISA investors, the ISA Millionaires, buy. According to MoneyWeek’s March 2024 article.
How to invest like an ISA millionaire, investment trusts account for 41.9% of those ISA Millionaire portfolios that use the interactive investor (ii) platform, comfortably ahead of the next biggest share direct equities on 37.8% of portfolios – other funds account for 11%, while exchange-traded funds make up just 4.1%.
Okay, investment trusts may not be top of the tree for all ISA accounts held on ii’s platform, but they do still account for a healthy-looking 24.1% of portfolios.
Of course, not all investors leave it to the last minute to utilise their annual ISA allowances. Chances are though a fair few do. Perhaps enough to generate an uptick in share prices and in the process a narrowing of discounts. After all, investors wouldn’t be the only ones to leave things to the last minute.
And look at what happens after Week 13. In both years, the first few weeks of the new tax year see further falls in the discounter tally. Is this because subscriptions made just before the ending of the old tax year are invested? What’s more, according to ii’s observations, their ISA Millionaires tend to be ‘early bird investors’, meaning they waste no time in investing their ISA allowances for the new financial year – could be another reason why year-high discounter numbers continue to fall off in the first few weeks of the new tax year.
Leave a Reply