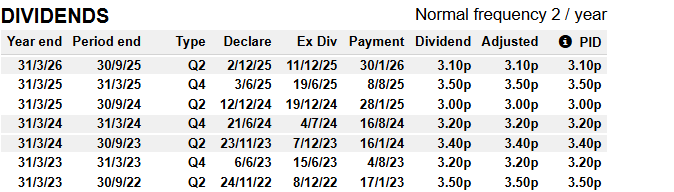
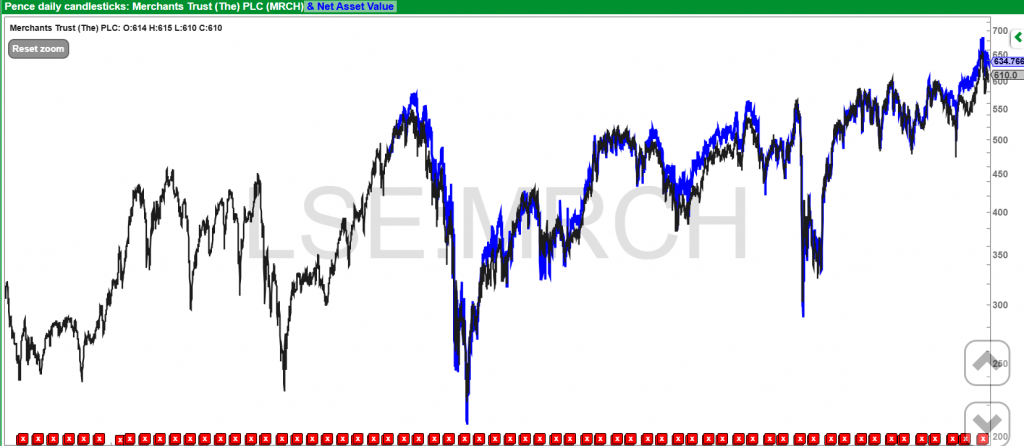
All shares fall by the amount of the announced dividend on the xd date.
Whilst in the short term it may be correct, although in a strong market some shares do not fall by the amount of the dividend announced, after every xd date the share price was higher than before the xd date.
In times of market stress it may take several years for the above to be true but true it is, if you own the right share, MRCH is a dividend hero.
This Dividend Strategy Beats FOMO, Pays 8%+ in Cash
by Michael Foster, Investment Strategist
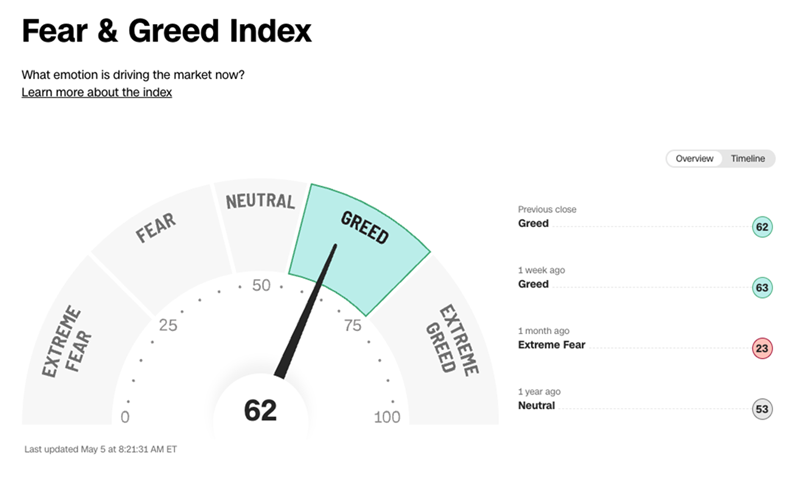
There’s a big disconnect between the headlines and vanilla investors’ mood these days.
The headlines? Dark. Investors? Greedy.
Source: CNN The CNN Fear & Greed Index has its flaws, but on the whole is a decent indicator of where investors’ heads are. As we can see here, despite the Iran conflict, they’re giddy.
At times like these, it pays for us contrarians to be cautious.
For us closed-end fund (CEF) investors, however, this isn’t a big concern. The funds in our CEF Insider portfolio (21 in all, with an average current yield of 7.9%) are run by pros we can count on to navigate overly exuberant times like this.
But even so, when greed runs high, it’s easier to let FOMO lure us off our income path. The result could be a situation where we trade too much (or worse, on emotion). Some people could take that to an extreme and even take a stab at day trading.
Let’s talk a bit more about that. While it is a little outside our beat here at CEF Insider, a look at day trading is a useful exercise in what not to do when it comes to investing, and why we continue to recommend a longer-term, dividend focused strategy instead.
As we’ll see, getting caught up in day trading is at best many hours of work (the opposite of what we want: to be retired!) and at worst a one-way ticket to losses.
Yes, You Can Beat the Market Day Trading
Let’s start with what should really be the goal of any day trader: to beat the market. A lot of ink has been spilled about how active managers – and I’d include individual investors here – simply can’t do so. This is nonsense. Plenty of portfolio managers and individual investors do beat the market – and they do so regularly.
Actively managed CEFs are a good illustration of this, as plenty sport histories of beating their benchmarks. Consider an equity CEF called the Adams Diversified Equity Fund (ADX), a CEF Insider pick we’ll talk more about below.
Over the last decade, ADX (in purple below), which holds many of the blue chips you’d find in an S&P 500 index fund, has returned 373%, well ahead of the index’s 316%.
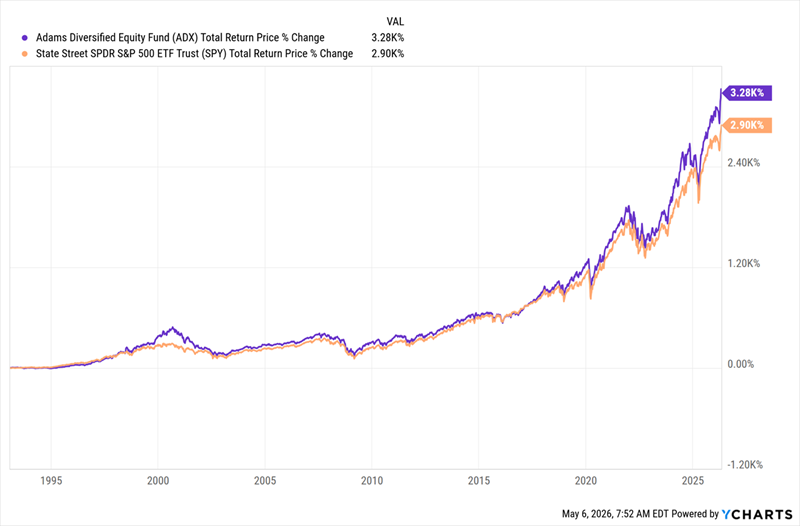
ADX Has Beaten the Market in the Last Decade … And if we zoom out, we see that this 8% payer has been doing this for much longer than a decade.
… And in the Longer Run, Too Market outperformance gets even easier when you look beyond stocks, to assets like real estate investment trusts (REITs), corporate bonds and municipal bonds.
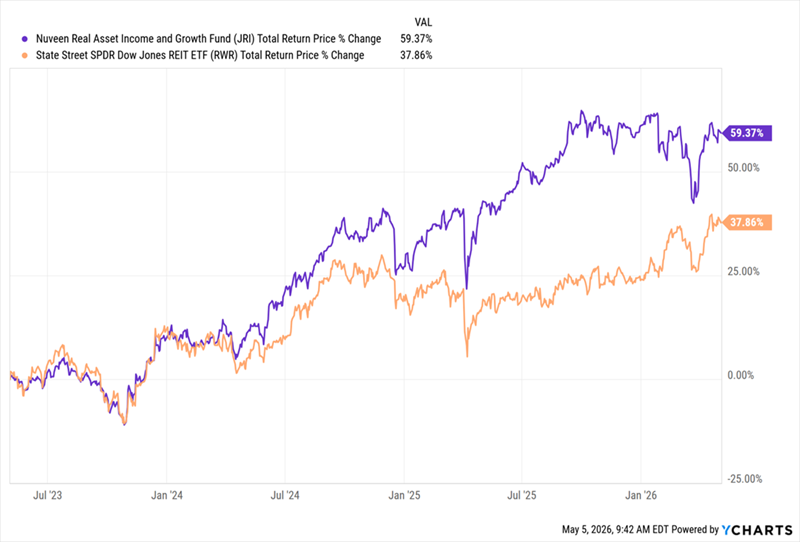
CEFs offer another example here, with another CEF Insider holding, the 12.4%-yielding Nuveen Real Asset Income and Growth Fund (JRI), posting a total return far larger than its REIT benchmark over the last three years, as REITs regained their footing following the 2022 interest-rate spike:
12.4%-Paying REIT CEF Beats Its Index But let’s keep the focus on day trading. What I’m trying to show above is that it is possible for a “human” manager to beat their index. So it’s possible for day trader, too.
Where to Start – and How It Usually Ends
A good place to start is the field you know best. Let’s consider a hypothetical investor who is a retired HVAC engineer. Could that expertise help them identify strong HVAC firms better than a Harvard-educated investment banker could?
Of course. Which is why investment banks hire firms to help them gain the expertise of people skilled in one field. Our investor, as a day trader, might be able to cut out the middleman – the banks collecting all that expertise – and beat the market.
Even so, the math says day trading is still unlikely to work out in the end.
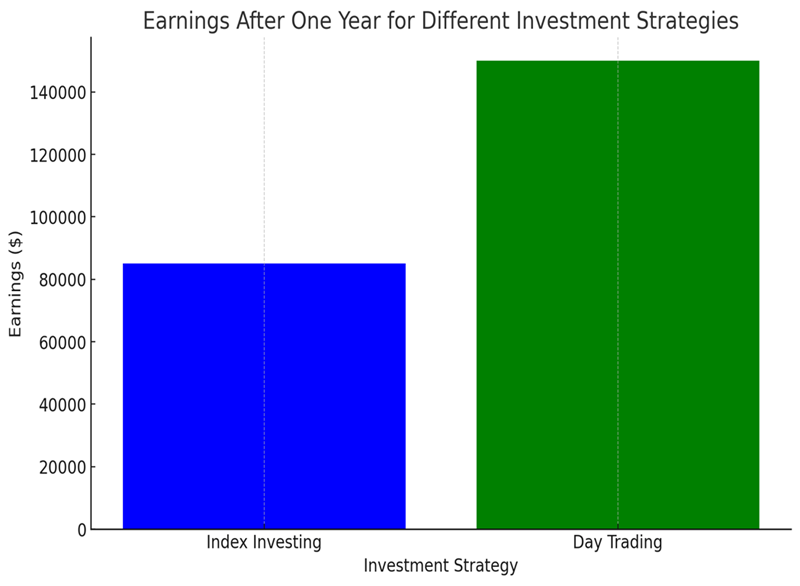
Let’s say another investor has a million dollars and invests in an index fund with an average annualized return of 8.5% – more or less the stock market’s long-term return.
For our day-trading scenario, let’s be (very) generous and say a 15% average annualized return is on the table here.
Source: CEF Insider Bearing these assumptions in mind, the difference in favor of day trading is $65,000 – a lot of cash, I’ll admit.
But let’s translate that into time. US stock markets are open 6.5 hours a day, five days a week, with few days off. That translates to 1,631.5 hours a year of work, meaning you’ve earned a bit less than $40 an hour.
If that’s more than you earn now and you’re 100% confident you won’t make a mistake you can’t recover from – great. But even under these circumstances, we need to be clear that we haven’t found financial independence here. We’ve just found a new full-time job as an asset manager.
Of course, any day trader will tell you that they don’t just work during market hours, so that $40 per hour will be less. We can fix this by earning a bigger return: The day trader who is confident they will earn 150% annually, on average (an extreme figure, to be sure), would make $867 an hour for their labor on a million-dollar investment.
Impressive, I suppose, although many in finance earn more doing things that are much less stressful. But clearly, no matter how good we are at it or how much money we can make, day trading is a job, and the risk is much greater when it’s with our own money.
The Passive-Income Alternative
With dividend yields averaging over 7%, CEFs are a far better approach for just about all investors because they “translate” long-term capital gains from stocks and other assets into an income stream.
That 7% is actually an understatement: It’s dragged down by a lot of municipal-bond CEFs that yield less, but since their income is tax-free for most Americans, tend to be the equivalent of around 8% for median US earners (and more for higher earners).
Equity CEFs, for their part, average an 8% yield over the long term. That’s key because it means we can get the 8.5% annualized profits of the stock market almost entirely in the form of dividends. The aforementioned 8%-yielding ADX is a good example of this, delivering nearly the market’s return in payouts.
Over the last 15 years, ADX has paid out a total of $21.25 per share in dividends. Investors who bought then and have collected payouts since have earned a 12.3% yield on their initial investment.
Also, ADX shares are now 108% higher than they were 15 years ago, as I write this. So on top of that 12.3% yield, they’re sitting on gains that have more than doubled their investment.
Finally, what we like the most is the lower risk involved. One major mistake with day trading can wipe out a trader’s life savings; ADX has been a profitable company since 1854 and a profitable CEF since 1929. While hundreds of day traders are ruined every year, ADX has held fast through ups and downs over more than a century.
Which is why we at CEF Insider continue to see buying quality CEFs, holding for the long term and collecting their high dividends as a much better way to go.
4 Cheap CEFs Yielding 10% as AI Reshapes the Economy
Many investors still see day traders as heroes. We saw this in the GameStop fiasco, and the meme-stock trend that still persists today.
They don’t see the hours and hours of work needed – or the high failure rates.
It reminds me of the misconceptions around AI.
Also, ADX shares are now 108% higher than they were 15 years ago, as I write this. So on top of that 12.3% yield, they’re sitting on gains that have more than doubled their investment.
Perfect — let’s build you a clean, powerful, UK‑focused dividend‑income strategy using investment trusts, designed for monthly or quarterly cashflow, long‑term reliability, and discount‑driven upside.
This is not financial advice, but a structured framework you can use to think like an income‑focused portfolio architect.
Core idea: Blend reliable dividend growers, high‑yield credit/infrastructure, and discount‑opportunistic trusts to create a stable, rising income stream.
Below is the full blueprint.
🏛 1. Define the income style you want
There are three main “income personalities” in the UK trust universe:
A) Reliability First — “Never cut, always pay”
These are the Dividend Heroes and Next Generation Dividend Heroes — trusts with 20–50+ years of rising dividends.
Use these for:
Stability
Predictability
Inflation‑beating dividend growth
B) High Yield — “Pay me now”
These are infrastructure, credit, property, and alternative‑income trusts. They pay 6–10% yields, but dividends may be flat or variable.
Use these for:
High monthly/quarterly income
Cashflow today
C) Discount Hunters — “Buy £1 for 70p”
Many UK trusts trade at 10–30% discounts. Buying at a discount boosts:
Yield on cost
Long‑term total return
Potential discount narrowing gains
Use these for:
Opportunistic value
Long‑term compounding
🧱 2. Build the structure: The 40/40/20 Model
This is the most balanced UK income structure:
40% — Dividend Heroes (Stability Layer)
Purpose: Predictable, rising income Characteristics:
20–50 years of consecutive dividend increases
Global equity exposure
Lower volatility
This layer is your “income backbone”.
40% — High‑Yield Alternatives (Cashflow Layer)
Purpose: Boost yield to 6–8% overall Includes:
Infrastructure
Renewable energy
Specialist credit
Property income
Asset‑backed lending
These trusts often pay quarterly or monthly.
20% — Discount Opportunities (Value Layer)
Purpose: Enhance long‑term returns Focus on:
Trusts at unusually wide discounts
Sectors out of favour
Cyclical opportunities
This layer adds torque to the portfolio.
📅 3. Choose your income frequency
You can build:
Monthly income
Use:
Infrastructure
Credit
Property
Some specialist income trusts
Quarterly income
Most equity income trusts pay quarterly.
Blended monthly/quarterly
Stagger ex‑dividend dates to smooth cashflow.
📈 4. Target yield and growth
A strong UK income portfolio typically aims for:
Target yield: 5–7%
Dividend growth: 3–6% per year
Volatility: Lower than pure equities
Discount capture: 1–3% per year long‑term
This gives you high income today + rising income tomorrow.
🧮 5. Example structure (no specific tickers)
This is a model, not a recommendation:
40% Dividend Heroes
Global equity income
UK equity income
Asia income
Multi‑asset income
40% High‑Yield Alternatives
Infrastructure
Renewable energy
Specialist credit
Property income
20% Discount Opportunities
Out‑of‑favour sectors
Deep‑discount trusts
Cyclical recovery plays
This gives you:
Stability
High yield
Upside from discounts
🧩 6. How to maintain the strategy
Quarterly review checklist
Are discounts widening or narrowing?
Has dividend cover changed?
Are yields sustainable?
Is gearing rising too fast?
Are NAV returns keeping up with benchmarks?
Annual rebalance
Trim winners
Add to wide‑discount opportunities
Maintain your 40/40/20 structure
🔥 7. Optional: Build a Monthly Income Calendar
You can create a 12‑month income stream by staggering trusts with different payment months.
Example pattern:
Group A pays Jan/Apr/Jul/Oct
Group B pays Feb/May/Aug/Nov
Group C pays Mar/Jun/Sep/Dec
This gives you income every month.
🎯 One question to tailor this to you
Do you want your Snowball to prioritise
(A) maximum yield
(B) maximum stability
(C) a balanced blend ?
40/40/20 structure, is not a recommendation as your Snowball should reflect and change depending on the number of years you have before you withdraw your dividends to pay your bills.
Quarterly review checklist
It’s your duty to check the next fcast dividend and
I’ve bought for the SNOWBALL 13300 shares in New River Reit for 10k.
NewRiver REIT plc (“NewRiver” or the “Company”)
Full Year Trading Update
Capital & Regional successfully integrated, operational outperformance and balance sheet strengthened NewRiver today provides a trading update for the year ended 31 March 2026 ahead of its Full Year Results, which will be announced in June 2026.
● Capital & Regional (“C&R”) assets successfully integrated and delivering growth during first full year of ownership: cost synergies unlocked and London retail weighting increased to 43% of portfolio ● Operational outperformance reflecting continued strength of underlying occupiers and portfolio position ● Continued valuation growth in H2, representing third consecutive half year period of growth ● Balance sheet further strengthened through recent refinancing, which along with disposal activity, has reduced LTV to close to medium-term guidance level of <40% ● FY26 Underlying Funds From Operations (‘UFFO’) per share and EPRA Net Tangible Assets (‘NTA’) per share expected to be in-line with analyst consensus Allan Lockhart, Chief Executive, commented: “Our first full year of ownership of the Capital & Regional portfolio has delivered against the strategic objectives of the transaction. Integration is complete, all of the identified synergies have been delivered and the enlarged portfolio has generated positive operational momentum and continued valuation growth. We have combined this with disciplined capital allocation, disposing of assets at book value, executing an accretive share buyback, and completing a refinancing that returns the Group to a fully unsecured debt structure with extended maturities. Against a more volatile macro backdrop, NewRiver is well-positioned. The portfolio has been strengthened, and we have the platform, pipeline, and balance sheet to deliver growth.” Capital & Regional acquisition delivering growth: synergies unlocked and London retail weighting increased ● C&R assets fully integrated onto NewRiver’s platform; £6.2 million of annual net cost synergies unlocked ● London retail weighting increased to 43% of portfolio. London retail long-term leasing transactions at +12.8% vs ERV, +31.8% above previous passing rent, and capital value growth of +2.0% in FY26 ● Snozone delivered another year of growth, with full year EBITDA of £3.2 million up +10% year-on-year Operational outperformance reflecting continued strength of underlying occupiers and portfolio position ● 930,700 sq ft of leasing in FY26; 185 long-term transactions secured £9.1 million of annual rent at +8.5% vs ERV, +37.3% above previous passing rent, with a WALE of 9.0 years ● High occupancy maintained at 95.0%; tenant retention remains strong at 92.7% ● Consumer spending across the portfolio grew +2.3% in Q4 (to March 2026), ahead of the benchmark (+0.8%). Groceries (+7.2%) and Discount (+9.8%) within our portfolio remained strong – reinforcing the resilience of our essential, everyday retail focus Disciplined capital allocation, disposals at book value and continued valuation growth ● Portfolio capital values increased +0.5% in H2 and +0.7% on a like-for-like basis for FY26 ● Retail disposals of £110 million in-line with March 2025 book values, including H2 sales of The Marlowes in Hemel Hempstead, Sprucefield Retail Park in Lisburn and Cuckoo Bridge Retail Park in Dumfries
● A proportion of FY26 disposal proceeds were recycled into a 10% share buyback which was accretive to both UFFO and Net Tangible Assets on a per share basis ● Following the C&R acquisition, FY26 disposals and the repositioning of the Capitol Centre, Cardiff, the portfolio is now 76% Core Shopping Centres, 20% Retail Parks, 3% Regeneration and only 1% Work Out
● LTV reduced to close to 40% guidance and cash increased to c.£115 million, providing additional balance sheet strength £240m refinancing: longer maturities, returning to a fully unsecured debt structure ● New £240 million unsecured facility agreed in April 2026: £120 million Term Facility Commitment (matures in April 2030, extendable to April 20333) at a margin of 190 bps and £120 million Revolving Credit Facility (“RCF”) (matures in April 2031, extendable to April 20333) at a margin of 175 bps ● The Term Facility will refinance the secured £140 million Mall Facility in January 2027, which was retained following the C&R acquisition due to its attractive 3.5% coupon; delayed draw structure delivers a saving of approximately £1.4 million in FY27 vs drawing the facility immediately ● The RCF is £20 million larger than the facility it replaces with a significant margin reduction
Short answer:“Dividend washing” (also called dividend stripping) is a tax‑arbitrage strategy, not a legitimate way to “make a profit” from UK investment trusts — and HMRC explicitly targets it. Investment trusts must distribute most of their incomeas dividends, but you cannot legally “wash” those dividends for tax advantage.
🧩 What “dividend washing” actually is
Dividend washing (a form of dividend stripping) is a tax‑planning manoeuvre where an investor tries to convert taxable dividend income into a lower‑taxed capital gain by selling shares before a dividend and buying them back after. This is described in tax literature as a strategy to extract profits in a more tax‑efficient form by converting dividends into capital gains.
HMRC is fully aware of this behaviour and has anti‑avoidance rules across several manuals (SAIM, CFM, ITA07) to prevent it. Dividends are taxed as Savings and Investment income under UK law.
🏛 Why you cannot do dividend washing with UK Investment Trusts
Investment trusts are tightly regulated vehicles. HMRC requires them to:
Distribute at least 85% of their income each year as dividends.
Not retain more than 15% of income.
Follow strict rules to maintain “investment trust” status.
Because of this structure:
Their dividends are ordinary taxable income to you.
You cannot convert those dividends into capital gains by selling and rebuying around ex‑dividend dates — HMRC treats such transactions as manufactured dividends or repos, which are taxed as income anyway.
In other words: the tax benefit disappears.
📉 Why dividend washing doesn’t produce profit
Even ignoring tax rules, the economics don’t work:
1. Share price drops by the dividend amount
On the ex‑dividend date, the share price falls roughly equal to the dividend. You gain the dividend but lose the same amount in capital value.
2. Bid–ask spreads and trading costs
You pay spreads and fees each time you sell and rebuy — guaranteed negative carry.
3. HMRC reclassifies the transaction
If HMRC sees a sale‑and‑repurchase pattern around dividends, they treat the cash flow as dividend income, not a capital gain. No tax advantage → no profit.
🧭 So what can you do with investment trusts?
While you cannot “wash” dividends, you can use investment trusts for:
Reliable income (many have decades‑long dividend growth records)
These are legitimate, HMRC‑compliant ways to benefit from investment trusts.
⚠️ Important
Dividend washing is considered tax avoidance, and HMRC has explicit rules to counter it. For personalised tax planning, speak to a qualified tax adviser.
So it’s not dividend stripping in the HRMC definition but turning capital into income the opposite, so best in a tax free vehicle and the only chance of producing a profitable outcome is in a rising market as you rely on the price rising before the xd date or and the share price falling less than the amount of the dividend. So only buy an Investment Trust if you are happy to hold for the long term if your strategy unwinds.
The current income figure for 2026 is £13,412.00, note this is not a fcast or a target just one outcome of many.
I have re-plotted the current plan for the SNOWBALL, where if we achieve the figure of £13,412 it will equal the target for 2032 but it’s likely next year’s income fcast will be below £13,412.00.
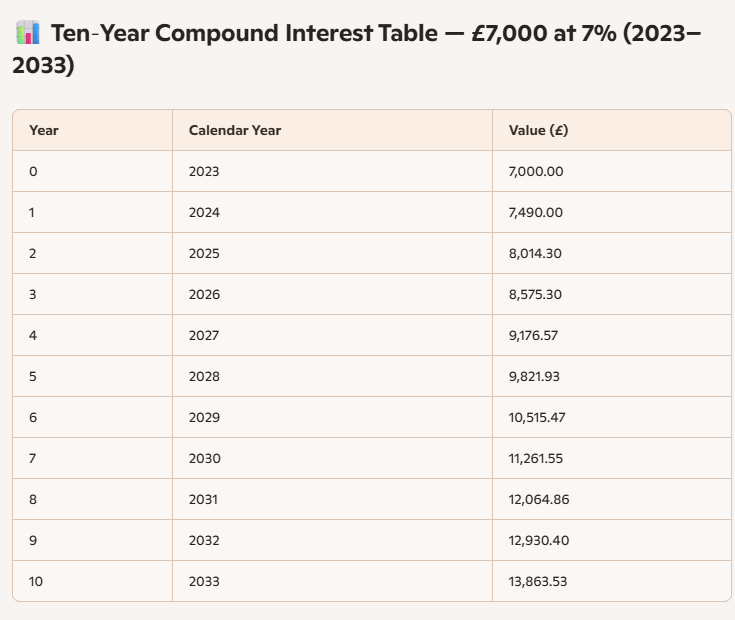
Compound interest/growth takes time to show a noticeable difference to your Snowball but if you continue the timescale, you will see just how much repeatable income you could be earning.
A rough projection if you can compound at 7%, your income doubles every ten years, if you can compound at one or two percent higher the timescale reduces.
The updated income fcast for the SNOWBALL at the half year point is £7,912.00. Although this is well ahead of the current plan do not scale to reach a year end figure as it contains special dividends.
It means the updated year end target should be met.



 Source: CNN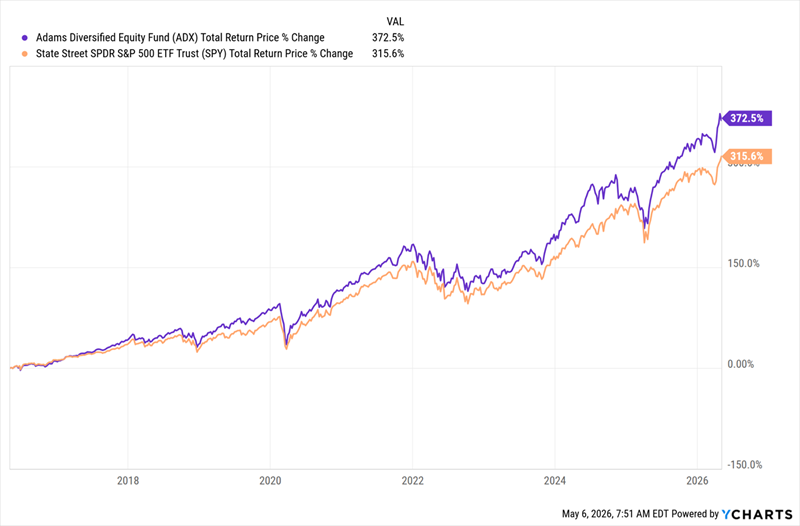
 Source: CEF Insider