Greencoat UK Wind (LSE:UKW) reported a strong first half of 2026, with its portfolio generating 3,003 GWh of electricity, exceeding budget by 4.9%. The higher output helped drive net cash generation of £222 million and produced dividend cover of 1.9 times.
Net asset value at the end of the period stood at £2.9 billion, equivalent to 134.1 pence per share. Despite delivering a total shareholder return of 9.2% during the first half, the company’s shares continued to trade at a significant discount to net asset value.
Debt Refinancing Strengthens Financial Position
The company refinanced £200 million of debt due to mature in 2026, replacing it with new long-term facilities that extend to between 2032 and 2034. Total group debt was also reduced to £2.07 billion, further strengthening the balance sheet.
Greencoat UK Wind said its capital allocation strategy remains focused on increasing inflation-linked shareholder returns while continuing to reduce debt and selectively invest in additional renewable energy assets that can support future cash generation.
Dividend Target Increased
The board reaffirmed its commitment to growing shareholder income by raising its 2026 dividend target to 10.7 pence per share. A second-quarter dividend of 2.68 pence per share has been declared, bringing total dividends relating to the first half of the year to 5.36 pence per share, representing total distributions of £115.7 million.
Management said the current 24.2% discount between the share price and net asset value reflects wider pressures affecting the renewable infrastructure sector, including higher interest rates and policy uncertainty, rather than any deterioration in the company’s underlying business. The board believes improving market conditions and a healthy pipeline of investment opportunities could help unlock long-term shareholder value.
Investment Outlook
Greencoat UK Wind continues to benefit from reliable cash generation, moderate leverage and an attractive dividend yield, making it appealing to income-focused investors. However, recent earnings volatility, weaker profitability and the absence of free cash flow during 2025 have weighed on investor sentiment. Technical indicators also remain subdued, with the shares trading below longer-term moving averages. Even so, the company’s strong operational performance and disciplined capital allocation strategy provide support for its long-term outlook.
About Greencoat UK Wind
Greencoat UK Wind PLC (LSE:UKW) is a listed renewable infrastructure investment company focused on owning and operating UK wind farms. Its objective is to provide investors with sustainable, inflation-linked income through ownership of operational renewable energy assets while supporting the UK’s transition to cleaner electricity generation.
Since its launch, the company has distributed approximately £1.5 billion in dividends and reinvested around £1.1 billion of surplus cash into additional renewable energy projects. Its investment strategy prioritizes growing shareholder distributions, maintaining a strong balance sheet and selectively expanding its portfolio to preserve long-term cash generation and support future returns.
This article was written by the editorial team at InvestorsHub/ADVFN
Primary Health Properties — Strong earnings growth and strategic progress
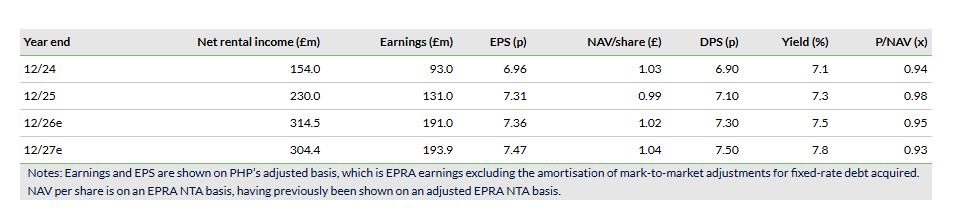
Primary Health Properties (PHP) has reported H126 results showing strong earnings growth, supported by the successful combination with Assura and underlying portfolio progress. Adjusted EPS increased 9% to 3.8p, comfortably covering DPS of 3.65p (+3%). PHP is now well into its 30th consecutive year of DPS growth. 92% of the expected £9m Assura cost synergies have been put in place and plans are well advanced to reduce post-transaction leverage back to within the targeted range. Significantly, PHP has now agreed exclusive terms for the establishment of a 50/50 private hospital joint venture (JV) with a global long-term institutional investor.
Written by Martyn King
Director, Financials. Property and Insurance
While the Assura acquisition is delivering the expected financial and strategic benefits, it is the continuing organic growth of rental income that will sustain long-term performance. Annualised rent roll increased by £3m to £345m during the period, with rent reviews (at an average 3.2% per year) and asset management adding £4m, partly offset by disposals. New asset management and development projects are starting to see rents being rebased upwards, making them economically viable, highlighting the reversionary potential in the portfolio and providing crucial evidence for future rent review settlements.
Tight cost control allows more of this rental growth to drop through to earnings, and while not all the achieved annual cost synergies have yet appeared in the income statement, the EPRA cost ratio has fallen to 8.7%, one of the lowest in the sector.
PHP has clear plans in place to reduce the higher gearing assumed for the Assura acquisition and move the loan-to-value (LTV) ratio of 57% back towards the target range of 40–50%. The agreed further transfer of assets to the existing primary care JV is expected to release £82m of cash. More significantly, it is expected that PHP will seed the proposed new JV with £0.7bn of private hospital assets. PHP is expected to retain a 50% interest in the JV and will earn fees as the asset manager. Due diligence is well advanced and on track for summer completion. In aggregate, we expect the transfer of assets to the JVs to release c £450m of cash and, on a pro-forma basis, PHP expects LTV to fall to c 53%. Meanwhile, PHP’s balance sheet remains robust, with significant liquidity headroom, and the company has been active in the financing market. £1.2bn of new unsecured debt facilities were completed in the period to enhance the group’s capital structure and reduce cost of capital, with credit margins 40bp cheaper than the facilities being replaced.
With portfolio net initial yield broadly stable at 5.4%, rental growth and asset management generated a revaluation surplus and IFRS NAV per share increased 1% to 99p. We will review the financial report in detail but expect no change to our EPS, DPS or EPRA NTA forecasts despite changes to the earnings composition.
Brett Owens, Chief Investment Strategist Updated: July 29, 2026
$500K can be enough money to retire on. Even as early as age 50!
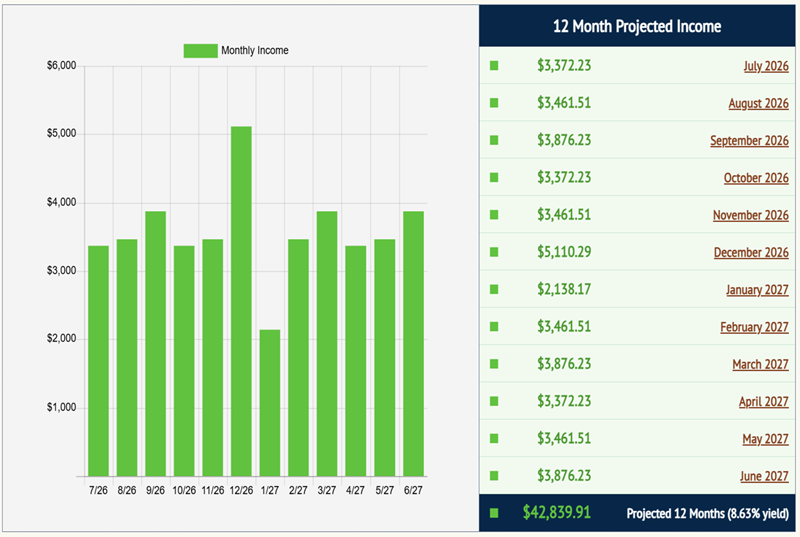
The trick is to convert the pile of cash into cash flow that can pay the bills. I’m talking about $42,839.91 per year in dividend income on that nest egg, thanks to 8%+ average yields.
These are passive payouts that show up every quarter or, in many cases, every month.
Meanwhile, we keep that $500K nest egg intact. Or, better yet, grind that principal higher steadily and safely.
Got more in your retirement account? Cool—more monthly dividend income for you!
We’ll talk specific stocks, funds and yields in a moment. First things first, let’s wipe the false promises of mainstream finance from our minds.
Step 1: Forget “Buy and Hope” Investing
Most half-million-dollar stashes are piled into “America’s ticker” SPY. The SPDR S&P 500 ETF (SPY) is the most popular symbol in the land. For many 401(K)’s, this is the “go to” ticker.
Sad because SPY doesn’t pay. It yields barely 1.1%. That’s $5,500 per year on $500K… poverty level stuff.
When we retire, we need passive income to replace our active paychecks. SPY won’t get it done.
Step 2: Ditch 60/40, Too
The 60/40 portfolio has been exposed as senseless. Retirees were sold a bill of goods when promised that a 60% slice of stocks and 40% of bonds would somehow be a “safe mix” that would not drop together. That can work—but not always, and that “sometimes” can really hurt!
Oops.
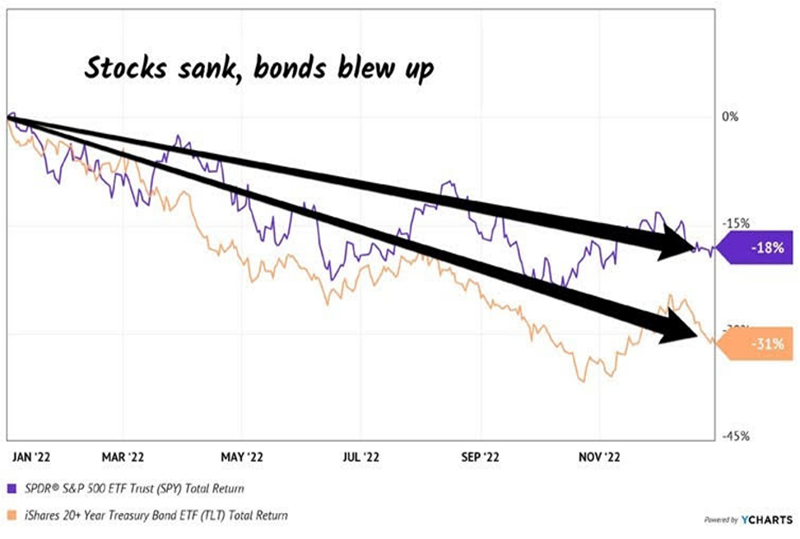
Think back to 2022 when inflation — plus an aggressive Federal Reserve — drop-kicked equities and fixed income before they went on a serious bull run in 2023, 2024 and into 2025 (with a brief interruption for the April “tariff tantrum.”)
It just goes to show that bonds are not the haven guaranteed by the 60/40 high priests. They could easily fall just as hard (or harder) than stocks in the next economic crisis.
In 2022, for example, US Treasuries plunged, which resulted in the iShares 20+ Year Treasury Bond ETF (TLT) getting tagged.
Sure, it still paid its dividend. But even including payouts, the fund was down 31% — worse than the S&P 500. Ouch!
When stocks and bonds are dicey, where do we turn? To a better bet.
A strategy to retire on dividends alone that leaves that beautiful pile of cash untouched.
Enjoy the income while keeping the original principal intact.
To make that $500k last, and our working and saving lives pay off, we really need 8%+ yields. And while we typically don’t see these stocks touted on Bloomberg or CNBC, they are around.
Of course, there are plenty of landmines in the high yield space. Some of these stocks are cheap for a reason. Which is why we need to be contrarian when looking for income.
We must identify why a yield is incorrectly allowed to be so high. (In other words, we need to figure out why the stock is priced so cheaply. Going by the yield alone is like reading only the headlines. We read the whole article—and much, much more!)
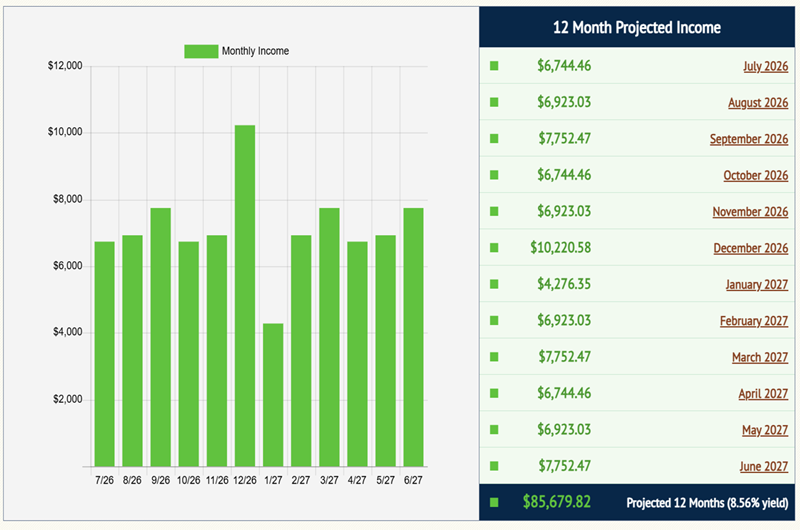
The 22 stocks and funds in my Contrarian Income Report portfolio average a 8.6% payout today. This collection of monster dividends spins off $85,679.82 a year for every million dollars invested!
22 Safe Payers for $85,679.82 in Dividends? Source: Income Calendar
And you don’t have to be a millionaire to take advantage of this strategy. A $500K nest egg will create a still appetizing $42,839.91 in annual income. A delectable dividend meal.
22 Safe Payers for $42,839.91 in Dividends ?Source: Income Calendar
The important thing is that these yields are safe, which creates stability for the stock (and fund) prices attached to them. We want our income, with our principal intact. It’s really the only way to retire comfortably, without having to stare at stock tickers all day, every day.
Now, many blue-chip yields are safe, but small. They just need to hit the gym and bulk up a bit. Here’s how we take perfectly good yet modest dividends and make them into braggarts.
Step 4: Supersize Those Yields
Mastercard (MA) is a near-perfect dividend stock. Its payout is always climbing, nearly doubling over the last five years. (MA shareholders, you can thank every business that accepts Mastercard for your “pennies on every dollar” rake.)
Tap, tap, tap. Remember cash? Me neither. Another 2020 casualty, with Mastercard making a few dimes or dollars on every plastic transaction.
The cashless tsunami has been in motion for years, but international growth prospects remain huge! Just a few years ago, 80%+ of transactions in Spain, Italy and even tech-savvy Japan were in cash. We expect more dividend hikes as global cash morphs to plastic and Mastercard benefits.
The only chink in MA’s armor? Everyone knows it is a dynamic dividend stock. Investors keep bidding it higher, knowing that the next dividend raise is just around the corner. That’s why it only yields 0.6% and rarely more.
So, the compounding of those hikes makes MA a great stock for our kids and grandkids. You and I, however, don’t have the time to wait for 0.6% to grow. And $3,000 on our $500K nest egg simply won’t get it done—to say the least!
Let’s instead consider top-notch closed-end fund (CEF) Gabelli Dividend & Income Trust (GDV), managed by legendary value investor Mario Gabelli. Mastercard is Gabelli’s largest holding. But we income investors would prefer GDV because it boasts a nifty 6.1% dividend, paid monthly.
Not only that, but thanks to its obscurity, we have an opportunity to buy Mario’s portfolio for just 89 cents on the dollar. Yup, GDV trades at an 11% discount to its net asset value, or NAV. It’s a great way to boost MA’s payout and snag a discount, too.
Where does this discount come from?
CEFs have fixed pools of shares, so emotion can (and does) drive their prices below their NAVs, or “fair” values (the value of their holdings minus any debt). That’s when we contrarians step in to buy underrated CEFs at generous discounts. We never “pay full price!”
GDV holds other blue-chip dividend payers alongside MA, such as Microsoft (MSFT) and JPMorgan (JPM). These stocks have soared over the past year, but with GDV, we have an opportunity to purchase them at an 11% discount.
These high-quality stocks wouldn’t normally qualify for our “retire on $500K” portfolio because everyone in the world knows they are nice long-term investments. Even though these companies consistently raise their dividends, investor demand for the stocks keeps their prices high and current yields low. They never meet our current yield requirement.
GDV does. Its monthly dividend adds up to a 6.1% annual yield.
But Brett, 6.1% ain’t 8%. Good point, so let me give you one more idea. Eaton Vance Tax-Managed Global Diversified Equity (EXG) is another CEF with a similar blue-chip dividend portfolio. But EXG generates even more income than GDV by selling covered calls on the shares it owns. More cash flow means a bigger dividend—and EXG pays a solid 8.1%!
So, do we buy and hold EXG and GDV forever, collecting their monthly dividends merrily along the way? Not quite.
In bull markets, these funds are great. But in bear markets, they’ll chew you up.
Step 5: Protect That Principal!
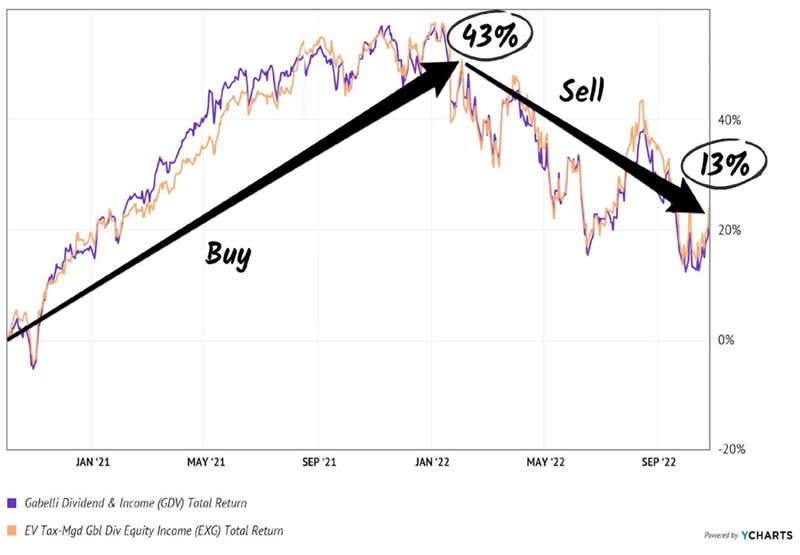
My CIR readers will fondly recall the 15 months we held GDV and EXG, collecting monthly dividends plus price gains that added up to 43% total returns.
What was happening in that time period? The Federal Reserve printed money like crazy. Yes, it did stoke inflation, but we enjoyed a more-than-offsetting boost in asset prices.
Starting in 2022, we had the opposite situation. The stock market was topping, and we didn’t want to fight the Fed. We sold high and avoided losses on the other side:
EXG and GDV: Dropped 13% After We Cashed In
For whatever reason, “market timing” is a taboo phrase among long-term investors. That’s a shame because it is quite important. By aligning our dividends with the market backdrop, we can protect our principal from bear markets like we saw back in 2022.
Step 6: Start Here to Retire on $500K
“Tried and true” money advice—like the 60/40 portfolio and the 4% withdrawal rule—have been properly exposed as broken. Good riddance!
Half year results to 30 June 2026, Net Asset Value and Dividend Announcement
Greencoat UK Wind PLC today announces the half year results for the period to 30 June 2026.
Greencoat UK Wind PLC is the leading listed renewable infrastructure fund, invested in UK wind farms. The Company was designed for investors, from first principles, to be simple, transparent and low risk. Its aim is to provide investors with an annual dividend that increases in line with CPI inflation while preserving its long term value by reinvesting surplus cash flow. The Company has to date paid £1.5 billion in dividends to its shareholders and generated a further £1.1 billion of excess free cash to invest in new assets.
The Company enables investors to own a direct stake in UK wind farms, so increasing the resources and capital dedicated to the deployment of renewable energy capacity needed to meet forecast growth in UK electricity demand.
Performance
· The Group’s investments generated 3,003GWh of renewable electricity (HY 2025: 2,567 GWh), 4.9 per cent above budget
· Strong net cash generation (Group and wind farm SPVs) of £222 million (HY 2025: £163 million), benefitting from strong generation and realised power prices
· Half year dividend cover was 1.9x (HY 2025: 1.4x)
· Full year net cash generation on course to be towards the top end of £350 – 410 million 2026 guidance
Net Asset Value and Debt
· The Company announces that its unaudited Net Asset Value as at 30 June 2026 is £2,895 million (134.1 pence per share). The Company’s June 2026 Factsheet is available on the Company’s website, www.greencoat-ukwind.com.
· Aggregate Group Debt was £2,070 million, representing a reduction of £56 million across the period.
· The Company has refinanced its £200 million 2026 debt maturities with new long-dated facilities, expiring between 2032 and 2034, provided by its existing lending group.
Capital Allocation
· The Company has announced its 2026 dividend target of 10.7 pence per share, the thirteenth consecutive inflation linked increase, has declared total dividends of 5.36 pence per share with respect to the period and paid a dividend of 2.59 pence per share with respect to Q4 2025 in the period.
· The Company continues to evaluate a range of investment opportunities, with a focus on selective transactions that enhance risk adjusted portfolio returns.
Commenting on today’s results, Lucinda Riches, Chairman of Greencoat UK Wind, said:
“The first half of 2026 has seen strong operational and financial performance. Generation was ahead of budget, net cash generation was robust and dividend cover was 1.9x. The Company also continued to strengthen its balance sheet through debt repayment and the successful refinancing of its 2026 debt maturities. The Board remains focused on maintaining a disciplined approach to capital allocation while continuing to assess investment opportunities to support long-term shareholder value.”
Dividend Announcement
The Company also announces a quarterly dividend of 2.68 pence per share in respect of the period from 1 April 2026 to 30 June 2026.
2 “Lonely and Uncomfortable” Dividends up to 12.3% We Love (One More Than the Other)
Brett Owens, Chief Investment Strategist Updated: July 28, 2026
When the world is burning—as it feels like it is now—it pays to remember the words of Howard Marks, the smartest money manager most people have never heard of.
The essence of Marks’s approach is contrarian thinking. In Chapter 11 of his excellent book, The Most Important Thing: Uncommon Sense for the Thoughtful Investor, he writes:
The ultimately most profitable investment actions are by definition contrarian: You’re buying when everyone else is selling (and the price is thus low), or you’re selling when everyone else is buying (and the price is high).
But he admits this isn’t easy: “These actions are lonely and uncomfortable.”
Lonely? Uncomfortable? That’s exactly how corporate-bond buyers feel these days!
We’re not just tipping our hats to these brave “loners.” We’re joining them with two “tossed-in-the-bin” bond closed-end funds (CEFs) paying up to 12.3%!
Rates Up, Bonds Down—But Something’s Got to Give
If you’ve been investing for income for a while, you likely know the golden rule of Bondland: When rates rise, bond prices fall (and vice versa). It’s simple—too simple, in fact! And it’s precisely why bonds are on the outs now.
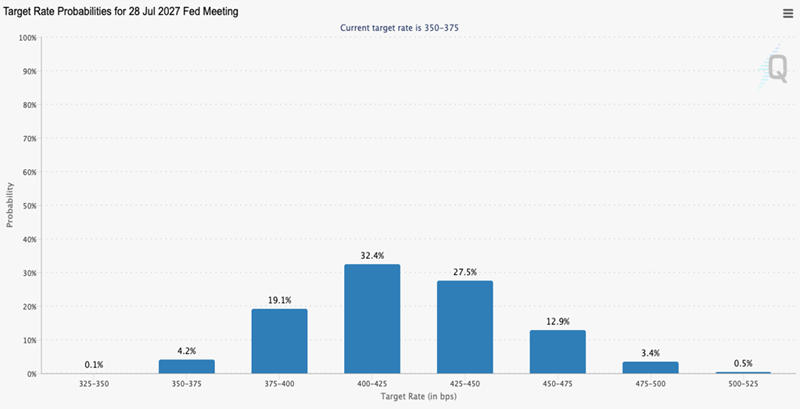
The Iran conflict is flaring. Oil (the engine of inflation) is spiking. And even Fed chair Kevin Warsh—appointed, remember, to cut rates—can’t seem to hold back the tide. Futures markets tell the tale: A year from now, they see two Fed rate hikes in the bag—and potentially more.
Source: cmegroup.com
I know. This does not sound like the best bond-buying setup. But here’s the thing: Everybody knows it. The mainstream crowd—folks Marks calls “first-level investors” because they buy and sell on headlines—has already sold.
That’s fine for us “second-level” thinkers who dig deeper: It means the bad news is priced in. It also means it won’t take much for these funds’ discounts to reverse course and shrink.
The bottom line? Now is the time to buy.
To see what I’m getting at, consider the discount on the PIMCO Corporate & Income Opportunity Fund (PTY), one of the biggest corporate-bond CEFs.
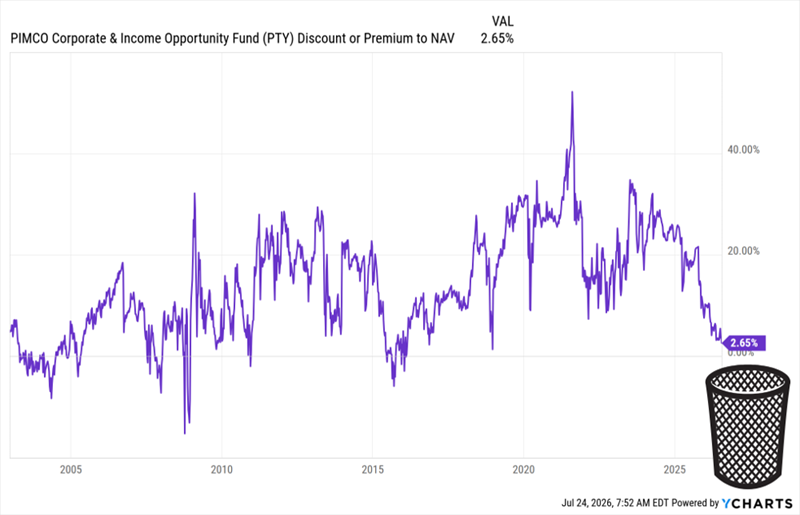
As I write, PTY trades at a 2.7% premium to net asset value (NAV). That doesn’t sound cheap, but thinking any premium means a fund is pricey is another first-level blunder. With PIMCO funds, premiums—particularly big ones—are normal because of the company’s cachet in the CEF space.
Over the last five years, PTY has traded at a 20% (!) premium, on average. Take a look at this chart, showing its path to the bottom of the bargain bin:
PTY Is Cheaper Than It’s Been in 11 Years
This is a chart of PTY’s premium since its launch in 2002. As you can see, it’s cheaper than it’s been since 2015—and far cheaper than it was in 2022, when rates soared on the heels of an inflation rate that streaked to 9%!
Even the most extreme forecasts don’t put us near that today. And PTY’s overdone premium-drop, despite that fact, is the first reason why the fund looks attractive now.
Then there’s the dividend. As I write this, PTY pays 11.9 cents per share, per month, for a hefty 12.3% yield.
Other than a slight adjustment, from 13 cents to 11.9 during the pandemic, that payout held steady, with the odd special dividend (the spikes and dips in the chart below), too:
PTY generates that income by handing its managers a wide mandate to scour the credit markets. The result is a portfolio that’s 59% US-based and mostly in high-yield bonds (29% of assets), non-US developed markets (16%) and emerging markets (17%).
The team at the top has also focused on bonds with a leverage-adjusted duration of 4.2 years. That’s a good place to be—long enough to rise significantly as rates fall, but not so long as to hurt substantially if rates surprisingly head higher than expected.
As I just hinted at, the fund does juice its returns by borrowing against roughly 29% of its assets. That’s modest and, again, will provide a tailwind as rates fall and PTY’s borrowing costs decline.
And yes, I do still see lower rates in the longer run. Let’s talk about that more before we move on to another corporate-bond CEF we like even more than PTY.
On the Interest-Rate Front, AI Beats Iran
When it comes to rates (or anything in investing), things rarely go in a straight line.
Despite the recent escalation in Iran, this conflict will eventually draw to a close. None of the participants in the conflict can afford any other outcome. Then there’s Warsh, who, as I mentioned earlier, Trump has charged with cutting rates. You can bet that as soon as the data allows him to justify such a move, he’ll push for it.
Third (and more important) is AI, which provides a sweeping level of automation to white-collar work that is highly deflationary.
In the 1990s, the Internet acted as a similar “deflator” on prices. The move from snail mail to email and from fax machines to web browsers made businesses wildly more efficient, which kept a lid on consumer prices—and a floor under bond prices. They rallied throughout the decade.
If rate cuts happen sooner, great. The discount on a buy made today will snap shut, giving us price gains on top of our double-digit bond-fund payouts. If it takes longer, fine. We’ll collect our divvies in peace (since these funds are already cheap).
Which brings me to another bond CEF I see as a savvy “second-level” buy today.
The “Bond God’s” 10.1% Payout
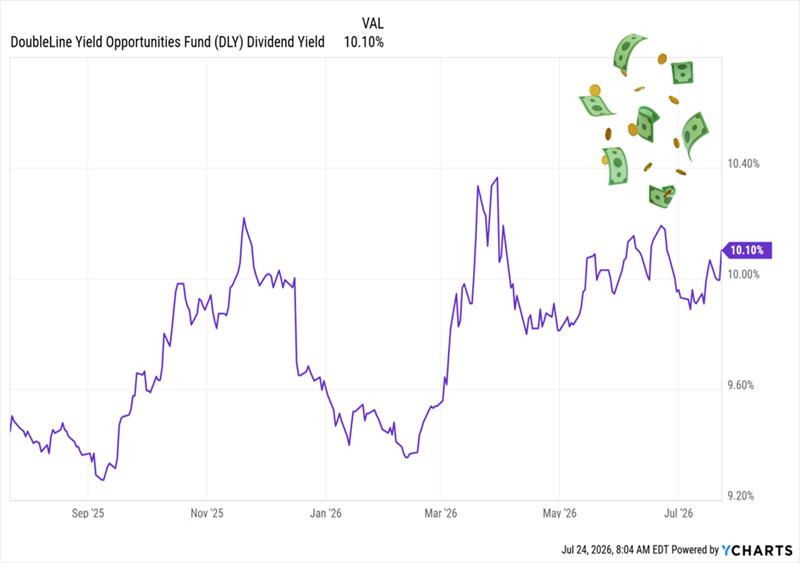
The 10.1%-paying DoubleLine Yield Opportunities Fund (DLY) is a holding of my Contrarian Income Report service that’s done exactly what we’ve wanted it to since we bought it in October 2021: deliver steady income.
The fund rolled down the skids at what would seem to be an inopportune time: February 2020, on the eve of the societal dumpster fire that was soon to ensue. But DLY’s manager, Jeffrey Gundlach (a.k.a. the “Bond God”) was the right manager for the time: He used the opportunity to snap up high-yielding bonds at discounts.
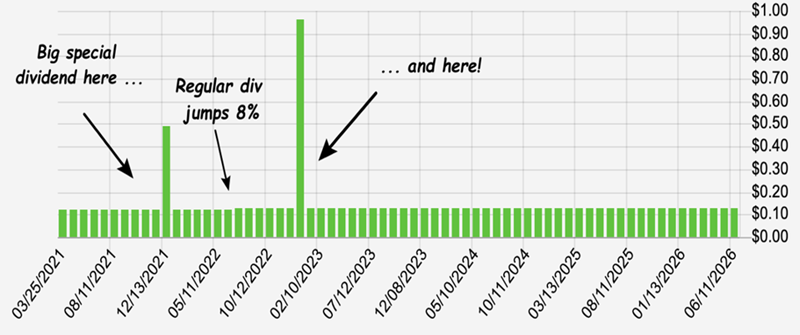
Since then, the fund’s dividend has been the picture of predictability, paying out steadily (and monthly) since launch, with two special dividends, to boot:
Then there’s the discount, which has also gotten cheaper over the last 16 months, dropping from a slight premium to a 7.7% markdown.
That’s way too cheap for a fund run by Gundlach, who’s got a wide mandate to scour the credit markets. The discount’s widening has also raised the yield to that sweet 10.1%.
DLY’s Discount Sends Its Dividend Higher
DLY, like PTY, is a textbook “Marks-style” contrarian play on today’s rate worries. We’re happy to grab this stout fund at a discount, and a historically high 10.1% payout, too.
This Ridiculously Cheap 12% Payer Is the “Perfect Pairing” for DLY
Let’s keep the payout party rolling by adding another fund that perfectly complements DLY. This one pays 12%, hands us payouts monthly and is also cheap, thanks to the investor temper tantrum over rates.
And take a look at this steady divvie:
Heck, it’s not just steady—it’s growing. So we’re left with a 12% payout that comes our way monthly, has grown, and regularly sends special payouts our way!
Many investors will tell you that such a thing simply can’t exist. Well, here’s the proof that they’re wrong. And with the world-class management team running this fund, we’ve got reassurance that they know how to weather any rate storm.
Since this one pays monthly, getting in now means our next payment is only a few short weeks (not months!) away.
Investment trusts can help generate income, deliver strong dividends, as well as give you exposure to private companies.
According to the Association of Investment Companies (AIC), an industry body that represents investment trusts, retail investors now own 26% of investment company shares, compared to 25% two years ago.
“Investment trusts are built for the long haul,” said Nadir Mirza of Tyndall Investment Management. “Pension capital demands patience, governance, and discipline – three qualities that sit at the core of well-run investment trusts.”
Investment trusts that focus on dividend-paying companies have always been a popular pick – and not just among income investors wanting a regular stream of income.
That income reinvested can be a significant boost for growth too. For example, in the UK reinvested dividends have made up around 67% of total returns over 20 years.
So when it comes to your self-invested personal pension (Sipp), which investment trusts should you add? Here’s what the experts say.
If you are still building your pension – known as the accumulation stage – a global equity trust makes the most sense, says Emma Wall, chief investment strategist at Hargreaves Lansdown.
“The JPMorgan Global Growth and Income trust is a good option, managed by Helge Skibeli who has more than 30 years’ experience, supported by two other managers in London and New York supported by analysts across various continents to help spot the best opportunities across the globe.”
The team looks for companies with attractive valuations, that offer significant potential for growth and are unlikely to suffer big share price volatility. The top 10 holdings will be familiar to investors. Microsoft, Amazon, Nvidia, The Walt Disney Co and Johnson & Johnson are among the largest positions.
Wall adds: “We like it because it has a core approach – neither growth or value biased – and a robust dividend policy paying out quarterly, which can be reinvested for accumulation or take an income for those already in retirement.
Pete Walls of Unicorn Asset Management favours trusts with greater geographical diversification and “a bit less of the Magnificent 7.”
“In the prevailing, highly concentrated, world market, I have reservations about the fact that many of the global trusts have such a large exposure to the USA,” he said.
“The Brunner Investment Trust styles itself as an ‘all weather’ global equity portfolio. It’s been around for almost 100 years so there’s a good chance it will continue to prosper for long-term pension investors.”
Some of the trust’s top 10 holdings include Microsoft, payments giant Visa, energy stock Totalenergies, chip-maker Taiwan Semiconductor Manufacturing and hotel group InterContinental Hotels.
“Despite having a lower weighting to the rampant US market than some of its peers, portfolio performance has been good,” added Walls.
While the dividend yield is a modest 1.7% it’s dividend has increased year on year for the last 53 years. The trust has returned 73% over five years.
Investors who believe in a prosperous future for the UK might consider The Law Debenture Corporation, a trust suggested by Walls and Mirza.
The trust balances income stability with long-term growth potential, with around 83% in UK stocks.
Mirza said: “For a pension investor, it’s a compelling combination: dependable income, valuation discipline and genuine flexibility, underpinned by a structure designed to compound quietly over time.”
Its top 10 holdings include banking stocks HSBC and Barclays, car manufacturer Rolls Royce and mining firm Rio Tinto.
It has returned an impressive 100% over five years.
Walls added: “It’s been listed on the London Stock Exchange for more than 135 years, so once again it’s likely to be around for some time to come.”
This trust targets Japanese small and mid-cap companies trading below intrinsic value.
“The Nippon Active Value fund is a timely expression of Japan’s long-overdue revival,” said Mirza. “After years of corporate inertia, Japan is finally embracing reform – balance sheets are leaner, governance is improving, and management teams are starting to prioritise shareholder returns. The fund’s activist approach fits this environment perfectly.”
Mirza added: “This hands-on strategy has delivered strong NAV growth in a market that remains deeply under-owned by global investors. For pension investors, this is the kind of exposure that adds genuine diversification and long-term alpha potential – an active, conviction-led play on one of the few major markets still trading at a structural discount to its own potential.”
Top 10 holdings include medical supplies firm Hogy Medical, media company Fuji Media Holdings and environment product manufacturer Ebara Jitsugyo.
Should you wish to invest in a specific theme, you could plump for one such as Augmentum Fintech, suggests Dan Boardman-Weston, chief executive of BRI Wealth Management.
“This is a trust that may be suitable for those with a high appetite for risk and a long-term time horizon. It focuses on potential high-growth private companies in the fintech space.”
Augmentum has benefited from being a former shareholder in Interactive Investor. Its top 10 holdings include Tide, which operates banking services for small businesses and online challenger bank Zopa.
Augmentum trades at nearly a 50% discount to the value of its assets. The fund has lost 34% over five years.
“Those with a good appetite for risk and appropriate time horizon should consider a small position as part of a diversified portfolio,” Boardman-Weston added.
How to choose an investment trust for your pension
If you’re considering an investment trust for your pension then there are several things to help with your decision on whether to invest.
“First decide how much risk you want to take, and where in the world you want to invest,” said Laith Khalaf, head of investment analysis at AJ Bell. “Then it’s a question of comparing investment strategies and manager track records, as well as considering costs.”
What a trust invests in is crucial. The top 10 holdings and percentage of the trust’s value held in each company is typically easy to find on a factsheet, which is a document provided by the investment company and refreshed regularly.
You can view them online directly from the fund management company or on an investment platform such as AJ Bell or Hargreaves Lansdown.
Understanding a trust’s strategy is important. “You’ll want to understand how the fund manager aims to deliver a strong return over time without taking too much risk in any one area,” said Nick Britton, research director of the AIC.
“It can be useful to look at the trust’s record – though it does not guarantee future returns – and how it has performed in various market conditions. Investment trusts can borrow to invest, which can boost long-term growth but also adds risk, so check the trust’s current level of borrowing – known as gearing – and borrowing policies so you know how much extra market exposure you may be taking on.”
“As you get closer to retirement, capital preservation may become more important to you. At this time, many people think about reducing their weighting to equities, and there are some trusts that aim to preserve wealth by spreading your investment over assets like equities, bonds, alternatives and cash.”
Since investment trusts typically trade at either a premium or discount to their net asset value (NAV), based on the balance of supply and demand, you should take a look at the discount or premium on the trust.
Khalaf added: “This shouldn’t be a major decision driver for long term investors, unless it’s deviated substantially from the norm.”
Technology, and its ever-present subsector artificial intelligence (AI), are perhaps the hottest topics in investment – and have been for several years.
Information technology officially accounts for 32% of the MSCI ACWI Index. Yet in reality, what we’d all intuitively think of as ‘tech’ companies account for a greater proportion of this, since MSCI officially designates companies like Alphabet, Amazon, Meta and Tesla into industry sectors other than information technology.
This concentration brings risks with it. Passive tracker funds act to condense stock markets into the biggest names, and investors therefore run the risk of being over-exposed to the sector – which can exhibit volatility when times get tough.
Get 6 free issues + a free water bottle
Stay ahead of the curve with MoneyWeek magazine and enjoy the latest financial news and expert analysis.
There is also the intensely competitive nature of tech growth to contend with. Nascent, disruptive technologies like AI can create as many losers as winners, if not more. Knowing which stocks to invest in can be difficult, even for the professionals.
An investment trust – which is by definition actively managed – has the potential to mitigate some of these risks, and the vehicles offer some structural advantages too.
“The closed-ended nature of investment trusts makes them well-suited to technology investing,” said Alex Trett, investment trust research analyst at Winterflood Securities.
“The permanent capital allows managers to take a genuinely long-term approach, supporting investments in private companies and giving them the patience to see investment theses play out over time.
“The structure can also facilitate exposure to smaller-cap technology businesses, where liquidity can be a constraint for other investment vehicles. In addition, it enables managers to build concentrated, high-conviction portfolios, allowing them to express their strongest investment ideas.
Here’s six of the best-known investment trusts that can offer you exposure to some of the world’s most innovative technology companies.
Scottish Mortgage
Just as many ‘big tech’ companies aren’t designated tech, one of the biggest investment trusts that many people think of as ‘tech-focused’ isn’t actually a technology trust.
Scottish Mortgage (LON:SMT) aims to own “the world’s most exceptional public and private growth companies”. As it happens, a lot of these are tech companies, but the trust emphasises that its focus is on long-term growth potential, whatever sector that may be in.
Still, buy Scottish Mortgage now and you’ll get a lot of tech. As of 30 June, SpaceX accounted for over 25% of the portfolio, followed by Taiwan Semiconductor (6.4%), Nvidia (5.0%) and TikTok’s owner Bytedance (4.2%).
ByteDance and, until recently, SpaceX have exemplified part of the appeal of SMT: its ability to hold private companies alongside publicly listed ones, tapping into the future growth potential they offer. The heavy weighting towards SpaceX is largely a consequence of this and its recent initial public offering (IPO); Trett expects the position to be trimmed once lock-up periods permit.
Symbol
Market cap (£ million)
Discount / premium (%)
1yr share price return (%)
10 yr share price return (%)
Dividend yield (%)
SMT
17,009
-8.5
27.8
403.0
0.34
Source: Association of Investment Companies, as of 21/07/26.
Polar Capital Technology
Polar Capital (LON:PCT) has focused its approach on the hardware and infrastructure underpinning the buildout of artificial intelligence (AI).
“The managers believe these areas offer greater earnings visibility and forecastability, with semiconductors representing the largest exposure at 44% of the portfolio, followed by equipment, components and storage including Advanced Micro Devices and LAM Research,” said Trett.
Symbol
Market cap (£ million)
Discount / premium (%)
1yr share price return (%)
10 yr share price return (%)
Dividend yield (%)
PCT
7,233
-9.2
62.6
847.2
0.0
Source: Association of Investment Companies, as of 21/07/26.
Allianz Technology Trust
All of these trusts are listed in the UK, but Allianz Technology (LON:ATT) is distinctive in having its management team based in San Francisco, giving it close access to many of the companies in its portfolio – approximately 90% of which is allocated to North America, as of 30 June.
“The portfolio provides broad exposure across the technology and AI ecosystem,” said Trett.
“The managers have highlighted the role of technology in creating differentiation across a wide range of industries [and] believe the AI opportunity is continuing to broaden beyond the initial infrastructure buildout, supporting a more diversified and durable phase of growth across the technology sector”.
Symbol
Market cap (£ million)
Discount / premium (%)
1yr share price return (%)
10 yr share price return (%)
Dividend yield (%)
ATT
2,582
-8.8
49.6
875.1
0.0
Source: Association of Investment Companies, as of 21/07/26.
Schiehallion
Like Scottish Mortgage, Schiehallion (LON:MNTN) is managed by Baillie Gifford and, depending on how pedantic you’re feeling, isn’t technically a technology investment trust.
But it has an interesting focus on early-stage companies – even more so than SMT, given that it invests in later-stage private companies.
“While not a dedicated technology fund, technology represents around 47% of the portfolio, with holdings including Anthropic, Bending Spoons, SpaceX, ByteDance and Databricks,” said Trett.
Symbol
Market cap (£ million)
Discount / premium (%)
1yr share price return (%)
10 yr share price return (%)
Dividend yield (%)
MNTN
2,031.67
-15.37
69.0
N/A
0.0
Source: Association of Investment Companies, as of 21/07/26.
Herald Investment Trust
Again, Herald Investment Trust (LON:HRI) technically belongs in the Global Smaller Companies category, but it has a strong focus on technology and communications companies.
It was the subject of a bid from Saba Capital Management to displace its board, which led to a tender offer and for the trust to become part of Aberdeen.
Trett picks out Super Micro Computer, BE Semiconductor Industries, Celestica and Fabrinet as among its key holdings.
Symbol
Market cap (£ million)
Discount / premium (%)
1yr share price return (%)
10 yr share price return (%)
Dividend yield (%)
HRI
565.46
-11.3
21.7
305.1
0.0
Source: Association of Investment Companies, as of 21/07/26.
Manchester and London
Some people use investment trusts to diversify away from big tech concentration. Manchester & London (LON:MNL) is an investment trust for people that want to lean into it.
The fund takes a concentrated approach to investing and predominantly holds large-cap stocks, with AI a high-conviction play for the managers.
“The fund’s concentrated portfolio allows it to hold significant positions in its preferred ideas; Nvidia represented 43.6% of net assets in January before being subsequently reduced to 9.0% as at 30 June,” said Trett.
Symbol
Market cap (£ million)
Discount / premium (%)
1yr share price return (%)
10 yr share price return (%)
Dividend yield (%)
MNL
498.75
-25.29
19.0
429.4
2.9
Source: Association of Investment Companies, as of 21/07/26.
Our asset allocation panel share their views on the areas where they are bullish and bearish.
22nd July 2026
by Jim Levi from interactive investor
Artificial intelligence (AI) is the fastest-adopted technology in history. Worth a mere $95 billion (£70 billion) just five years ago, it is projected to be worth $1800 billion by the end of the decade and perhaps $4800 billion by 2033. No wonder then that AI – and the investment opportunities and pitfalls it may create – is much on the minds of our panel of four fund managers.
But the impact of AI is global and in relative terms it is making an even bigger impact on equities in emerging markets – particularly Taiwan and South Korea. This has led to the creation of a new list of seven leading stocks called the Semiconductor Seven – all of them quoted in Far East markets – and led by Taiwan Semiconductor Manufacturing Co Ltd ADR TSM
These companies whose customers include the Magnificent Seven in the US are already making large profits out of supplying chips for AI.
Has Big Tech overspent on AI?
But there are question marks over the huge costs of building the data centres for AI and how profitable the business might be for the likes of Apple, Alphabet and Microsoft.
According to Rob Burdett at Nedgroup Investments, AI “has created a huge cloud of uncertainty and the market is reacting accordingly”. The stock market ratings for the likes of Amazon, Microsoft and Nvidia are now cheaper than those of low tech stocks such as Coca-Cola HBC AG CCH and McDonald’s Corp MCD
He points out that the cash flows of the Magnificent Seven at the end of last year was $300 billion and is now nearer $50 billion because of the heavy investment in data centres.
“The amount of money being spent on data centres for AI has overtaken all the money being spent on commercial property in the US,” Burdett claims.
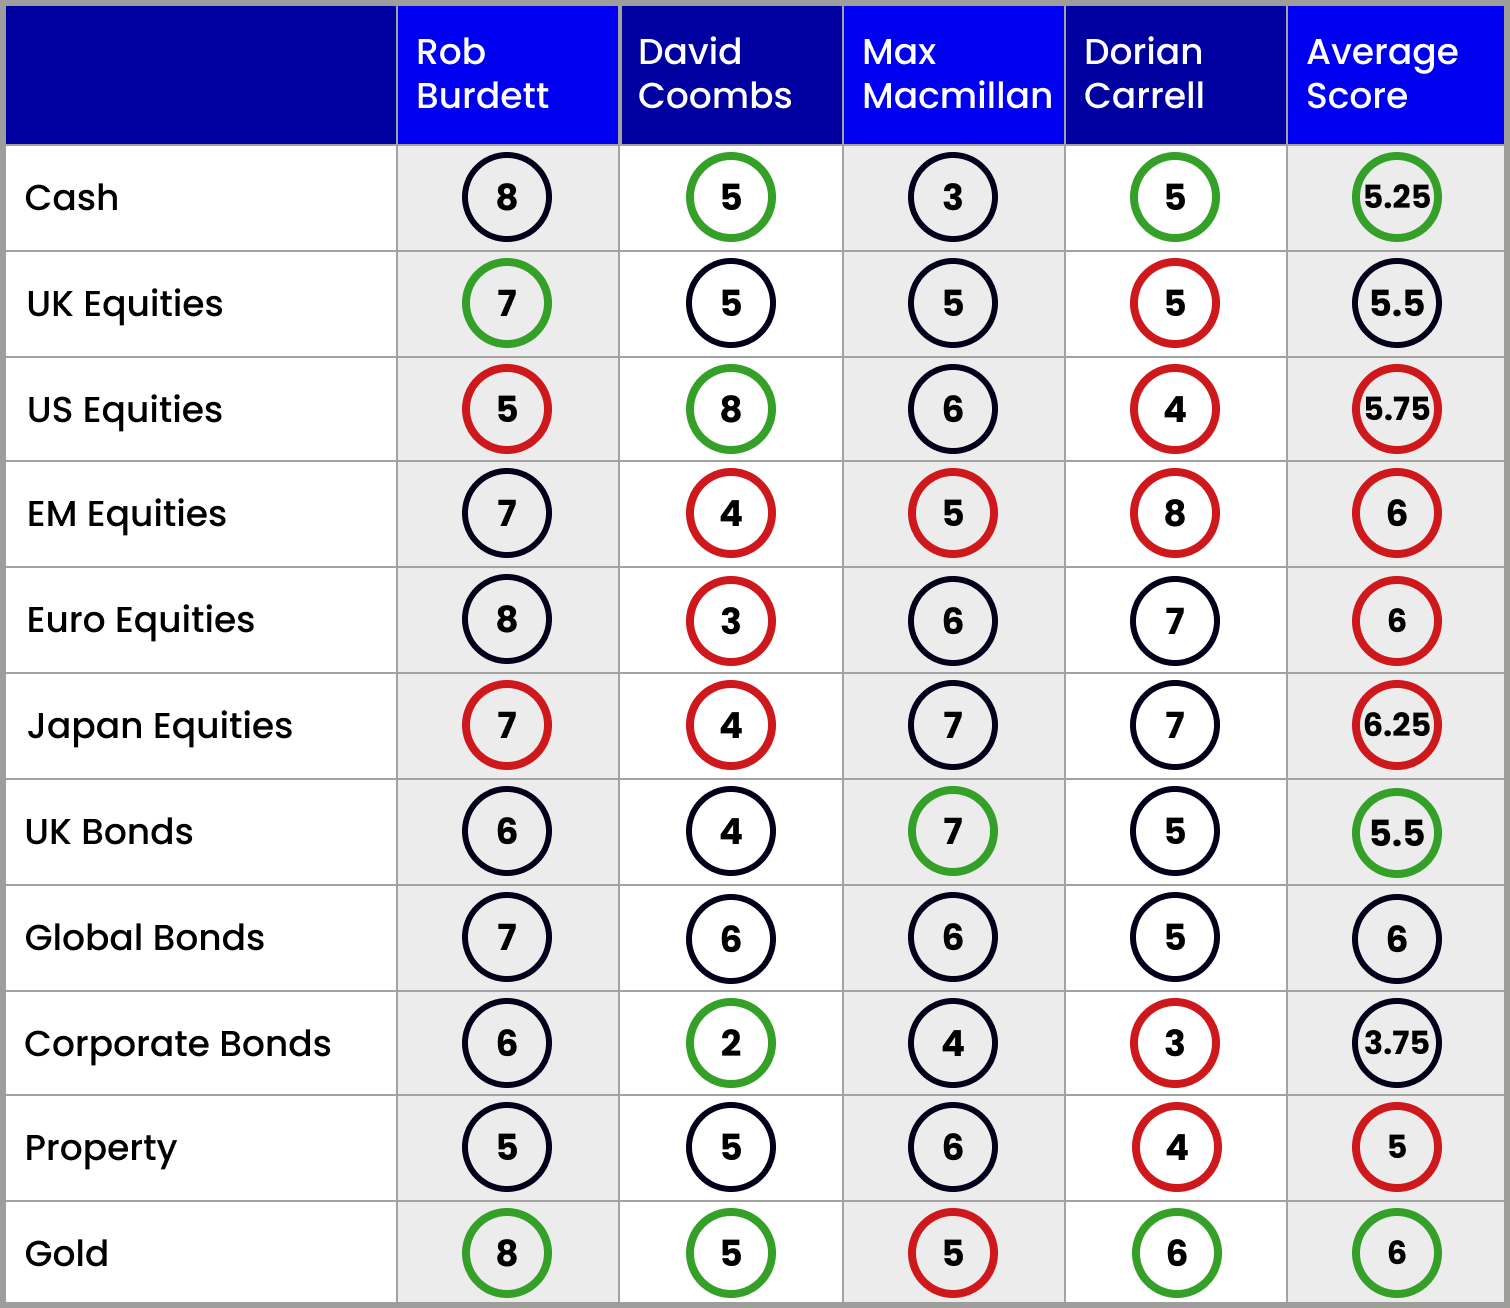
Where does that leave the stance of our panel of four fund managers on Wall Street? As usual, our scorecard shows a mixed reaction. Burdett himself has lowered his score for US equities from seven to five. “Back in April I raised my US equities score from four to seven and that worked well,” he says. “But at this point I don’t want to be overweight Wall Street.”
At Schroders Dorian Carrell supports Burdett’s caution taking his score down from six to four. “We think there is better value elsewhere,” he says.
David Coombs at Rathbones takes the opposite route in raising his score for US equities from six to eight. “I think we will start to see the market begin to anticipate a cut in American interest rates early next year,” he says. “Meanwhile, there is a widening of interest in smaller US companies and in stocks outside the Magnificent Seven.”
But even he admits he cannot dodge the central question: “Is AI going to make money for those leading companies or is it going to prove too costly?”
Emerging market enthusiasm wanes
The overall mood of caution among the panel members is reflected in rising cash scores. Burdett was already scoring eight but both Coombs and Carrell have boosted their cash score to five. “We all remember that the autumn is a favourite time for big stock market corrections,” Burdett warns.
Craig Hoyda, investment director at Aberdeen standing in again for Max Macmillan, makes only one change in his equities scores by going from an overweight seven to a neutral five on emerging markets. “We have seen incredible volatility in Asian markets – particularly Taiwan and South Korea, which now dominate the emerging markets space,” he says.
“This volatility and concentration on just a few dominant AI-related stocks makes us cautious.”
Coombs is even more cautious, lowering his emerging markets score from seven to four and even Carrell who scored a nine for the sector back in April has edged his score slightly lower to eight. Overall, the average score for emerging market equities is down from 7.5 to 6. Carrell himself is suggesting a recovering Chinese economy may take up some of the running in the sector in the coming weeks. “Overall, we think emerging markets will continue to do well,” he says.
Views on UK, Europe and Japan
There is a two-way pull going on in UK equities. On the one hand, there is a steady stream of foreign bids for leading UK companies –
easyJet EZJ and a big chunk of ITV ITV among them – which indicate that in the eyes of overseas investors at least our domestic equity market looks cheap.
On the other hand is the reality of a sluggish economy and continued uncertainty about the plans of the new Andy Burnham government. Three of the four panel members score a neutral five. Carrell says: “The noises we have heard so far from the Burnham camp do not indicate plans that are constructed for long-term growth. And that is what the country needs.”
Only Coombs is underweight in European equities – lowering his score from four to three with his concerns that Chinese competition is damaging German car manufacturing, but Burdett keeps his score at eight. “Our positive view is about the revival of the German economy through extra defence spending and European equities are certainly not expensive compared with US shares,” he says.
Again Coombs is the odd man out in Japanese shares leaving his score an underweight four. Burdett, a long-term bull of Japan lowers his score from eight to seven, while both Aberdeen’s Hoyda and Carrell at Schroders keep their scores at seven. The one blot on the Japanese equities landscape is the continued weakness of the yen against the dollar. “Our score would be higher if the Bank of Japan took some action and the weakness of the currency ended,” says Carrell.
Hoyda makes an intriguing prediction that UK interest rates will be reduced by the end of the year and in anticipation he has raised his UK bonds score from five to seven. Other panel members are less confident that inflation will be more under control by then but there are no other changes in scores for either UK or global government bonds.
However, Hoyda has some indirect support for his belief that lower inflation and lower interest rates may soon be on the way from Burdett, who tops up his score for gold to eight. “Central banks are still buying gold and lower interest rates would be good news for the yellow metal,” he says.
Corporate bonds remain the lowest-scoring sector although Coombs has decided to double his score from one to two. “We recently bought one AAA-rated corporate bond,” he says.
One final positive note is that although the battle between the US and Iran over the Strait of Hormuz rumbles on, all the panel members agree that the impact it has so far had on energy supplies and inflation has not been as bad so far this summer as had been feared. That has kept markets upbeat, with overweight positions in both equities and government bonds for the most part being maintained. Overall, the mood seems to be one of subdued optimism.
Note: the scorecard is a snapshot of views for the third quarter of 2026. How the panellists’ views have changed since the second quarter of 2026: red circle = less positive, green circle = more positive. Key to scorecard: EM equities = emerging market equities. 1 = poor, 5 = neutral and 9 = excellent.
Panellist profiles
Rob Burdett is head of multi-manager with Nedgroup Investments.
Dorian Carrell is head of multi-asset income at Schroders.
David Coombs is head of multi-asset investments at Rathbones.
Max Macmillan is head of strategic asset allocation at Aberdeen.