The SNOWBALL has a comparison share VWRP to compare the income from the SNOWBALL versus the income if your plan is to use the 4% RULE.
The latest value of VWRP £166,661, very strong performance, the gamble is when will it stop performing ?
The income from the SNOWBALL will £11,000 and the VWRP comparison is £6,667
If you roll forward to a retirement date in ten years, the SNOWBALL will provide income of around £22,000 and to earn income from a TR portfolio the total would need to be £550,000. GL with that.
Not advice so DYOR, when you have a reliable income stream you could squirrel away some money in a TR portfolio to provide a fund if you intend to withdraw your tax free amount, subject to the tax laws when you retire.
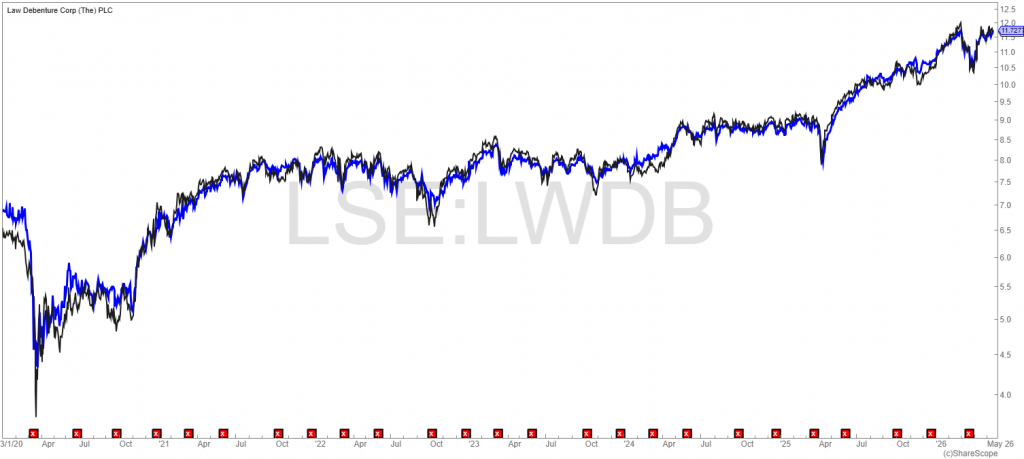
Or add new funds and continue to grow your SNOWBALL and sleep soundly at night. Read the recent post on LWDB.
Income diversification provides flexibility in retirement.
David Brenchley
Updated 17 May 2026
Disclaimer
This is a non-independent marketing communication commissioned by Schroder Investment Management. The report has not been prepared in accordance with legal requirements designed to promote the independence of investment research and is not subject to any prohibition on the dealing ahead of the dissemination of investment research.
Two point one trillion dollars is a large number. At just over £1.5trn, it would buy you the 15 largest companies listed on the London Stock Exchange, including the drugmakers AstraZeneca and GSK, the banking groups HSBC, Lloyds, Barclays and NatWest, the defence specialists Rolls-Royce and BAE Systems, as well as the oil explorers Shell and BP, outright.
It’s also the total amount of cash that was paid out in dividends by the largest 1,600 companies around the world last year, according to the asset manager Capital Group. It’s an annual record, 7% higher than the total paid to shareholders in 2024. More on this later.
Dividends are one of the most powerful components of an investor’s total return. Reinvesting your dividends helps to compound your wealth – the more dividends you reinvest, the larger the stakes you have in a certain investment, for little extra cost.
Alternatively, you could take your dividends as cash, allowing you to draw down a natural income stream in retirement while keeping your capital base largely intact and, hopefully, growing. You could, of course, do a combination of the two – take the income from some investments and reinvest others.
Either of the previous two options provide SIPP investors with attractive investment opportunities as well as flexibility on how and when they take their retirement income, in our view.
Investment trusts can play a key role in the building of said portfolio: the Association of Investment Companies’ (AIC) list of dividend heroes, trusts that have grown their dividends for 20 or more consecutive years, gets bigger every year, while the AIC’s universe encompasses a wider range of sectors than others, boosting one’s ability to diversify successfully – a key aspect of planning that is often overlooked, we think.
A new approach to retirement
For much of their history, pensions followed a simple formula: build the largest pot you can, take the 25% tax-free lump sum at retirement and convert the rest into an annuity, providing an income for life. Growth stopped when the annuity began and portfolios gradually de-risked from equities into bonds as retirement approached.
The Pension Schemes Act of 2015 fundamentally changed that model, introducing pension freedoms. You can still buy an annuity but now have the option to keep your pension invested and draw income flexibly. With retirement potentially lasting 25 years or more, it’s become less about a point of conversion and more a new phase of investment management.
This shift has driven a six-fold increase in the number of self-invested personal pensions (SIPPs) over the last decade. With the state pension age rising to 68, investors are turning to SIPPs to bridge the gap between stopping work and receiving the state pension, while retaining control over a portfolio that can keep compounding alongside income throughout retirement.
The cost of a cautious mindset
Despite greater flexibility, many investors still carry an annuity-era instinct into retirement, sharply reducing equity exposure in favour of cash or low-risk assets. This may feel prudent but can significantly undermine long-term outcomes.
For someone retiring at 60 with a 25- to 30-year horizon, insufficient growth over the long-term is arguably a greater risk than short-term market volatility. A high allocation to cash may smooth stock market fluctuations, but savings rates have not kept pace with inflation over the past decade. Over three decades, this erosion in spending power can have a material impact on lifestyle.
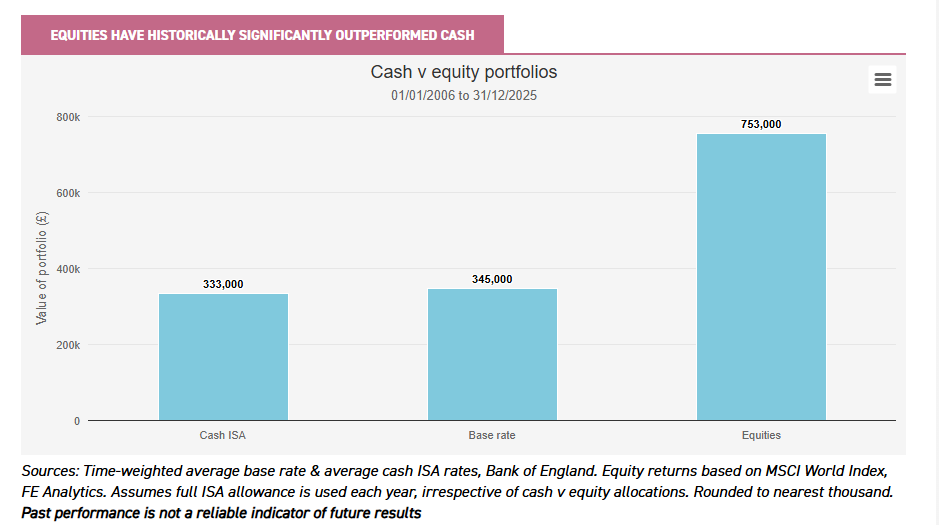
The chart below illustrates this trade-off: maximising ISA allowances each year over the past two decades would have produced a pot worth just under £350,000 in cash. The same contributions invested in global equities would have grown to over £750,000 – in other words, more than double the amount.
Equities have historically significantly outperformed cash
Sources: Time-weighted average base rate & average cash ISA rates, Bank of England. Equity returns based on MSCI World Index, FE Analytics. Assumes full ISA allowance is used each year, irrespective of cash v equity allocations. Rounded to nearest thousand. Past performance is not a reliable indicator of future results
For SIPP investors in drawdown, this points to an alternative way of viewing risk. A temporary fall in portfolio value is uncomfortable but recoverable for long-term investors. However, a ‘safe’ portfolio that grows too slowly can leave investors unable to sustain the income they need or force them to delay retirement to make up the shortfall.
The natural income approach
Drawdown provides valuable flexibility but funding retirement primarily through asset sales can be problematic. Markets are naturally cyclical and selling investments during a downturn crystallises losses, as well as permanently reducing the capital base available to support future income and growth. This can be particularly damaging during the early stages of retirement when the portfolio has less time to recover.
The natural income approach offers a practical alternative: rather than selling assets to generate a quasi-income stream, the dividends, interest and distributions from investments provide the income element while the capital base remains invested, without needing to resort to forced sales when markets dip.
If an investor is keen to take income out of capital, one can find investment trusts to do this for them while still taking their own income naturally. The likes of Schroder Japan (SJG) provides an income out of capital, while Schroder Income Growth (SCF) and Schroder Real Estate (SREI) use revenue reserves to top up their dividends.
Finding the right balance
Natural income is not a single strategy but a spectrum that can be tailored to your appetite for risk.
At the more conservative end, UK equity income funds offer relatively stable dividends from blue-chip companies, providing a dependable income stream with lower volatility. Further along the risk curve, sectors such as Asian equities and healthcare can combine meaningful income with stronger growth potential, as we explore later in this report.
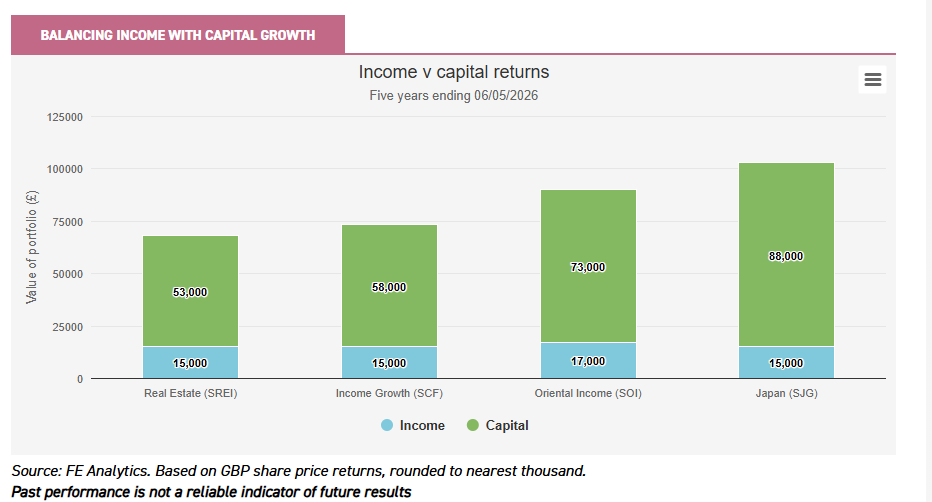
The chart below illustrates how a portfolio can generate both significant capital growth, alongside income. Investing £50,000 in Schroder Japan five years ago would have generated £15,000 in income alongside capital growth of £38,000. Similarly, investors would have received £17,000 in income from Schroder Oriental Income (SOI), as well as a further £23,000 in capital growth.
Balancing income with capital growth
Source: FE Analytics. Based on GBP share price returns, rounded to nearest thousand. Past performance is not a reliable indicator of future results
Investment trusts are particularly well suited to a natural income approach across this spectrum. Unlike OEICs, they can retain a portion of income in stronger years and draw on these reserves to support dividends in weaker ones. This smooths payments across market cycles, rather than passing on income volatility to investors.
Their track record speaks for itself. There are now 20 dividend heroes, half of which have sustained increases for more than half a century – weathering recessions, market crashes and geopolitical challenges along the way.
The objective is to build a balanced portfolio that combines flexibility of drawdown with assets capable of a generating sustainable, growing income while preserving capital for the long term.
Spread your risk
That diversification has been described as the only free lunch in investing has become a rather well-worn cliché, but there’s a reason for that: it’s true, and it arguably only becomes truer the shorter your investment time horizon, and the more income-focused your requirements become.
In your 30s and 40s, it makes sense for many to be invested only in equities, with the point of diversification here being to spread your risk around, by investing in companies listed all around the world. Don’t just bet all on red (the US); have a little on black (the rest of the world, including emerging markets), too.
As we’ve already said, reducing volatility too significantly in the early stages of your retirement in favour of bonds or cash can have the opposite effect from which you’d intended and see you fail to keep up with inflation, thus reducing your future purchasing power significantly.
Equities should always, in our view, make up the bulk of an investor’s portfolio, no matter what their age and objectives. However, there are alternatives available for those looking to take all or some of their income naturally.
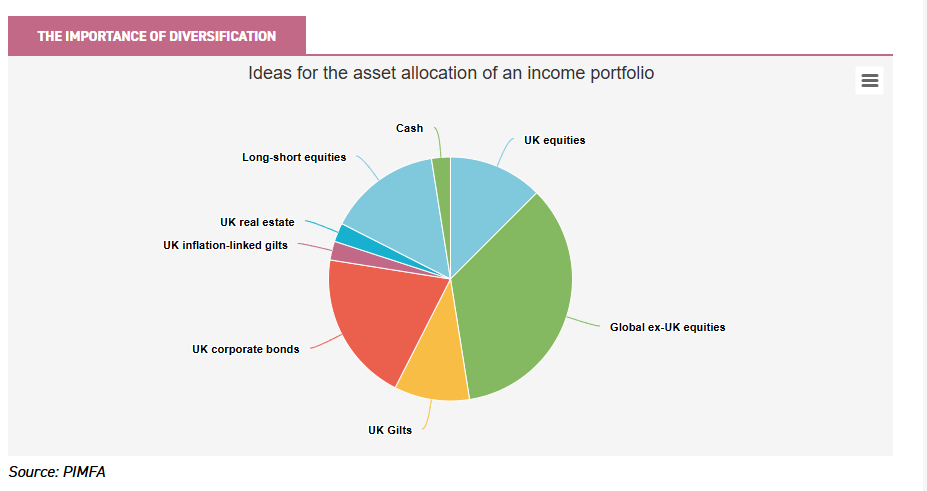
Below, you can see the suggested asset allocation of the income-focused Morningstar PIMFA Private Investor Index, which aims to represent the investment aims of wealth managers.
The importance of diversification
Source: PIMFA
We’d suggest a much reduced (or even no) exposure to long-short equities in favour of a higher allocation to real estate and, perhaps, an additional investment into infrastructure and/or renewable energy infrastructure.
Before we get into the nitty gritty, the first thing to note is that US exceptionalism, while being questioned by some, remains a strong theme. An allocation here for a portion of your retirement portfolio is prudent.
However, the headline yield on the S&P 500 is a lowly c. 1.2%, suggesting it’s not a deep, dividend-oriented market. Indeed, the FTSE All-World High Dividend Yield Index has 38.6% of its assets invested in the US. That’s a significant allocation, but a c. 35% underweight to the US’s c. 60% weighting in the FTSE All-World Index.
The solid base
You don’t have to look far to find the gold standard for dividend investing: our domestic stock market has the biggest yield of all major regions and countries. The large-cap FTSE 100 yields c. 3.1% and its mid-cap counterpart the FTSE 250 yields c. 3.7%, according to FTSE Russell. This makes the UK’s dividend yield higher than all the other major markets around the world.Source: FTSE Russell
Clearly, the UK has long had a strong dividend culture, but it should be noted that not all dividends in the UK stock market have been created equal. UK dividend growth has lagged most other regions, according to Capital Group. Core UK dividends, which adjusts for factors like one-off special dividends and exchange rates, grew just 1.9% year-on-year.
That said, the median growth rate was 7%, showing a big difference between the haves and the have nots, as it were. To us, this shows the pitfalls of investing in a passive UK equity income fund that discriminates between neither the fundamental quality of a company’s dividends nor whether a stock is overpriced or underpriced, which active management does. Hence, our view is that one needs to take an active view.
One trend we’ve observed over the past couple of years is the increasing prevalence of UK companies diverting some cash that in times gone by would have gone towards paying a dividend towards buying back their own shares. Again, active strategies can put themselves in the best possible place to take advantage of this.
To put this in some context, using SCF as an example, during the trust’s most recent financial year, 31 of its 47 portfolio holdings, 67% by portfolio value, conducted buybacks, up from 60% in 2024 and 38% in 2023.
This may perturb those fully focused on dividend income, but we think it’s a positive trend – as does Sue Noffke, manager of SCF. The fact that SCF is benefitting from share buybacks shows that Sue’s process of finding businesses with healthy cash flows and solid balance sheets is working well. It also gives us confidence in the capital allocation decisions being made by the boards of UK plc. That said, we wouldn’t be surprised if buyback activity slowed and we saw more companies reinvesting for growth, which would also be a welcome development.
SCF is one of the dividend heroes we mentioned earlier, having grown its dividend every year since its first full financial year in 1996, making this its 30th year of increases.
The dividend has grown 4.1% on an annualised basis, versus annualised inflation of 2.5%, from launch to 31/08/2025, equating to real annual growth of 1.6%, helping to grow shareholders’ purchasing power.
This, in our view, shows the power of retaining a good slug of cash in equities, even when many would suggest dialling back significantly. The achievement is even more impressive when set against the fact that in those 30 years, we’ve seen the global financial crisis and the Covid-19 pandemic, when dividends fell sharply.
The up-and-comer
There’s no doubt that the pretender to the dividend crown is Japan. The MSCI Japan and TOPIX indices’ dividend yield of c. 2% may seem rather measly, especially when compared with the UK. However, the headline level yield hides a plethora of nuances.
In core terms, Japanese dividends grew by an impressive 12.5% in 2025 – the best among the major markets by a long way. One key driver of Japan’s income story is the accelerating corporate governance reforms.
There’s plenty of room for this to grow even further in the coming years, particularly as just under 60% of TOPIX companies are sitting on net cash, versus around 20% for the S&P 500 and STOXX 600. In addition, while payout ratios are rising, they also remain below US and European levels.
There’s no doubt that active management can offer considerably more above and beyond Japan’s headline yield. SJG has adopted an enhanced dividend policy, which pays out 4% of average NAV each year, placing it at the top of the AIC Japan sector with a current yield of 3.6% against a sector average of 1.7%.
Japan’s not just about the income story, though – there’s growth aplenty, too. Indeed, the TOPIX delivered twice the GBP return of the S&P 500 in 2025.
It’s eminently possible that this will continue. Artificial intelligence is emerging as a compelling tailwind in the Japanese market, as investors start to broaden their exposure to the theme from semiconductors to the physical infrastructure of an AI-enabled economy. Japanese industrial and robotics expertise is becoming a strategically important part of this supply chain.
This all translates into forecasts for double-digit earnings growth for the MSCI Japan Index in both 2026 and 2027. Despite all this, Japan’s major bourse still trades at a significant discount to its American counterpart.
There may be a clear push to making Japanese companies more shareholder friendly, but it remains a market that is hard to navigate, given the near-4,000 companies listed. There’s also a real dearth of research coverage for much of the small and mid-cap part of the market, which appeals as both attractively valued relative to large-caps as well as exhibiting stronger earnings growth prospects and reduced exposure to tariff risk given its more domestic orientation.
Around half of SJG’s portfolio is invested in small- and mid-cap companies, providing a meaningfully different exposure to Japan’s growth story than a passive solution while still participating in the income dynamics.
The underappreciated for income region
Across the sea and looking towards mainland Asia, we find a rather under-the-radar region when it comes to dividend investing. Asia has been prized for its growth prospects – and for good reason: the continent boasts thriving economies, a burgeoning consumer class and a new generation of global market leaders, particularly within technology.
At the same time, though, Asia has long had a strong dividend culture that is becoming even more ingrained. Pacific ex-China, Hong Kong and Japan saw core dividend growth of 6.8% in 2025, according to Capital Group, with Taiwan a real driver. China and Hong Kong’s core growth was 3.1%, meanwhile. Yields are now challenging even the most established income markets.
Further, earnings growth across the region is forecast by Goldman Sachs to accelerate from around 10% in 2025 to 30% in 2026, while around 40% of Asia (ex-Japan) companies are net cash positive, with payout ratios well below the US and Europe.
This all suggests the region is set for further dividend growth, especially as ongoing corporate governance reforms encourage cash to be returned to shareholders, as well as providing scope for capital gains, making it very much a total return story.
Schroder Oriental Income offers the best of both worlds in this regard. The trust has topped the AIC Asia Pacific Equity Income sector over the past five years. SOI has also grown its dividend for 19 consecutive years, putting it on track to become the first Asian fund to become a dividend hero.
Manager Richard Sennitt brings over 30 years of experience, supported by an extensive team of more than 40 analysts across six regional offices, providing the ability to dig deep into what is a large and fertile universe of companies.
Richard’s bottom-up approach seeks both a clear income rationale and the potential for capital gains, rather than filling the portfolio with the highest-yielding stocks. He focuses on quality businesses with strong balance sheets, solid earnings growth and sustainable dividend prospects. This better places SOI to capture capital growth than peers, since its income is fully derived from the underlying portfolio.
Richard also applies a top-down country and sector overlay, aimed at capitalising on a region that often sees a clear dispersion of both yields and returns at the country level. Take Korea and Indonesia as an example of this. MSCI Korea delivered a total return of 86% last year, leaving it offering a headline yield of 0.9%. MSCI Indonesia, meanwhile, offers a high 4.8% yield, but saw a meaningful decline last year.
Asia is a notoriously volatile region, a characteristic that many would suggest isn’t a great ingredient for an income-focused portfolio. Indeed, high headline yields offered on Asian funds and trusts could end up being unsustainable and come at the cost of capital growth.
SOI’s focus on companies paying sustainable, growing dividends makes it a steadier and more reliable income trust that grows sustainably over the long term, in our view. Its dividend yield of c. 3.2%, is on par with the UK with much better prospects for earnings and capital growth, too. You wouldn’t want to miss out.
The diversifier
Equities aren’t the only place one can consider for a well-balanced, diversified, income-generating portfolio. Bonds are clearly much more attractive than they were, say, five years ago, so they now warrant a place in a portfolio. That said, 2022 did highlight some growing concerns when it comes to their safe-haven status.
Bonds perform poorly when inflation rises for a sustained period of time because of their correlation with interest rates, which tend to rise to combat rising prices. The huge debt burdens Western nations have placed upon themselves pose potential challenges for government bond markets down the line.
From a headline perspective, the dividend yields available on UK commercial real estate investment trusts are attractive versus government bonds. Schroder Real Estate (SREI), for example, currently yields c. 7.3% versus c. 4.9% for the 10-year gilt and c. 4.4% for the two-year gilt, a premium of c. 240 and 290 basis points respectively.
The asset class has some interesting dynamics at play that underpin that income generation – as well as providing the basis for growth of capital at the same time.
On the income front, rents have been remarkably resilient in recent years. Between June 2022 and around September 2024, the MSCI UK Monthly Property Index fell c. 25%, yet the UK All Industrial rental growth index, for instance, rose c. 25%.
The supply-demand picture looks supportive, too. There is a lack of good-quality commercial property around, meaning current operators can charge higher rents and the pipeline of new developments remains thin because construction costs are rising, making it more expensive to build new properties.
On the capital growth side of things, we see scope for a recovery, especially when one considers that businesses are demanding higher sustainability specifications on their properties, crimping demand for ‘brown’ buildings.
SREI is a market leader in this respect. Its brown-to-green investment strategy sees it focus its asset management on improving the energy credentials of its portfolio of assets, allowing it to harness the growing evidence we’re seeing of a green premium: the higher rents and stronger valuations commanded by more energy efficient properties.
We’ve witnessed a slight recovery in real estate asset valuations since their most recent nadir, a fact underlined by SREI’s success in disposing of assets above book value, in the main.
Add in SREI’s 8.3% reversionary yield, a proxy for its underlying yield potential, and a sensible dividend policy and SREI looks attractive for a portion of an income seeker’s portfolio.
Breaking free of the annuity shackles
The dawn of pension freedoms ushered in a brave new world where taking an annuity after withdrawing your tax-free lump sum was no longer seen as the default option. It’s opened up a world of opportunity for savvy investors, but has also meant that proper SIPP planning is now more important than ever.
Indeed, there are, as they say, many ways to skin a cat – and just as many ways to access your hard-earned pension savings in retirement.
The 4% rule, where one leaves their capital invested and draws down 4% of the portfolio’s value each year, adjusted for inflation, has become a real no-brainer, helped no doubt by more than a decade of seemingly abnormally good returns from equity and bond markets.
We think that moving forward, one should adjust their expectations of equity returns, with most stock markets currently trading at record highs, the US at extended valuations and the rest of the world, while relatively attractively valued versus America, at perhaps fair value to their own histories.
That’s no reason to shun equities, even in retirement, but does put more importance on seeking investments that can help you to draw a natural income that grows with inflation. This includes diversifying across stock markets across the big, wide world as well as leaning into income-generating real assets such as commercial real estate.
The neat trick which could help turn £1,000 into £20,00
Friday, May 15, 2026
Martin Gamble
Shares and Markets Writer
This article shows how the power of reinvesting dividends can really growth wealth over the long run. While this is purely an illustrative example and nothing in investing is guaranteed it helps show the difference this investment approach can make.
While we use the example of a single company for simplicity, it is crucial that investors hold a balanced portfolio of companies to reduce the negative impact from any single investment going wrong.
Dividends play an important role in growing wealth with one study by Hartford funds showing that between 1960 and 2025, 85% of the cumulative total return of the S&P 500 can be attributed to reinvested dividends and the power of compounding.
Total return and how you can make reinvesting dividends easy
A simple way to think about total investment return is to break it down into the moving parts.
Total return is the capital gain/loss (the change in the share price) plus any dividends paid out. Some measurements of total return will assume dividends are reinvested.
It is easy to forget about reinvesting dividends because it is not always practical to invest smaller amounts of money, so make sure the cost of dealing doesn’t swallow too much of the reinvestment.
The good news is that most online investment platforms provide an automated dividend reinvestment service, known as a DRIP.
How does compounding dividends work?
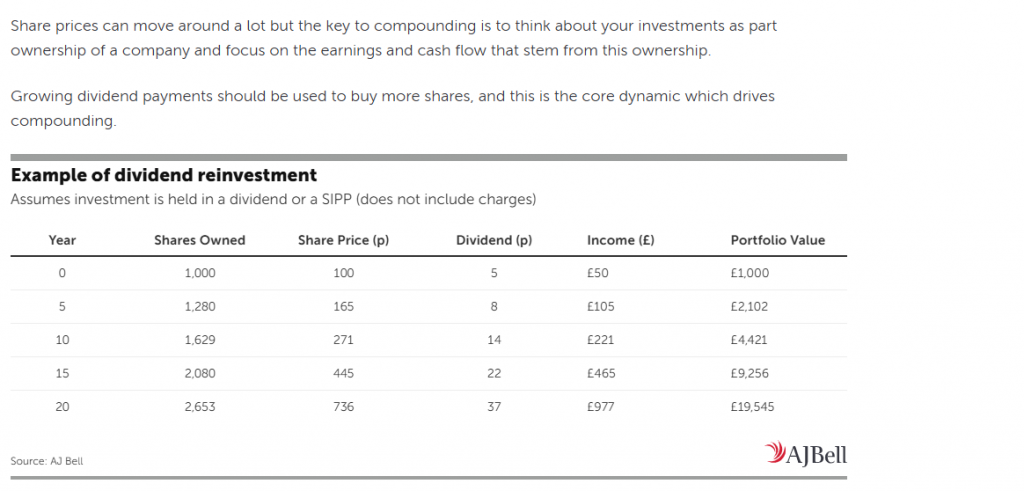
Share prices can move around a lot but the key to compounding is to think about your investments as part ownership of a company and focus on the earnings and cash flow that stem from this ownership.
Growing dividend payments should be used to buy more shares, and this is the core dynamic which drives compounding.
The table shows an investment with a share price of 100p and a dividend of 5p per share equating to a 5% dividend yield. Earnings and dividends grow at 10.5% a year.
The reinvested dividends increase the share count by 5% a year.
Business growth compounds the value of each share (share prices follow profits over time) while dividend reinvestment compounds the number of shares owned.
In the example, the number of shares owned grows from 1,000 at the outset to 2,653 in year 20 and the year 20 dividend payment grows in value to close to your original investment.
A point which is often underappreciated is that wealth creation accelerates over time as the base grows.
It is like a snowball rolling down a hill, the more it rolls, the greater amount of snow it collects. A bigger snowball gathers more snow than a smaller one.
So, growth in the first five years adds just over £1,000 but the same growth rate in the last five years adds more than £10,000 to the pot.
Excluding dividends the investment pot would have only grown to £7,360 which means dividends have contributed 62% of the total return, underlining their importance.
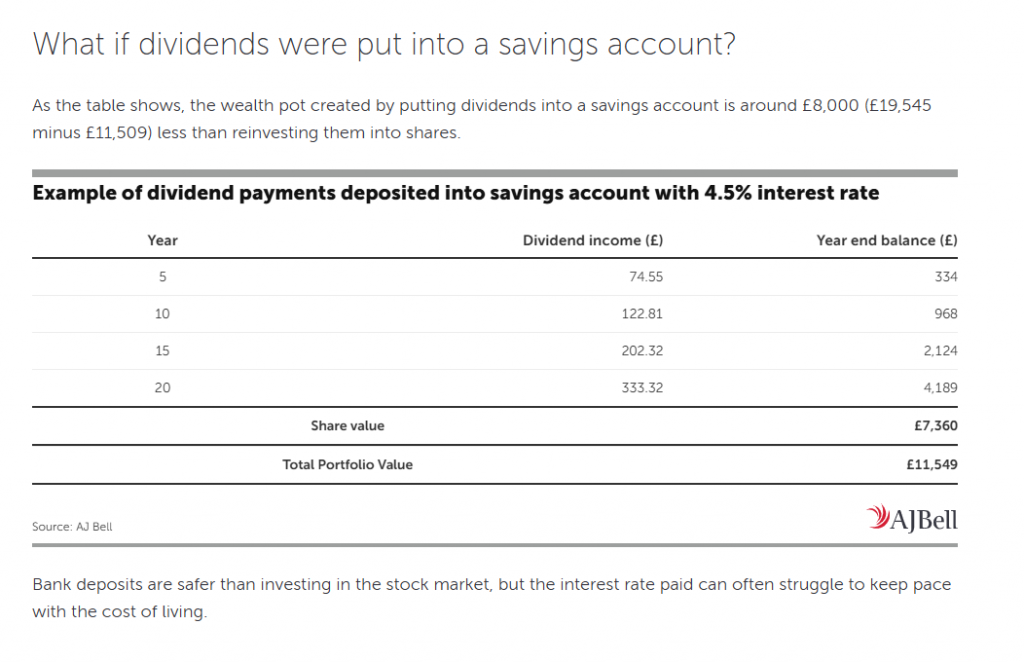
What if dividends were put into a savings account?
As the table shows, the wealth pot created by putting dividends into a savings account is around £8,000 (£19,545 minus £11,509) less than reinvesting them into shares.
Bank deposits are safer than investing in the stock market, but the interest rate paid can often struggle to keep pace with the cost of living.
AJ Bell will re-invest earned dividends, a regular investment, minimum of £25, in 350 shares and selected Investment Trusts. Around the tenth of the month, free of charge. You could use the investment to buyback shares you have sold at a higher price or build new positions at zero cost.
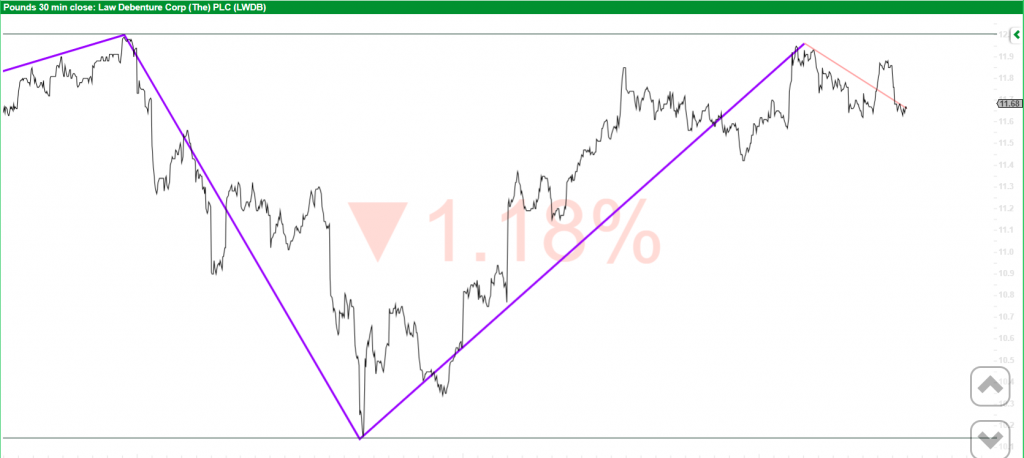
If you think owning shares is easy, you are mistaken. It’s said that ‘ Equities climb a wall of worry’.
If you had been clever/lucky enough to have built up a 100k position in LWDB over many years, from the end of February to 23 March the share fell 15%, that’s a hole in your retirement pot of 15k, in just 3 weeks. If you are using the dividend to pay your grocery bill, LWDB paid when the price was £12.00 a dividend of 3%. 3k a year, as the price fell the yield rose so income was still 3k a year.
With hindsight it was a great trading opportunity, be prepared for the next market crash.
This year’s income for the SNOWBALL will meet the current fcast. The next market crash or sideways movement is the known, when is the unknown.
To be ready to add bargain high yield shares, you need to have cash that doesn’t fall with the market, balanced out by you fail by the month and not the year. There is no way of knowing, without hindsight, the bottom of any fall, so you have to buy and be content with the yield. Two property shares in the coveted list are SUPR, see earlier research on the share and PHP.
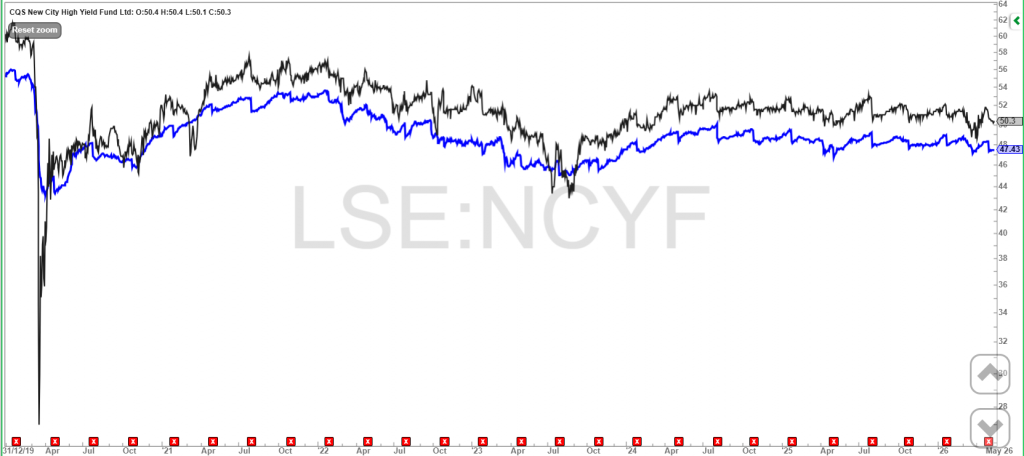
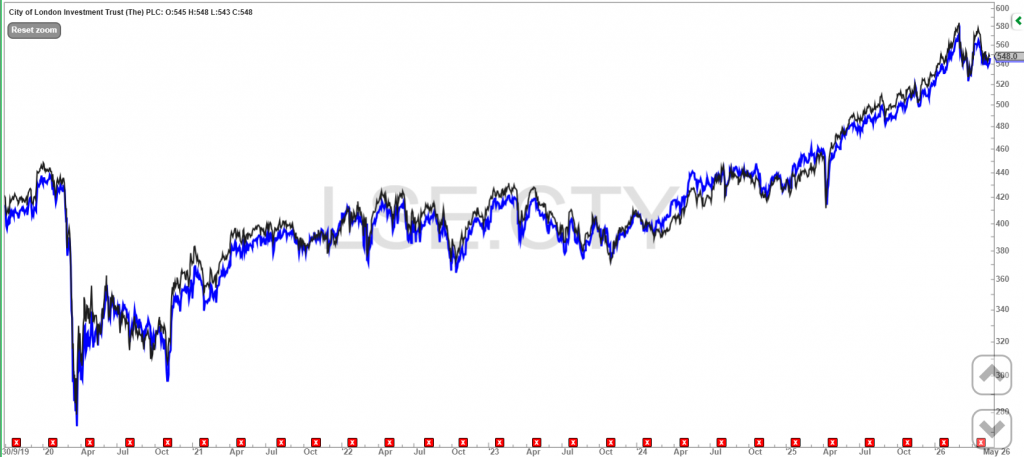
NCYF, for it’s high yield, current yield 9% but the target is a double figure yield, which would allow the SNOWBALL to buy either MRCH, LWDB or CTY, whilst still earning a blended yield of 7%. Any future dividends could be added to this position as you wait for the price to rise and the yield to fall.
A cash equivalent position will be built with XSTR, currently, yielding around 4%, so over a one year period that would be a loss of around £400.00
Remember a current income stream is more important than some promised high yields in the future, until you near retirement, than repeatable dividends are more important than some promised high yields.
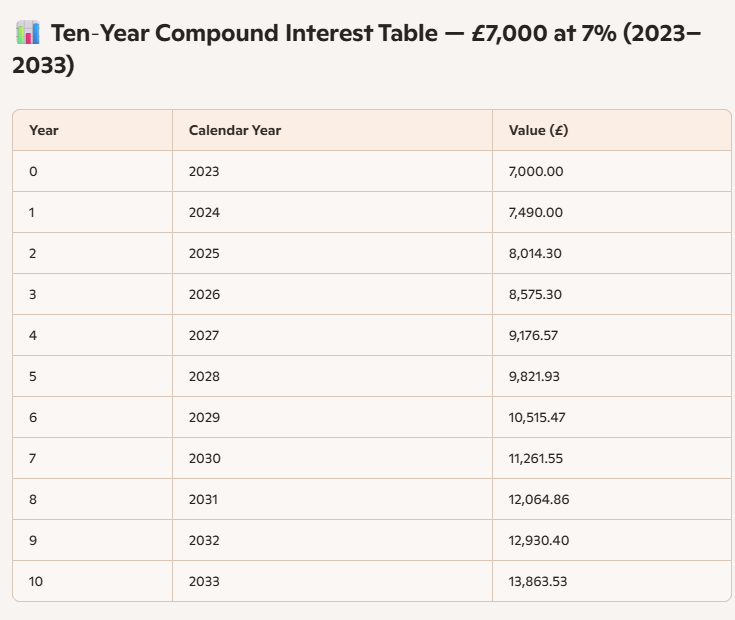
The current target for the SNOWBALL is the year 2030 figure,
has returned to our bestseller list, even as investors continue to broadly favour growth portfolios.
The trust, which has a share price dividend yield of almost 11%, moves back into the top 10, having sat just outside it last week.
The renewable energy infrastructure sector has faced plenty of curveballs in the last year though it has received greater interest on the back of conflict in the Middle East.
Greencoat UK Wind shares have certainly received a boost since mid-March and have returned around 4% so far in 2026.
The only other dedicated income fund in the list is the value-minded Artemis Global Income I Acc (B5ZX1M7), though investors are likely drawn by its continued stellar returns rather than its yield. The fund, which has a chunky allocation to emerging markets, has returned around 18% so far in 2026.
Otherwise, we see plenty of appetite for some of the classic growth funds – and some of those that have delivered especially big gains in recent weeks.
which raised a decent chunk of money in its C share issuance, retains a place in the top five, while three broad global tracker funds remain in the top 10.
This “Celebrity” Fund Launch Can Teach Us a Lot (About What Not to Buy)
Michael Foster, Investment Strategist Updated: May 14, 2026
If you ask the average investor what, say, an ETF is, you’ll likely get a good answer. A closed-end fund (CEF)? Likely a blank stare.
That’s because CEFs are a tiny corner of the market, with only about $300 billion in assets among them. ETFs? About $13.5 trillion. The scale is way out of whack here.
At CEF Insider, of course, we like it this way. It’s why “Insider” is in the service’s title.
Since CEFs are obscure, we can easily find overlooked ones trading at big discounts to net asset value (NAV, or the value of their underlying portfolios). Then there’s the income: Right now, the average CEF yields 8.7%, with many paying dividends monthly.
CEF discounts make our upside play straightforward: Buy when the discount is unusually wide, ride along (and collect our payouts!) until it narrows or flips to a premium. Then sell for a profit and move on to the next overlooked CEF.
Rinse and repeat.
CEF Obscurity Sometimes Attracts Celebrity Investors
But even though CEFs are off the radar, the odd famous investor does dip their toe in every so often. One such person is Bill Ackman.
Ackman is a value-investing maverick and multibillionaire whose public fights against corporate management teams have grabbed headlines worldwide.
He dramatically took on Herbalife (HLF) via a huge short position in 2012. He ended up on the losing end of that one, but his aggressive moves did turn Chipotle Mexican Grill (CMG) around. Similar tactics with Valeant Pharmaceuticals (VRX) and Canadian Pacific Kansas City (CP) had mixed results.
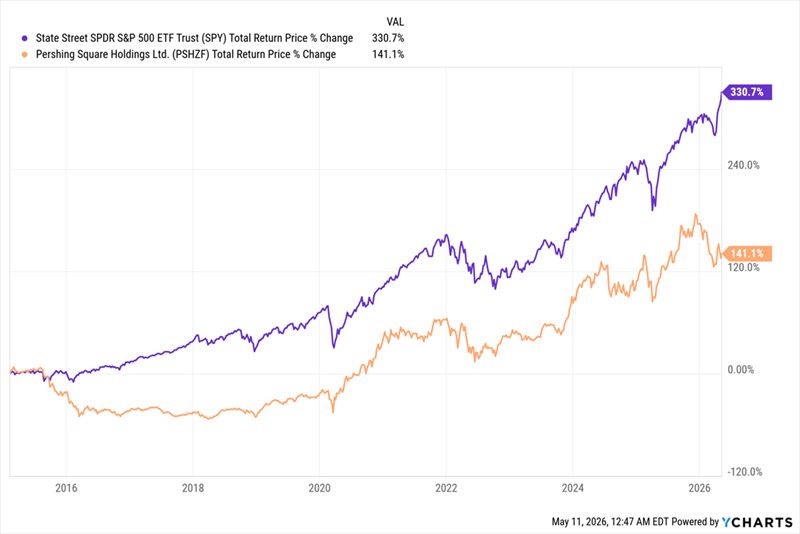
But overall, retail investors who’ve ridden along with Ackman haven’t seen great returns.
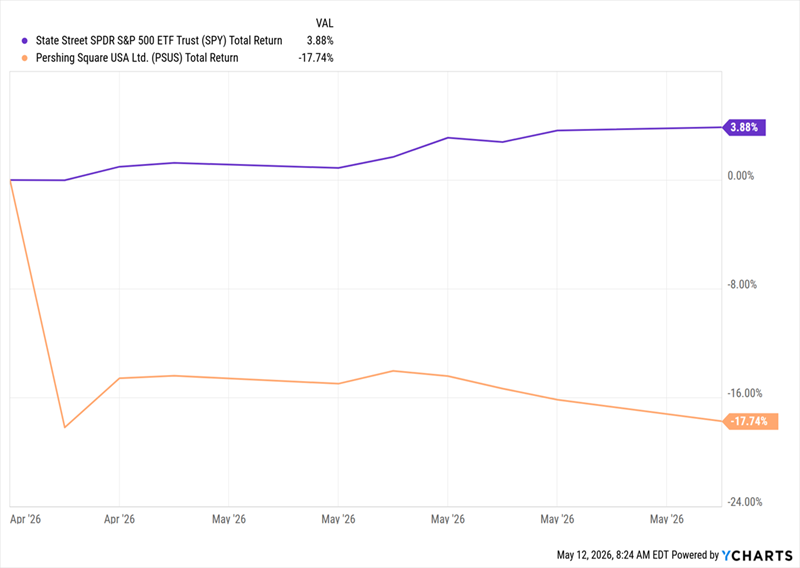
Below you can see the performance of his hedge fund, Pershing Square Holdings (PSHZF), in orange, versus an S&P 500 index fund, in purple, over the last decade. Since Pershing is based in London, we’re looking at its US-listed over-the-counter (OTC) stock here:
UK-Based Pershing Square Has Underperformed for Years …
As a result, PSH has traded at a wide discount to NAV (around 30% much of the time) for years. That’s a steeper markdown than all but the six cheapest CEFs tracked by CEF Insider.
Note that since PSH is London-based, its structure is a bit different than the CEFs we cover in CEF Insider (which is why you won’t find it on a screener like CEF Connect).
Nonetheless, let’s continue, because Ackman’s CEF efforts do hold useful lessons for us, especially since, in April, he debuted a US-listed CEF: Pershing Square USA Ltd. (PSUS). That fund fell sharply after its IPO:
… And Ackman’s US-Listed CEF Wobbled Out of the Gate, Too
While the S&P 500 (again shown through the performance of an S&P 500 index fund, in purple) has done well in the last couple of weeks, as of this writing, PSUS (in orange) has gone the other way, with a 17.7% drop in value from its IPO date.
What does this tell us? With PSUS moving from par to a roughly 12% discount in a couple weeks, the firm’s London listing clearly wasn’t the problem. It’s simply that, right now, investors don’t see Ackman as a star manager deserving premium pricing.
Moreover, PSUS has mainly marketed itself as a vehicle to invest alongside Ackman, and has not revealed its holdings. (CEFs don’t have to do so at IPO, and the fund is so young it hasn’t had time to make this disclosure.)
That makes it tough to predict where the discount will go from here, but the roughly 30% markdown PSH typically sports is a decent guide. That, along with the fact that PSUS doesn’t pay a dividend, either, makes this a fund to avoid.
The Fee Issue
Then there are PSUS’s fees, which in my mind are a bigger issue than the lack of clarity around its future moves. According to their SEC filings, PSUS’s managers will charge investors a flat 2% fee:
“The Company [i.e., PSUS itself] pays the Manager [i.e., Ackman and his team] a fee, payable quarterly in advance on the first business day of each fiscal quarter, based on the Company’s NAV on the last day of the previous fiscal quarter equal to 0.50% (or 2.0% on an annualized basis).”
Technically speaking, this is less than the average CEF, which has fees of 2.6%. However, that figure is skewed by CEFs with very high fees, like the XAI Octagon Floating Rate and Alternative Income Trust (XFLT), whose fees are more than 5% of assets.
There are plenty of solid CEFs with much lower fees, like the Adams Diversified Equity Fund (ADX), a CEF Insider holding whose fees are just 0.49% of assets.
This is also a bit of an unfair comparison because many CEFs (like XFLT) look like they charge high fees because they include the cost of leverage in their calculation. Notably, that 2% fee PSUS discloses does not include the costs on the $50 million of preferred shares it plans to issue, or the 15% to 20% leverage ratio it intends to carry over time.
That points to potentially higher fees in the future.
That isn’t necessarily a bad thing for CEFs, as strange as that sounds! A heavily discounted CEF with high fees can still outperform a low-fee CEF trading at a premium. But it also lowers PSUS’s appeal, unless and until its discount gets even wider still. Otherwise, this is a fund to avoid, despite its high-profile manager.
These 4 “Pivot Points”—Not Ackman’s Flashy CEF—Are Where We’re Going Next
The great thing about CEFs is that, despite their small market size, they give us lots of ways to tap into the fastest-growing trends out there. And they let us do so at a discount!
I’m tracking 4 CEFs that are cheap now, while kicking out a solid 10% average dividend. Plus they give us “upside two ways”:
Through their narrowing discounts: All 4 of these funds are unusually cheap, which can’t last because …
They’re dialed into the biggest shifts AI is driving today, including the automation of manufacturing, fast drug development and surging power demand.
Wall Street is starting to notice these shifts, but there’s still time to get in. And overlooked CEFs are the perfect way to do it with their way overdone discounts.
Is Wall Street’s Trash Our Treasure? 5 Outcasts Yielding up to 18.3%
Brett Owens, Chief Investment Strategist Updated: May 15, 2026
Let’s capitalize on analyst incompetence—and bank yields up to 18.3%, with upside to boot!
A widely cited academic study on analyst target price accuracy found that only about 54% of 12-month price targets correctly predicted even the direction of the subsequent price move.
Fifty-four percent. On direction alone. That’s barely better than a coin flip!
Analysts give specific price targets to stocks like they are scripture. In reality, they don’t even know if the thing is going to move up or down.
And it gets uglier. A 2024 Yale School of Management study found that analysts systematically delay downgrading stocks after bad news—to curry favor with the companies they cover. The suits aren’t just bad at predicting stock moves. They’re deliberately stalling their warnings to protect their banking relationships.
Put those two facts together and the picture is clear. Wall Street “research” is a farce. Which is exactly why it works so well as a contrarian indicator!
When Wall Street’s collective price target sits below the stock’s current price, that’s not a signal to sell. That’s a signal that full pessimism is baked in! All it takes is one decent earnings report and the stock gaps higher while the research machine scrambles to reload.
Today we’ll review five hated dividend payers with yields of 6.7% to 18.3% with the potential to rally when analysts change their tune.
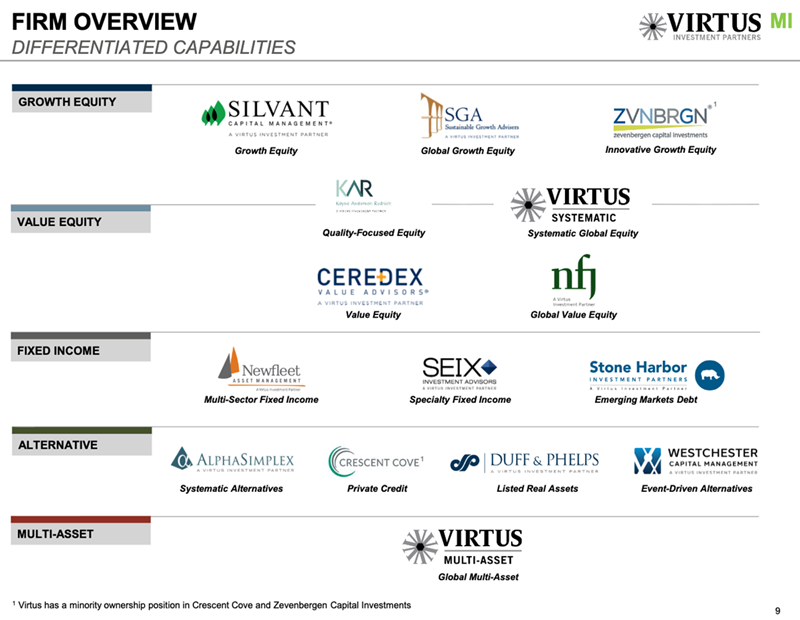
Let’s start with Virtus Investment Partners (VRTS), an investment manager that provides mutual funds, exchange-traded funds (ETFs), closed-end funds (CEFs), insurance funds, separately managed accounts and more.
This is no Vanguard or Fidelity. Its $160 billion or so in assets under management (AUM) is a fraction of what the big boys handle, and most readers might not recognize the name.
But Virtus still stands out because of its structure. It’s a partnership of numerous boutique investment advisers, which means different funds under the Virtus name are often managed by different groups.
This company peaked in late 2021 amid the broader market’s roaring recovery. Since then, however, it has lost nearly 60% of its value, reflecting slowdowns on both the top and bottom lines. This year might not be any different, with the pros looking for single-digit declines in both revenues and profits.
Part of the issue has been weak performance in some of Virtus’ most important funds. But there’s also the overall nature of its products—Virtus is a predominantly actively managed (read: higher-fee) outfit in an age when most investors are looking for passive, low-fee ways to invest.
Wall Street’s not high on this stock as a result. A common thread among hated stocks is that they’re also poorly covered stocks—many analysts prefer to simply drop coverage of a company rather than irk management by telling people to sell. That’s the case with VRTS, which has just four covering analysts. One says it’s a Buy, one calls it a Hold, and the other two are Sells. For however tame that might sound, that’s an ugly split in the stock-research world.
Virtus does have a handful of contrarian appeals, though.
Shares trade for a paper-thin 5.5 times next year’s earnings estimates. The dividend has exploded by more than 400% over the past decade, and that includes a near-doubling over the past five years alone. That payout is safe, too, at less than 40% of next year’s earnings. And the company has made numerous acquisitions (such as Alphasimplex, AGI and Stone Harbor) in hopes of sparking longer-term growth.
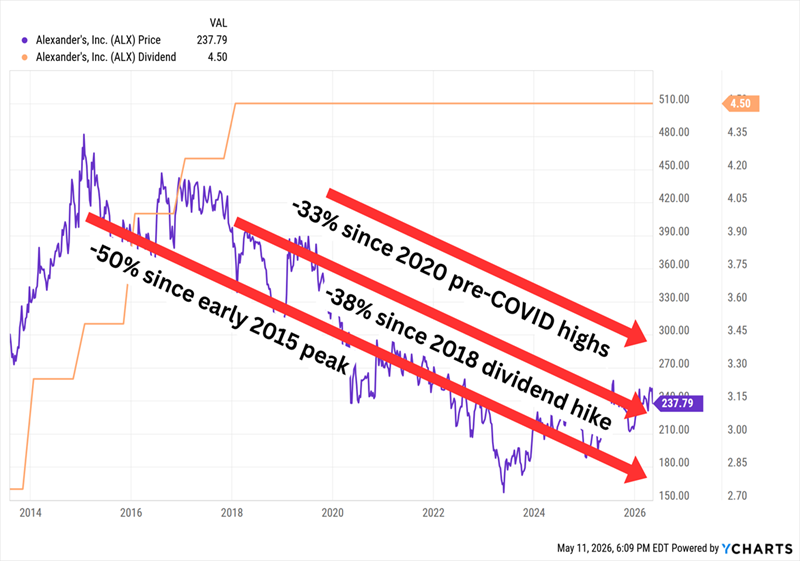
Alexander’s (ALX) Dividend Yield: 7.6%
Alexander’s (ALX) is a REIT that operates exclusively in the greater New York City metropolitan area. It’s technically classified as an office landlord, though its properties also include retail and residential space. Vornado Realty Trust (VNO), which predominantly operates in the Big Apple (but also owns one property in each of Chicago and San Francisco), owns a 32.4% stake and also manages the company, which means ALX owes it annual management fees and occasionally development fees.
The most important thing to know about Alexander’s is just how concentrated it is. ALX has just five properties under its umbrella—and it’s about to be four. In March, the company entered an agreement to sell its Rego Park I property to Northwell Health for $202 million in net proceeds.
So, in a nutshell:
Alexander’s already-tiny real estate roster is somehow getting smaller.
Despite its small portfolio, the company still has external management expenses.
ALX earned $10.82 per share over the trailing 12 months and is expected to earn $12.08 per share across 2026, but it’s on pace to pay out almost 50% more than that ($18 per share) in dividends.
Shares trade around 19 times next year’s AFFO estimates.
The stock is down to one lone analyst who says we should Sell.
No Greatness From Alexander’s Since Its Last Dividend Hike in 2018
I pointed out Alexander’s loathed status on Wall Street back in November. Since then, it has put together a 15% gain, but it has done so by fattening an already hefty valuation.
If ALX continues to rise from here, it will be defying gravity—and sanity.
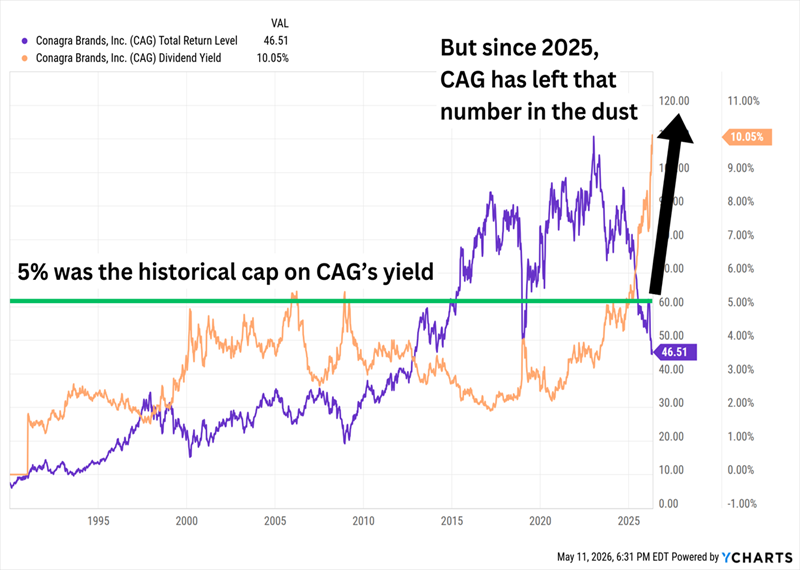
ConAgra Brands (CAG) Dividend Yield: 10.0%
Companies selling pantry and household basics are not popular right now. I recently highlighted how sector-wide pain had driven up consumer staples yields, but it’s not just shareholders who are selling—analysts think we should unload those stocks, too. Wall Street’s most-hated list includes a ton of sector names, including Kraft Heinz (KHC), Campbell’s Soup (CPB) and General Mills (GIS), the last of which I identified as a prime GLP-1 victim.
But the worst-rated of the group right now is Conagra Brands (CAG), which has gone from a reasonably high yielder to a sky-high payday for the wrong reason: a multiyear cratering in shares.
CAG Is Paying 2x Its Historical Dividend Ceiling
Conagra owns a broad portfolio of packaged food brands, including Banquet, Healthy Choice, Marie Callender’s, Vlasic, Duncan Hines, Slim Jim, Reddi-Wip, and more. It also has a foodservice business that offers more diversification than most grocery-anchored staples names.
But it has been taking blows from all sides: GLP-1 adoption. Soaring input costs. Cuts to SNAP. Encroachment by private-label brands. Its top and bottom lines have been contracting, and the pros expect more of the same over the next couple years.
Understandably, the pros don’t love it. A dozen analysts covering Conagra say investors should stay on the sidelines; two call it a Buy, and four say it’s a Sell. Consider this a “bearish Hold”; analysts overcorrect toward being bullish, which means even Holds have a negative connotation, making this a very bearish consensus.
The dividend is in doubt. The payout represents about 80% of next year’s (lower) earnings estimates, which by itself doesn’t signal an immediate threat—plenty of defensive companies can manage at that level. However, 1.) it doesn’t give CAG much room to explore M&A to reposition its portfolio, and 2.) that’s well above Conagra’s stated target ratio range of 50% to 55%.
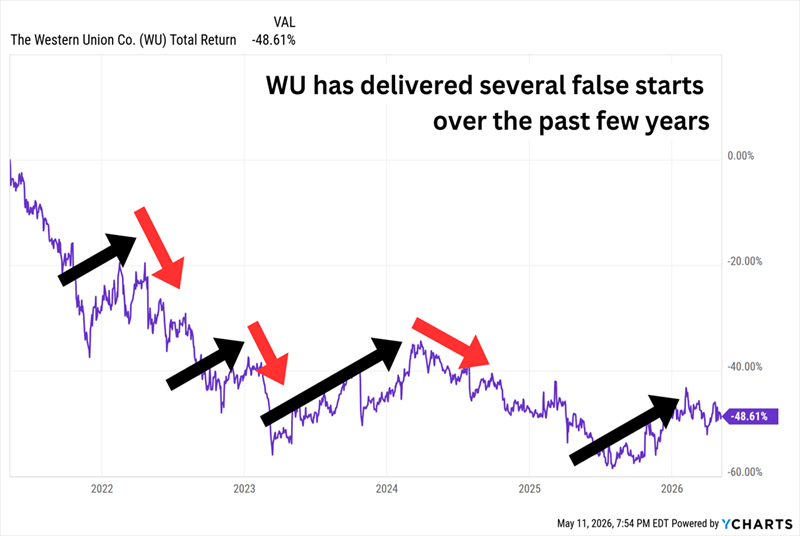
Western Union (WU) Dividend Yield: 10.5%
Western Union (WU) was founded as a telegraph service, and its core business today is money transfers in an age of PayPal and Venmo.
It seems like such a dead company from 10,000 feet that Wall Street’s view—it has 10 Holds, just 1 Buy, and six Sells on the stock—almost seems too optimistic.
But credit where credit is due: Western Union has been scrapping hard to remain relevant.
Its “Evolve 2025” initiative is standard corporate fare: new products and improvements, as well as operational efficiencies.
However, in April 2025, it spent $77 million on foreign-exchange specialist Eurochange to further expand its “Travel Money” unit.
It made a bigger splash that summer with a $500 million acquisition of Miami-based International Money Express (IMXI), aka Intermex, which serves some 6 million customers who send money from the United States, Canada, Spain, Italy, the United Kingdom, and Germany to more than 60 countries. (The deal is expected to close in mid-2026.)
WU has also begun to lean heavily into digital assets. It very recently launched its own “USDPT” stablecoin alongside its Digital Asset Network, the latter of which will help people with partnered cryptocurrency wallets cash out across Western Union’s network of 380,000 agents. A Visa-branded prepaid USD “stable card” is expected to launch later this year, will let consumers hold value in Western Union’s USDPT and spend it globally.
The question is whether all of this will help counter the secular decline of its cash-based money-transfer business. One promising sign? Revenues are expected to improve by mid-single-digits this year and next, and while profits are expected to remain virtually flat for the fourth straight year, the pros now see a 10% bump in the bottom line for 2027.
Can Western Union Finally Stop the Long Bleed?
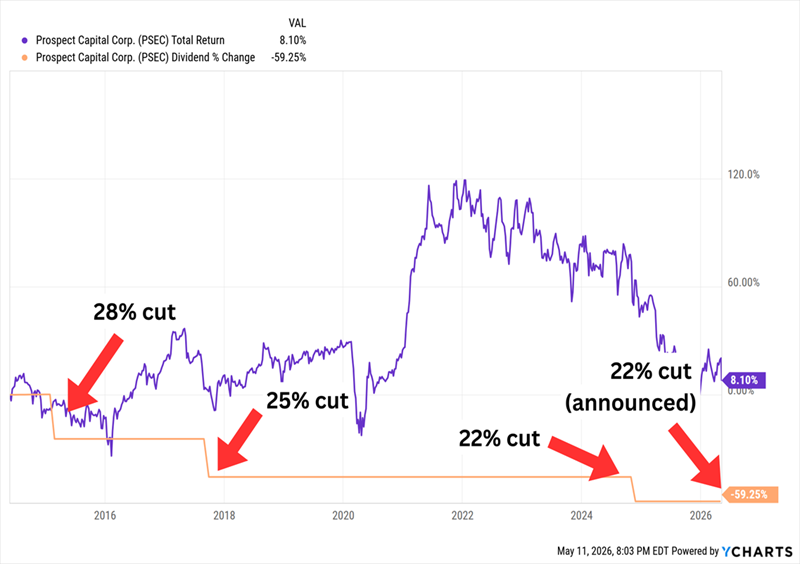
Prospect Capital (PSEC) Dividend Yield: 18.3%
Prospect Capital (PSEC) has a lot of headline stats that are hard to ignore. It pays more than 18% right now. It’s a monthly dividend stock, to boot. And it trades at a wild 60% discount to its net asset value (NAV), making it one of the cheapest business development companies (BDCs) on the market.
On the other hand …
4 Dividend Cuts and Barely Breakeven Returns in 12 Years
It was already a miserable history to overcome, and it got even worse of late, with Prospect Capital taking another slice out of its dividend in early May.
Wall Street is fed up. Only one analyst covers PSEC anymore, and they think we’re better off without it.
However, despite its steep losses of the past few years, PSEC is still one of the larger BDCs by both market cap ($1.2 billion) and net assets ($3 billion).
Prospect has a diverse portfolio of 89 companies across 31 industries, though I should point out that’s a couple dozen fewer investments than it had less than a year ago. The company is in the midst of trying to transform its portfolio—it has been increasing its first lien mix (72%) and reducing its second lien senior and secured loans (12.4% of the portfolio at cost). It has also fully unloaded its CLO equity portfolio and exited several real estate properties.
PSEC is also much more defensively positioned for the current market moment, with just 3% software-industry exposure versus a peer average of 23%.
These moves might eventually bear fruit, but Prospect Capital is a “show me” stock given its past, and so far, it’s not showing much. PSEC has reported year-over-year declines in quarterly net interest income across all three quarters of its current fiscal year, it’s pacing for an 8% drop in profits for the full year, and its cash payout has been cut down yet again.
Monthly Dividends of 9%+ We Can Actually Count On!
Rock-solid 2% or 3% yielders are a dime a dozen. It’s easy to pay a modest dividend without breaking the bank.
We have to be a lot more selective about sky-high payers like we discussed above. Far fewer companies can pay us 8%, 9% or more, and some of them are very dangerous dividend landmines just waiting to blow up your portfolio.
There are three SONIA‑tracking ETFs in the UK, the three main optionsare and they’re all ultra‑low‑risk cash‑equivalents designed to mirror the Sterling Overnight Index Average (SONIA).
Below is a clean, structured comparison of the three SONIA ETFs currently available:
Invesco GBP Overnight Return Swap (GONS)
Xtrackers GBP Overnight Rate Swap (XSTR)
Amundi Smart Overnight Return GBP Hedged (CSH2)
These are the only widely‑listed, liquid SONIA ETFs in the UK market today.
With markets at all time highs and with the world at war, it’s scary times to re-invest in shares.
The SNOWBALL wants to build a cash fund to re-invest when the next market crashes occurs, hopefully not too soon until the cash element has built accrued.
I am content, at the present time with the dividend stream for this financial year, so I am going to re-invest the income in a money market ETF, yielding around 4%.