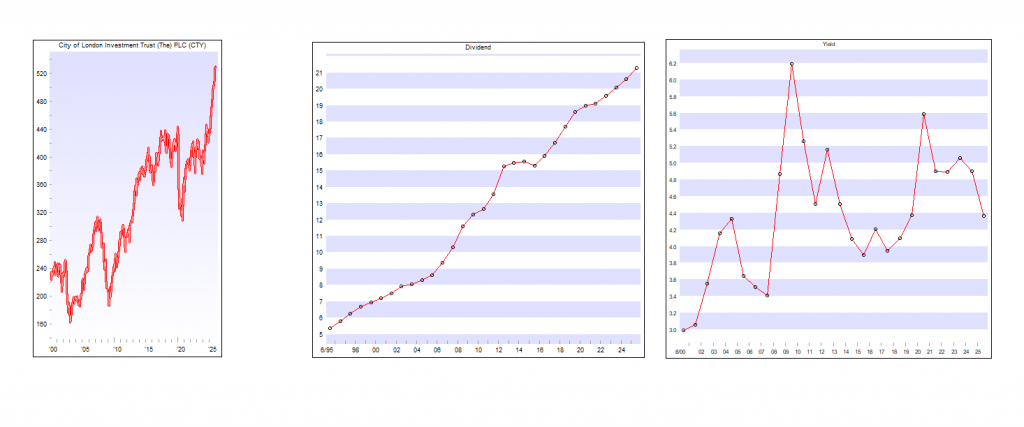
Having done your research you know that CTY have paid an increased dividend for over 50 years.
You wanted a ‘secure’ dividend just in case your research leads you to buy at the wrong time.
Current yield 4%, because it’s in lots of peoples most wanted shares list, it trades at a small premium.
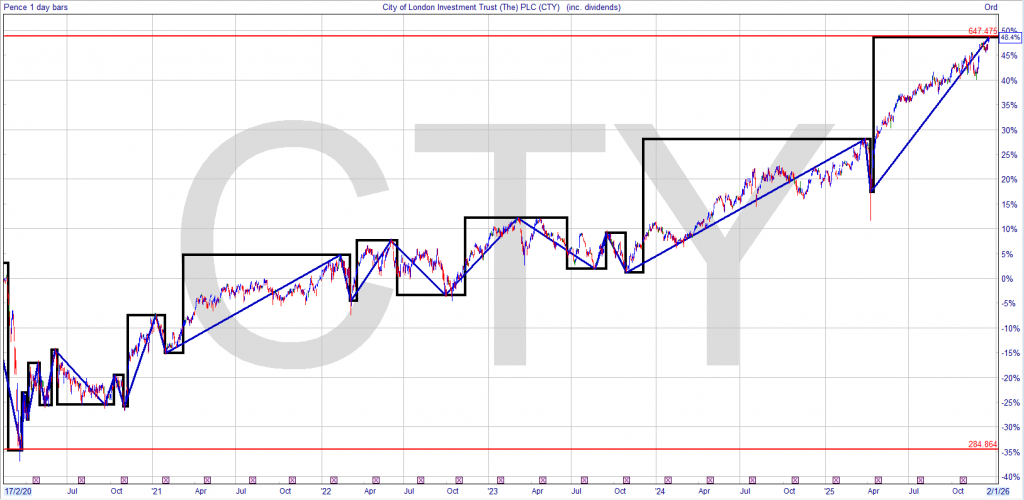
If you had bought under 300p after the covid crash the yield was 6.3%.
You decide as the price rose and the yield fell to re-invest the dividends elsewhere in your Snowball.
The current yield on your buying price is now 7% but the running yield is now 4%.
Without taking a very high risk, with your hard earned, you would have achieved the holy grail of investing, in that you can take out your capital and re-invest in a higher yielder and also receive income from a share that sits in your Snowball at zero, zilch, nothing cost.
You now have another share in your Snowball, providing income to re-invest and you would be on the way to
Once again Royal London Short Term Money Mkt Y Acc claims the top spot. The fund offers a “cash like” return through investing in very low-risk bonds that have short lifespans. Its dividend yield stands at 4.1%.
While the level of income money market funds are generating is attractive and ahead of inflation, bear in mind that yields will fall as and when UK interest rates are cut further. As our recent Bond Boss columnist pointed out, “cash is unbeatable for low volatility and minimal risk of drawdowns. But that safety comes at the cost of lower returns. Short-dated corporate bonds, by contrast, can offer a yield increase for only a slight increase in risk.”
which has proven very popular among ii customers over the past couple of years. It has raised its dividend ahead of RPI inflation every year since launch in 2013. That income consistency, a dividend yield of 10.8%, and a discount of -31.5%, are all attracting investors. This is despite notable losses of -18.2% and -20.5% over one and three years, and a small gain of 3% over five years, with its investment strategy rocked by UK interest rates rising from rock-bottom levels to peak at 5.25%.
As our recent feature explained, Greencoat UK Wind’s investment approach was recently hit by a curveball of proposals to change the inflation indexation of legacy subsidies. The changes would align indexation with Consumer Prices Index (CPI) instead of the Retail Prices Index (RPI), altering the terms of contracts that underpin billions of pounds of investment in wind, solar and other clean energy projects.
In fourth place is one of two new entries this week – Scottish Mortgage Ord SMT Its shareholders will be watching with interest regarding recent reports of SpaceX, Elon Musk’s space exploration company, possibly listing on the stock market next year. The private company is SMT’s top holding, and 8.2% of its assets. The trust holds 29% in private companies, with the remainder in publicly listed companies. Its aims to identify, own and support the world’s most exceptional growth companies.
In common with other renewable-focused trusts, its performance has been hit by higher interest rates. It is up 2.5% over one year, with heavy losses of -30.8% and -28.5% over three and five years. It is trading on a high dividend yield of 12%, while its discount stands at -40.9%. The trust has a continuation vote next year, with the board recently saying that it may not recommend the trust continuing in its current form.
and Artemis Global Income I Acc. The former mainly focuses on FTSE 100 dividend-paying companies, while the latter has a value-investing approach and a low weighting to the US, which only accounts for 25% of the portfolio.
Dropping out of the rankings are private equity trust 3i Group and global tracker Vanguard LifeStrategy 100% Equity.
Ian Cowie: my investment trust winners and losers in 2025
Our columnist discusses his best performers, the laggards, and stresses the importance of diversification.
18th December 2025 09:06
by Ian Cowie from interactive investor
Bad news in almost every TV bulletin might make even the most optimistic investor fear the worst for stock markets in 2026. But many “experts” were equally gloomy at the start of 2025 before share prices surprised on the upside.
For example, the average investment trust turned £1,000 into £1,103 over the year to date, the week before Christmas. That’s pretty good going when only £1,038 would have been needed to keep pace with inflation, as measured by the Retail Prices Index (RPI) in the year to November, as published on Wednesday (17 December).
Less happily, with scant sign of any Santa rally so far, the average investment trust shrunk the same starting capital into just £982 over the last quarter – or three-month period – according to independent statisticians Morningstar.
Never mind the generalities, your humble correspondent is very happy with the performance of the investment trusts in my “forever fund” over the last year and the last quarter. To be specific, no fewer than 13 of the 20 closed-end funds in which I have invested part of my life savings beat the annual average mentioned above; and 17 of them did better than the average over the last quarter.
The laggards
But it certainly wasn’t all sweetness and light, with wide variations in returns demonstrating – once again – the importance of diversification to diminish our exposure to the risk of capital destruction. Speaking of which, step forward Greencoat UK Wind
which suffered a perfect storm in 2025 to become my worst investment trust over the last year and last quarter.
This renewable energy infrastructure specialist shrank £1,000 on 1 January into just £838 over the year to date and £896 over the last three months. Ouch!
Gale-force headwinds that battered this £4.1 billion fund included rising costs, falling electricity prices and idiotic windfall taxes imposed by the Conservatives and maintained by Labour. There are even rising fears, fanned by folk who hate wind farms, that these turbines might not last as long as originally hoped in the very hostile environment of the North Sea.
where my hopes that the longstanding outperformance of the mega-cap or very big technology shares might trickle down to corporate tiddlers. On the contrary, JUSC turned £1,000 into £852 over the year.
was my third-worst investment trust in 2025. It failed to live up to its name and turned the same £1,000 starting capital into £896 by the week before Christmas.
The winners
But I don’t intend to sell any of the above, partly because of what happened at the other end of the performance spectrum this year. Polar Capital Technology Ord
a self-descriptive fund in which I have been a shareholder for more than a decade, continued to benefit from the artificial intelligence (AI) boom, boosting £1,000 on January 1 into £1,324 as I write.
did even better, finishing the year with £1,364 on the same basis, as it bounced back to some extent after a decade of capital destruction. To be fair, only the kindest-hearted shareholders in INOV are likely to restore its former “star fund manager” Neil Woodford to their Christmas card lists on the basis of its very partial recent recovery.
which is my most valuable investment trust and the fifth-biggest among 55 shareholdings in the forever fund, turned the same starting capital into £1,424. EGL’s diversified portfolio of electricity distributors and generators – including nuclear power – benefited from rising demand by AI data centres, among others.
turned £1,000 into an eye-stretching £1,529 during 2025. BRLA has bounced back after years of shrinking returns, as a collateral beneficiary of the trade war between America and China. The latter is buying more of the hard and soft commodities it needs from Brazil and less from the US.
Whether that is likely to continue remains uncertain, with the probabilities changing almost daily, alongside erratic pronouncements from the White House. While the mood swings of US President Donald Trump remain unpredictable, the last year showed investment trust shareholders how previously disappointing shares can still surprise on the upside.
None of us knows what will happen next year but 2025 demonstrated how our worst fears are rarely realised. Short-term stock market shocks need not prevent long-term shareholders from realising capital growth and income from a diversified portfolio of investment trusts.
Ian Cowie is a freelance contributor and not a direct employee of interactive investor.
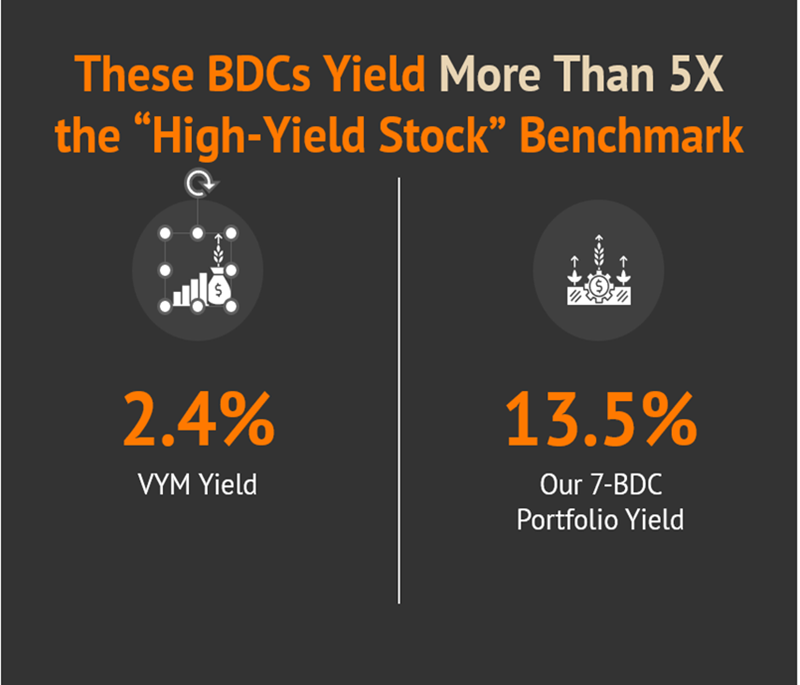
Life-Changing Dividends: 7 BDCs Paying Up to 19.6%
Brett Owens, Chief Investment Strategist Updated: December 19, 2025
The manic market has been dumping business development companies (BDCs) left and right. Let’s talk about a seven-stock BDC portfolio (yielding 13.5%!) that is poised to bounce back when sanity returns.
BDCs, which lend money to small businesses, are on the “outs” with the Wall Street suits after countless soft jobs reports. The spreadsheet jockeys fret about an unemployment-induced economic slowdown and miss the real story: small businesses are making more money than ever thanks to AI.
Here is what’s actually happening in the Main Street economy:
Employers—especially nimble small business owners—are implementing AI to streamline and even run their operations.
With AI tools, fewer humans are needed.
So, we are seeing soft jobs reports as companies rationally prioritize automation over human hiring.
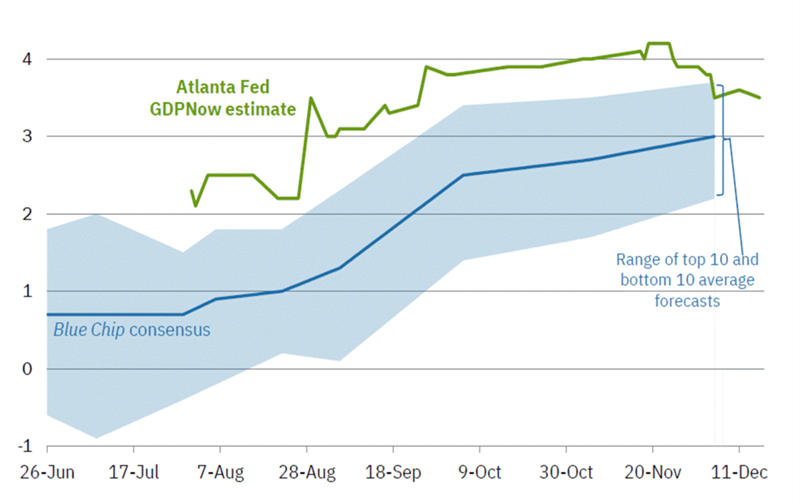
Small business profits are popping. While the unemployment numbers scream slowdown, the actual economy is booming. Check out the Atlanta Fed GDPNow’s most recent estimate—it’s solidly over 3%!
Atlanta Fed Says Economy is Cookin’
That’s no recession—it’s an efficiency boom! And a tailwind for this 13.5% portfolio:
Why not just buy any BDC fund?
It’s a competitive industry—one that creates more individual losers than winners. Buying a fund guarantees we own dozens of those losers.
We’re better off picking “the right” BDCs right now for the current interest-rate environment. BDCs tend to deal heavily in floating-rate loans. When the Fed cuts its target interest rate, it limits what BDCs can charge on those floating-rate loans, which lowers earnings.
But lower rates also bring lower financing costs for small businesses. This increases demand for new loans. Good for the BDC business. We’ll keep these forces in mind as we review seven BDCs paying us between 9.4% and 19.6%.
Sixth Street Specialty Lending (TSLX, 9.4% yield) is a standard-fare BDC. It prefers to invest in companies of between $50 million and $1 billion in enterprise value that generate between $10 million and $250 million in annual EBITDA (earnings before interest, taxes, depreciation, and amortization).
TSLX is pragmatic; it has an idea for its optimal deal partner, sure, but it also understands that they all can’t be gems. It’s pretty transparent about this fact, too, as we can see from this breakdown of some of its portfolio companies.
That portfolio is growing. While TSLX has hovered around 110 to 115 companies for the past few quarters, that number jumped to 145 as of Q3—the vast majority of which were structured credit investments that were smaller than the company’s typical deal size.
Sixth Street is also typical in that it primarily deals in first-lien debt (90%), most of which (96%) is floating-rate in nature. TSLX will feel the pinch as the Fed continues cutting rates.
But it’s also well-positioned to power through the pain. Sixth Street has frequently outpaced net investment income (NII) estimates, produced some of the best returns, and more-than-adequately covered the dividend. That dividend is a regular-plus-supplemental model, which has become increasingly popular among BDCs given rate uncertainty. Regular dividends account for most (8.4 points) of TSLX’s yield, with specials the remaining 1 point.
Sixth Street has long been one of the BDC industry’s best-run companies, and that shouldn’t change much despite a shake-up at the top. Current CEO Joshua Easterly will step down as CEO effective Dec. 31, 2025, to be replaced by Bo Stanley, who is currently serving as co-CEO. But Easterly will remain chairman of the board and continue to serve on TSLX’s investment committees.
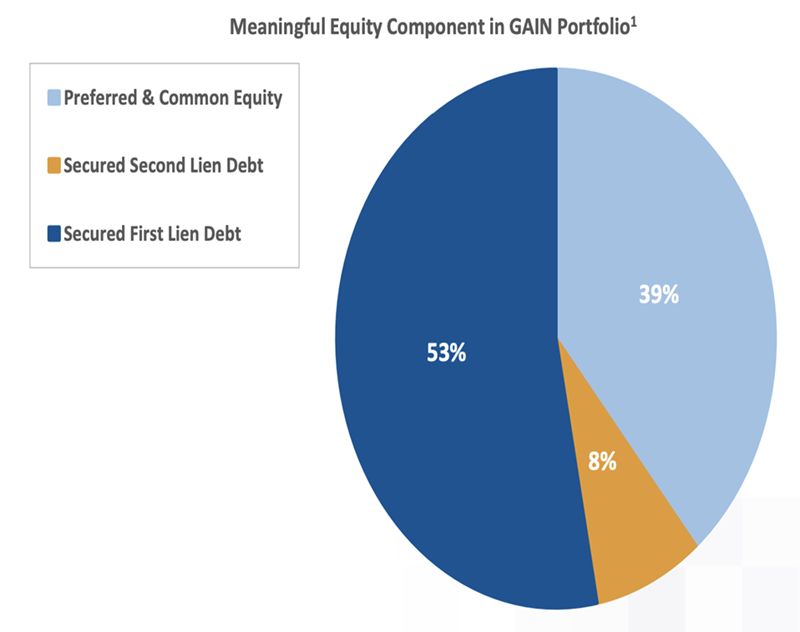
Gladstone Investment (GAIN, 10.8% yield) dishes a double-digit yield and a monthly dividend.
This BDC takes on lower-middle-market companies that generate EBITDA of between $4 million to $15 million annually, favoring firms with a proven business model, stable cash flows and minimal market or technology risk.
It’s an outlier in a couple of ways: a small portfolio, for one, at just 28 portfolio companies, but also a much bigger hunger for equity than the average BDC. Gladstone points out that BDCs traditionally have equity exposure of 5% to 10%.
Gladstone is less exposed to interest-rate moves. This supports GAIN’s “buyout” strategy. Gladstone Investment typically provides most (if not all) of the debt capital along with a majority of the equity capital. Its debt investments allow it to pay out a still-high regular dividend, but then it also pays out supplemental distributions when they realize gains on equity investments.
Those supplementals make up a large portion (about 3.8 points) of the yield, and they’re awfully variable. Gladstone Investment paid out $1.48 per share across five supplemental distributions in 2023, but then just 70 cents across 1 extra payment in 2024, and 54 cents in a single supplemental in 2025.
Recently, GAIN has been among the top BDCs we can buy. And yet, its valuation remains reasonable—the stock trades at a 3% premium to NAV.
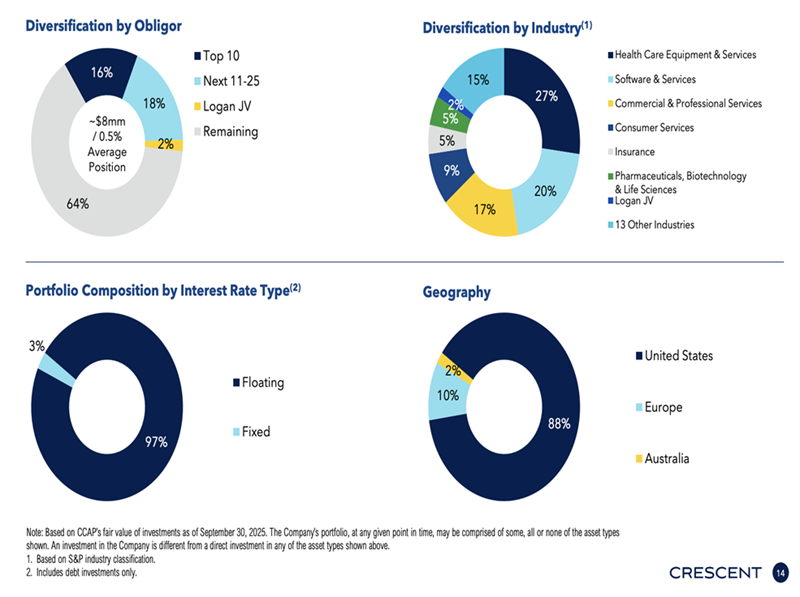
Crescent Capital BDC (CCAP, 12.3% yield), like many other BDCs, is paired with (and enjoys the resources of) a larger investment company—in this case, below-investment-grade credit specialist Crescent Capital Group. Its wide 187-company portfolio, which boasts a median annual EBITDA of about $29 million, spans 18 industries. We also get double-digit exposure to international companies (mostly Europe with a little Australia). It’s a diverse portfolio—but one that’s easily affected by Fed rate changes given that its deal mix is 90% first lien and 95% debt overall.
CEO Jason Breaux acknowledged the danger in the company’s most recent earnings conference call: “Looking ahead, we anticipate that a lower base rate environment may gradually reduce portfolio yields and place some pressure on net investment income.” But when pressed on the dividend, he added “I think for the immediate near term, we do believe that we are going to cover our base dividend with NII.”
But it still merits a close watch: A few analysts’ earnings estimates for 2026 fall below the dividend. That would help explain the stock’s current 23% discount to NAV, as would its 15% loss including dividends year-to-date.
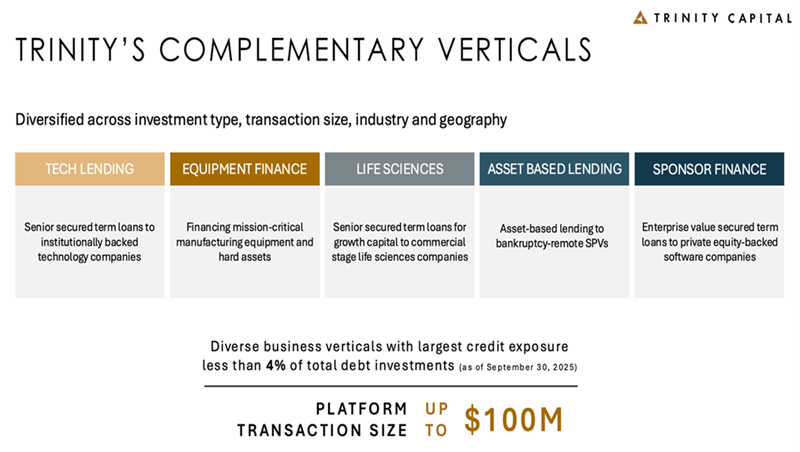
Trinity Capital (TRIN, 13.5% yield) is a growth-focused BDC with a bleeding-edge portfolio of 178 companies including the likes of quantum computing leader Rigetti Computing (RGTI), spaceflight safety firm Slingshot Aerospace, and 3D orthodontics firm LightForce.
TRIN is not only highly diversified in headcount, but also in how it does its deals.
Debt is still Trinity’s most prominent investment type, but at about three-quarters of the portfolio at fair value, that’s a smaller allocation than many other BDCs. (Equipment financings make up another 15%, with the rest filled out by equity and warrants.) Floating-rate is also a smaller-than-most share, at a little more than 80% currently.
Trinity is a lot like Sixth Street in that it’s an industry outperformer with good dividend coverage—and a premium valuation, at 14% more than its NAV right now. A silver lining? That’s less frothy than the 22% premium it commanded just a few months ago.
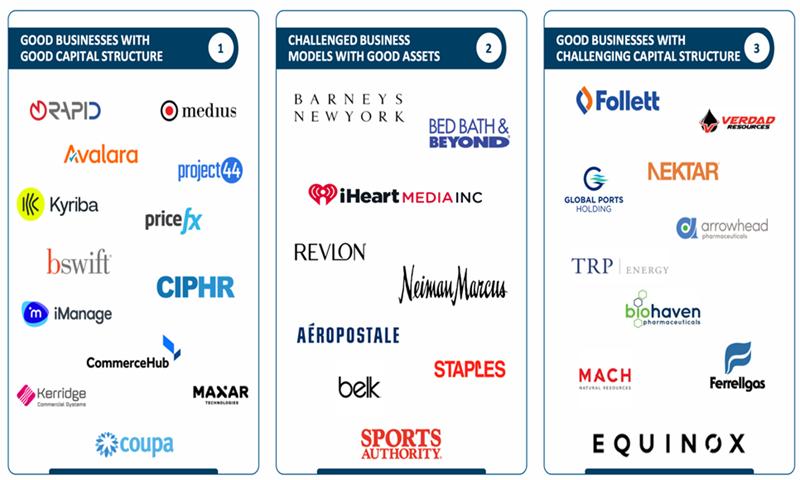
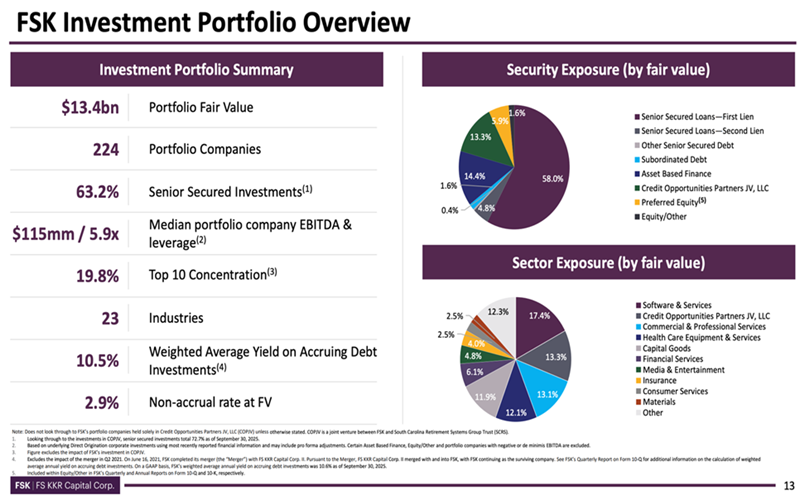
FS KKR Capital (FSK, 14.5% yield) is one of the largest publicly traded BDCs—a $4 billion business funder that can call upon the resources of its managers: alternative investment manager Future Standard and global private equity giant KKR (KKR).
Its portfolio spans 224 companies across 23 industries including software/services, health care equipment/services, commercial/professional services, capital goods, media and more.
This is an extremely diversified portfolio by investment type—debt, which is mostly senior secured (and a little less than 90% floating-rate), is just less than two-thirds of the portfolio at fair value, and it has significant positions in asset-based finance, preferred equity, common equity, and a joint venture, Credit Opportunities Partners JV.
FSK delivers one of the highest yields in the space and trades at one of the deepest discounts to NAV, at just 69 cents on the dollar. However, FSK would be yielding more if it weren’t for a deep dividend cut.
FS KKR had been paying out a 64-cent base and 6-cent supplemental for nearly two years. Until November, when the company announced a new quarterly distribution “strategy” for 2026 that targeted a 45-cent base. A 30% cut—yikes.
Much of FSK’s problem over the past few years has been bad loans. Non-accruals (loans that are delinquent for a prolonged period, usually 90 days) were a high 5% of the portfolio at cost. Perhaps the portfolio is now “falling out of the basement window” as this actually represents an improvement recently.
Goldman Sachs BDC (GSBD, 14.7% yield) also cut its dividend in 2025. GSBD’s clear draw is the ability to harness $270 billion global investment bank Goldman Sachs (GS). Its manager, subsidiary Goldman Sachs Asset Management (GSAM), prefers companies with annual EBITDA of between $5 million and $75 million. GSAM has built a portfolio of 171 such companies across a more concentrated dozen industries or so (including software at nearly 20% of the portfolio at fair value).
In fact, quality issues—namely high non-accruals (loans that are delinquent for a prolonged period, usually 90 days) and dropping net investment income (NII)—finally forced Goldman Sachs BDC to cut its regular dividend by nearly 30% in February.
Investors skated until recently, when GSBD cut its regular dividend from 45 cents per share to 32 cents starting in Q1. Still, this translates to a nearly 15% yield at current levels.
Goldman Sachs BDC has been a dog since COVID—so much so that its mid-teens yield and 8% discount to NAV don’t seem enticing enough. That said, keep an eye on its portfolio. GSBD continues to shed its legacy portfolio and has become much more aggressive in dealmaking of late.
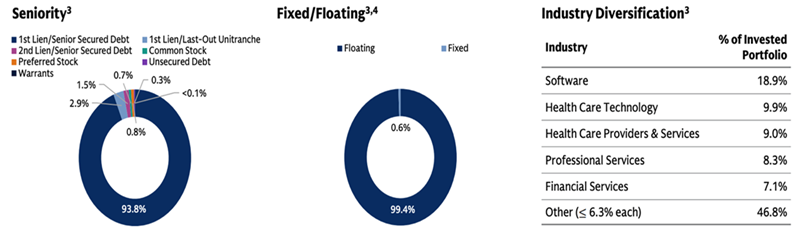
BlackRock TCP Capital Corp. (TCPC, 19.6% yield), managed by BlackRock (BLK) subsidiary BlackRock TCP Capital, invests in companies with enterprise values of between $100 million and $1.5 billion. It currently boasts 149 portfolio companies across more than 20 industries; debt is 90% of the portfolio at fair value, and 94% of those debt investments are of the floating-rate variety.
BlackRock TCP Capital says investments may include “complex situations requiring specialized industry knowledge.” That must be another way of saying “challenging,” which would explain TCPC’s struggles of late—since the start of 2023, TCPC has delivered a 30% loss with its massive dividend included while the BDC industry has returned a little more than 40%.
That massive dividend isn’t as big as it was a year ago, though. TCPC cut its dividend by 26% in early 2025, to 25 cents per share. Coverage was better, and it blunted some of that loss with a few specials from Q1 through Q3, but the company recently announced only the base dividend for Q4, which annualized would drop its dividend to closer to 17%. And further rate cuts could put that number in jeopardy.
If we wanted to gamble while BlackRock TCP Capital continues to exit its large non-accruals, we wouldn’t have to pay much to do so. TCPC has been on perpetual discount most of the year, currently priced at just 68 cents on the dollar.
My Can’t-Miss 11% Dividend for 2026
I love the diversification BDCs offer—I just don’t love some of the risk profiles I’m seeing right now.
But what if we could get this kind of diversification from a double-digit-yielding fund …
… that is also poised for stock-like gains in 2026 …
… and unlike these BDCs, it can’t wait for Jerome Powell (or the next Fed chair) to continue hacking away at interest rates?
But we launched this newsletter and our Monthly Dividend Paycheck Calendar income system because there are regular hardworking people looking for a steady income stream. Looking for something they can rely on. And we couldn’t have started too soon for some folks.
You see, contrary to what they try to tell us – the mainstream financial news, the government, the politicians – nothing’s changed for those of us looking for stable and steady income.
You and I both know it. Otherwise, you wouldn’t be a dividend investor.
Think about this for a moment: up until the financial crisis the conventional wisdom for retirement money was to put the bulk of your money in bond funds and CDs and live off the interest. Made sense when CDs were paying 5, 6, even 7%. Nice way to fund your retirement.
But that’s not the world we live in today even with recent Fed rate hikes.
What if the Fed Reverses Course to Raise Rates?
This is the second most common question I get from dividend investors through email and at speaking engagements.
I’ll share with you my response to that in two parts.
First, the Fed isn’t going to raise rates. Jobs numbers are lousy right now.
In fact, they just did the opposite recently and cut rates by a quarter point.
And second, today you’d be lucky to get much more than a 4% yield on a CD without having to tie up a tidy sum for a long time.
4%? Are they kidding us or just plain being greedy and rude?
Take your pick but either way that’s not even enough to cover inflation as we’ve experienced these past years, let alone let you “live off the interest” like so many of us were promised when we were younger.
And remember, that’s not going to change any time soon.
It’s only the last couple of years that we’ve seen the Fed finally raise rates for the first time since before the Great Recession and even then only modestly.
And you know what happened? The world didn’t end. Dividend stocks didn’t tank. And just recently the Fed decided to hold rates where they are… after dropping them 100 basis points in just the last half year.
Rates aren’t going back up any time soon. Period.
But let’s pretend they raise rates at every meeting for the next year and it’s not going to make one bit of difference for people like you and me. At least not for those of us who want passive income like we used to expect from CDs and bonds.
So the Fed raised rates a few times. Big deal. Are they looking for a pat on the back? Then they turned right around and lowered them… and then maybe they will raise them back up a bit. It’s just their way of trying to keep our economy from falling apart. But in the meantime they keep jerking savers around with yo-yo rates that at the end of the day don’t come near anything to provide income, let alone keep up with real inflation.
Post-COVID was the first series of serious rate raises in over two decades.
Why? Because just before COVID they couldn’t get inflation to go above 2% – to them inflation that’s too low is considered a bad thing, to those of us who shop for our own groceries it’s a completely different matter.
After COVID the economy was awash in extra dollars printed as stimulus checks and inflation was cranking like we hadn’t seen since the Carter years.
And since then they’ve paused then raised then paused and then raised a little and played the “wait and see” game. And then maybe they’ll raise them another 0.25% or maybe their drop rates by 0.25%. Who knows?
Let me spell it out: that quarter of a percent is 0.0025. And what has your bank raised CDs to? Back to the 5, 6, 7% we enjoyed a little before the 2008 crash? The kind of return you could actually live off of.
No, the banks raised them to still below 4%. And only begrudgingly. Can you live on 4% interest in a world where the cost of everything continues to go up?
And this will go on for years… maybe a decade or more.
Despite all the cheerleading, the Fed is too scared to do anything other than incremental rate tweaks of 0.0025… and with “wait and see” pauses between each rate change.
Frankly, it’s hard to imagine a day when we ever get back to those decent yields on CDs that we could live off the interest.
And worse, if you follow the news then you know that all of the talk is about cutting rates, not raising them.
We just have to face it: you’re never going to be able to go back to when you could park your money into CDs maturing in successive months (in banking terms this is called laddering) and take the cash out without so much as lifting a finger. I know that’s not what some people want to hear.
Growing up and even deep into our careers we were told to save our money, put it in CDs, and live off the interest. That’s what they told us… but that’s not an option now and it’s not coming back.
Sorry, but it’s the truth and I’m not the kind of guy to sugarcoat the truth. And the sooner we face up to the truth the sooner we can take action and do something about it… the sooner we can take control of our financial well-being.
And this is why the Monthly Dividend Paycheck Calendar is more important than ever.
You’re reading a free article with opinions that may differ from The Motley Fool’s Premium Investing Services.
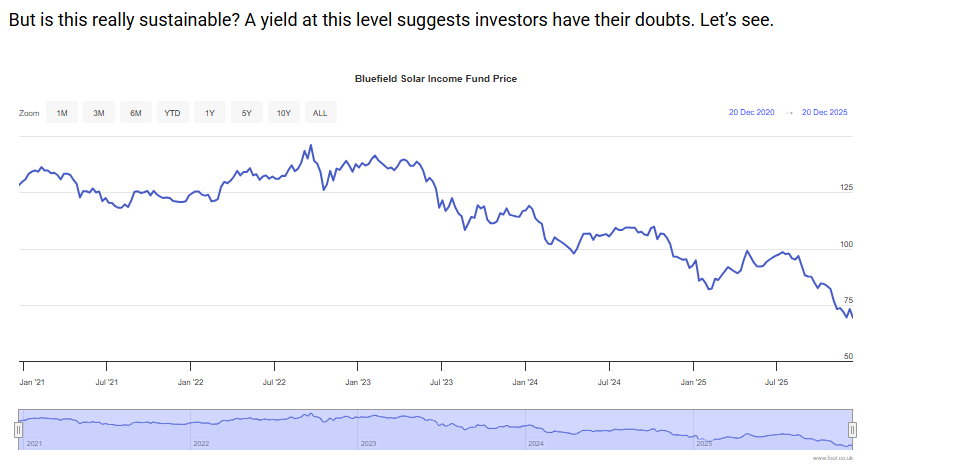
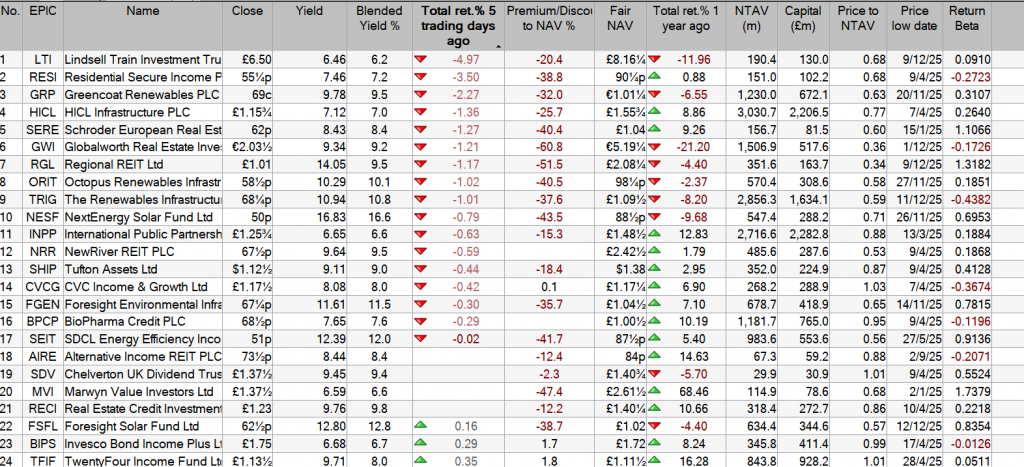
A £10,000 investment a year ago (17 December 2024) in Bluefield Solar Income Fund (LSE:BSIF) would have earned £955 in passive income over the past 12 months. But over this period, its share price has fallen by approximately a quarter.
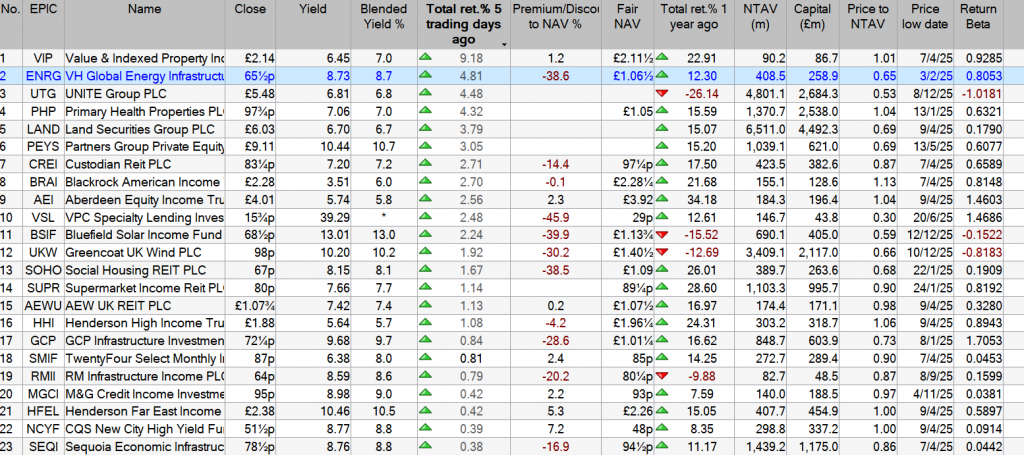
If it can maintain its payout for another year, it means those buying £10,000 of shares today would earn £1,322 (38% more) over the next 12 months. This implies a yield of 13.2%, the highest on the FTSE 250.
Should you buy Bluefield Solar Income Fund
A cause for concern?
If I was a shareholder, I’d be concerned about the drop in Bluefield’s market cap. However, based on its latest internal valuation, the fall appears unjustified. It now means its shares trades at a 40% discount to the fund’s net asset value.
In other words, if the business ceased trading today and sold off its assets and cleared its liabilities, there would be around 26p a share – equivalent to three times its annual dividend – to give back to shareholders.
I appreciated that valuing non-quoted energy portfolios can be difficult, but this is an enormous discount. Can the fund’s accountants be so wrong?
And because of the management team’s frustration that investors don’t appear to value Bluefield’s 793MW of renewable energy assets as highly as they do, they have engaged advisors to explore the possibility of selling the group. If successful, it would probably mean the shares are de-listed from the London Stock Exchange.
An uncertain future
But there are no guarantees that a buyer will be found.
That’s due, in part, to the UK government’s decision to launch a consultation on how renewable energy projects should be subsidised in the future. Although there are no changes proposed to current contracts, it has caused uncertainty within the industry and makes investing in the sector riskier than might otherwise be the case.
Also, a higher interest rate environment means investors can earn a reasonable return elsewhere. This has resulted in many shares in the sector falling out of favour. And for the company, it makes it more expensive to borrow, which limits opportunities to expand.
If a sale doesn’t go through, the trust’s share price could continue to drift lower. But if it’s able to continue its recent policy of increasing its dividend each year, the yield will go higher still. Of course, there can never be any assurances given when it comes to payouts.
Financial year (30 June)
Share price (pence)
Dividend per share (pence)
Dividend change (%)
Yield (%)
2021
121.4
8.0
+1.3
6.6
2022
131.0
8.2
+2.5
6.3
2023
120.0
8.6
+4.9
7.2
2024
105.6
8.8
+2.3
8.3
2025
97.2
8.9
+1.1
10.2
Source: London Stock Exchange Group/company reports
Final thoughts
But I reckon the Bluefield Solar Income Fund has plenty going for it. Most of its income (84% comes from PV assets) is secured by long-term agreements and, although there will be some variability depending on how often the sun shines, the UK weather is generally bright enough to help the fund earn revenue all-year round. And with the price it receives for a significant proportion of its output guaranteed, it should be able to predict its earnings with a reasonable degree of accuracy.
If a buyer does come forward, it’s hard to see how the directors can recommend selling the group for much less than its net asset value. I think it’s worth considering but not with the aim of a quick sale.
Using the Snowball’s comparison share VWRP, would have to increase to £475,000 if your plan is to use the 4% rule to fund your retirement.
Current value £151,385.00
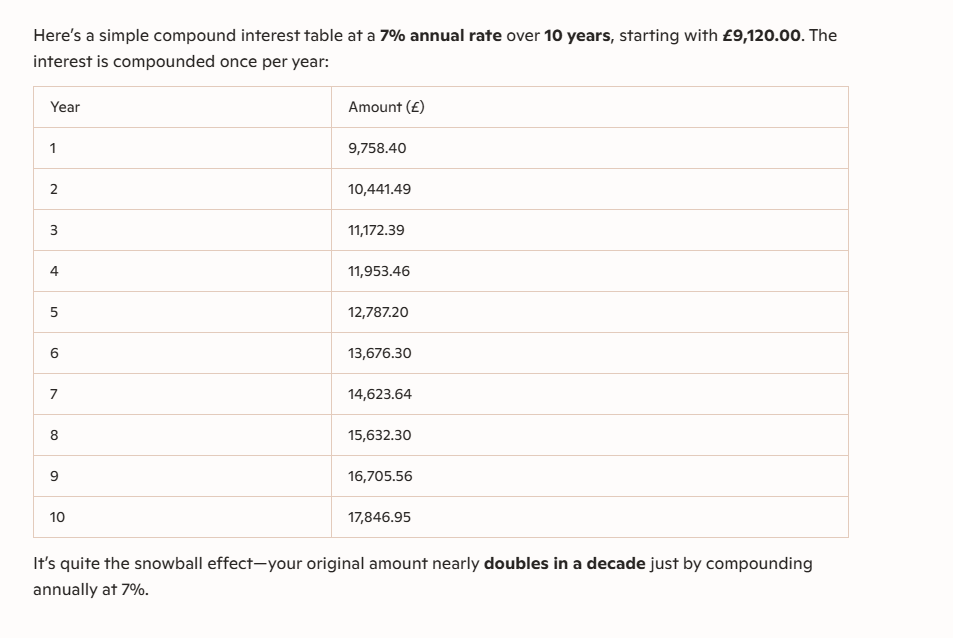
Remember the compound interest table only compounds once a year, the Snowball has an advantage in more shares are bought when dividends accrue to above 1k.
Get Rich Slowly: Life beyond the Magnificent Seven ?
Our investment specialist hunts for some alternative growth plays.
Jo Groves
Updated 14 Dec 2025
Disclaimer
This is not substantive investment research or a research recommendation, as it does not constitute substantive research or analysis. This material should be considered as general market commentary.
It’s getting to the business end of the year. The Budget is finally behind us, with a veritable advent calendar of 24 tax rises to open and savour or, as Kemi Badenoch put it, a smorgasbord of misery.
But it’s not all doom and gloom in the Kepler office. This year’s Christmas party features an inaugural guess-the-baby photo competition, sparking a few, erm, “safeguarding concerns” among those longer in the tooth. Thankfully, a few strategically-placed unicorns and emoticons have (just about) restored public decency.
Love is also all around on Regents Street, where we’re treated to a daily parade of influencers preening and pouting their way to TikTok glory from the central reservation. A strong contender for next year’s Darwin Awards for death-by-rotating-ring-light, or natural selection at its finest, depending on your inner Grinch.
Anyway, enough festive digression and back to the equally sparkling topic of my investment portfolio.
Time to stop the tech cavalry?
As we edge towards a new year, thoughts naturally turn to portfolio allocations (or maybe that’s a damning indictment on my social life?).
Top of my list (along with much of the planet) is whether the AI bubble will burst, pop or, well, just quietly deflate. Apparently, we can dial down the bubble-on-bubble anxiety, as searches for “AI bubble” have already burst (and that’s probably enough of the b-word for now).
Fears of an AI bubble are receding
Source: Google Trends
Given the US accounts for around 65% of the MSCI ACWI, I’m still meaningfully underweight at a quarter of my portfolio though not a complete anomaly (at least on the investing front). A recent Visual Capitalist study revealed that UK investors typically hold a third of their portfolio in US equities, a far cry from the near-80% exposure of American investors who are nothing if not a patriotic bunch.
In a recent podcast, veteran manager Terry Smith (who, it must be said, is more of a defensive-leaning chap) suggested that most investors own AI stocks simply because they’re going up, not because they’ve any idea how AI will actually play out. He may well have a point.
My tech exposure is via Landseer Global Artificial Intelligence, Fidelity Global Technology and, to a lesser extent,Alliance Witan (ALW) and Scottish Mortgage (SMT). NVIDIA (NVDA) is my only direct holding, which is up almost 50% or so in the 10 months I’ve owned it.
Interestingly, the elite tribe of Warren Buffett and besties seem to have no room at the inn for the world’s most valuable company. Microsoft, Alphabet, Meta, Amazon and Apple dominate their top tens (in that order), yet NVIDIA is conspicuously absent.
With full disclosure that I’m no algorithm-wielding quant wizard, here goes with my back-of-a-fag-packet sense check, ranking the Magnificent Six (I’ve excluded Tesla given its valuation defies earthly analysis) from most to least expensive, alongside some key metrics.Source: Financial Times & company accounts. Based on last financial year, trailing 12 month p/e ratio & the median of the 12-month share price analyst forecasts from FT data. Past performance is not a reliable indicator of future results.
NVIDIA may have the punchiest valuation but it’s also delivered almost double Microsoft’s revenue growth, wins hands-down on margins and its latest quarterly net income even beats the combined revenue of rivals Intel and Broadcom. Admittedly all rear-view mirror stuff but it could still have legs with the highest share price forecast amongst the group.
However, when you’re sitting pretty on a quasi-monopoly and your training rigs cost the GDP of a small nation, there’s undoubtedly a very large target on your back. Meta’s recent tie-up for Google chips is a reminder that even old rivals can find common ground when there’s enough zeroes at stake.
So what’s the takeaway for NVIDIA? Its priced-for-perfection valuation does suggest caution, even if bull markets supposedly climb a wall of worry. As Smith warns, a cooling of AI hype could see NVIDIA tumble 80%, which may explain why the super investors are parking their chips in the more diversified mega-caps. That said, I’m happy to hold for the longer term even if there’s near-term pain ahead.
Do you hear what I hear?
For once I’m not banging on about undervalued UK equities and instead casting a critical eye over my alternative growth plays for 2025 when tech valuations felt a bit toppy.
First on my shopping list was International Biotechnology (IBT) in December 2024. On the back of political headwinds clearing and interest rates falling, the biotech recovery is in full swing, with IBT chalking up a stellar 60%-plus return in the last six months.
Managers Ailsa Craig and Marek Poszepczynski have an impressive track record of uncovering the best opportunities across the sector, with a particularly high hit rate on the M&A front. And if you’d like to find out more about the outlook for biotech, have a listen to ourrecent podcastwith Ailsa.
Next up was Asia: with more than double the number of listed companies of the UK, Europe and the US combined, I’ve opted for the on-the-ground, big-hitting resources of Schroders and BlackRock.
Asia isn’t often seen as a typical income play butSchroder Oriental Income’s (SOI) five-year return of 65% not only tops the AIC Asia Pacific Equity Income sector but is more than double the highest-returning fund in the Asia Pacific sector too. Proof that income doesn’t need to come at the expense of growth, with manager Richard Sennitt showcasing the merits of a steady hand on the tiller in a heterogeneous universe.
Stablemate Schroder Japan (SJG)was added in February to plug the gap in my Asian exposure. There’s plenty going for Japan, from corporate governance reform to rising household income, and SJG’s small and mid-cap tilt has served it well this year, underpinning a one-year return of more than 20%.
Last on the list was BlackRock Frontiers (BRFI) with manager Emily Fletcher gracing our October Market Matters podcast. Emerging markets tick the box on the growth front but are increasingly resembling a Magnificent Seven proxy play given the dominance of the likes of TSMC, Tencent and Alibaba. BRFI avoids the eight largest emerging markets entirely, offering genuine diversification away from both US tech and EM heavyweights.
So how did my picks fare as alternative growth plays to the S&P 500? Well, IBT took top honours with more than four times the S&P 500 return but all the other funds have comfortably outperformed too. Bubble or no bubble, perhaps there is life beyond the Magnificent Seven after all.
My growth picks have all beaten the S&P 500
Source: HL & FE Analytics (as at 08/12/2025. Returns based on the date of purchase to the current date. Past performance is not a reliable indicator of future results.
And, finally, may the only bubbles you need to worry about this festive season be the ones in your glasses. Here’s to a jolly Christmas and we hope you join us for more portfolio ponderings in the new year.
All numbers as at 08/12/2025 unless stated otherwise, returns based on share price total returns.