Investment Trust Dividends

Author: admin (Page 43 of 447)

Is the biggest stock market crash since the dot com bubble coming?

Story by Alan Oscroft

Santa Clara offices of NVIDIA

Santa Clara offices of NVIDIA

Headlines are increasingly pushing the risk of a stock market crash. So let’s check out the reasons, why we shouldn’t panic, and what we might consider doing about it all.

Over in the US, the S&P 500 has risen 25% in 12 months. The market has been climbing sharply since late 2023 on the back of, yes, the surge in artificial intelligence (AI).

AI stock boom

And here’s the really scary thing. One single stock accounts for 9% of the entire value of the S&P 500 right now. And I’m sure you’ve guessed which one — yes, chip maker Nvidia. Nvidia now has a market cap of a shade short of $5.5trn.

Some illuminating perspective on that might be handy for UK eyes — Nvidia alone is worth around twice the value of all our FTSE 100 companies put together. Illuminating? That’s practically blinding.

Meanwhile, Google’s parent Alphabet has seen its market cap rise to $4.7trn. Between the two, they’re worth more than three and a half Footsies.

Why does Burry Worry?

It’s feeling like the last months of the 1999 — 2000 bubble

— Michael Burry

Hedge fund manager Michael Burry recently told us all he could hear on financial radio on a long driving trip was “absolutely non-stop AI“.

He famously predicted the 2008 financial crisis — and made a packet from it. The founder of Scion Asset Management, he was played by Christian Bale in the film adaptation of The Big Short.

Reasons to be cheerful

We’re relatively isloated from the AI surge here in the UK. Our little FTSE 100 index is on a trailing price-to-earnings (P/E) ratio of 16, with a forecast ratio of 14 based for the next 12 months. That’s pretty much bang on its long-term average.

While I expect a US market crash would give UK shares a shake too, I see enough safety margin to provide resilience.

UK shares recovered from the 2020 pandemic crash impressively fast. And I really can’t see a possible slump in 2026 being anywhere near as painful as that.

What can we do?

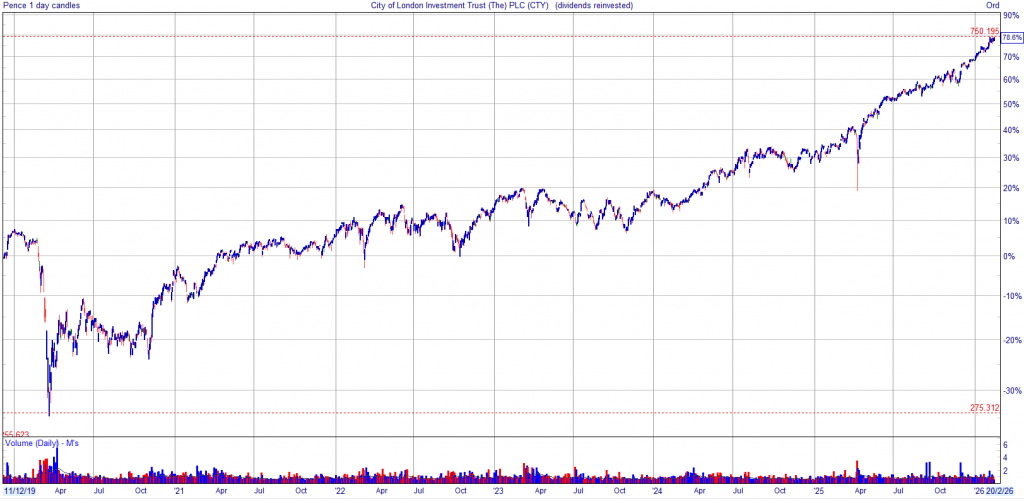
I think investors should consider putting a portion of their Stocks and Shares ISA cash into a diversified investment like City of London Investment Trust (LSE: CTY).

The share price is up 40% over the past five years — slightly behind the FTSE 100’s 45%. And we’re looking at an expected dividend yield of 4% — with the index on a forecast 3.3%. Crucially, City of London has raised its dividend every year for 59 years in a row!

If we don’t see a rise one year, I’d expect some share price fallout. And it’ll never be foolproof against a stock market crash.

But I reckon holding an investment trust like this, with widely diversified UK holdings, for the long term could help us worry less about short-term ups and downs. And then look to snap up bargain buys if there is a crash.

Alan Oscroft owns shares in City of London Investment Trust.

The post Is the biggest stock market crash since the dot com bubble coming? appeared first on The Twelfth Magpie.
27/02/26

At a buying price of 300p the current yield would equate to 7%. You do not need to take big risks with your hard earned, you need a plan and to stick to your plan.

What’s your plan ?

A stock market crash could help you retire years early. The reason’s simple

Will the next crash wreak havoc with your retirement plans — or bring them forward? Our writer explains how plunging prices can help someone retire early.

Posted by

Christopher Ruane

Published 16 May

MNG

Thoughtful man using his phone while riding on a train and looking through the window
Image source: Getty Images

What would a stock market crash mean for your portfolio? Some people worry it could mean they have to work even longer. However, a crash can actually help a well-prepared investor retire early – even years earlier than planned.

Focusing on what, not when

I do not know when the market will next crash. Nobody does. But what is clear from history is that, sooner or later, it will.

Rather than fixating on when that might happen, I think a more productive use of an investor’s time now can be getting ready by deciding what to do when it does.

After all, it could open a big window of opportunity. It might not last long, so readiness is key.

Buying great shares at bargain prices

It helps to understand what is going on when the stock market crashes. Typically, there is some proximate cause, or causes. The underlying prospects of a sector may have changed, for example.

Take the 2008 financial crisis as an example. Banking shares nosedived – and for good reason. The prospects for the sector suddenly looked much worse than before.

So while Lloyds’ shares have almost doubled in the past five years, they are still 68% below their 2007 peak (which in turn was already far below where the share stood back in 1999).

But a crash can often send down the price of shares whose underlying business prospects seem largely unchanged – and that can be an opportunity.

Used the right way, it can even be an opportunity that ultimately helps the savvy investor retire early.

Same dividend, different share price = different yield

That is because of the difference in dividend yield a share offers depending on the purchase price.

Take asset manager M&G (LSE: MNG) as an example. It currently pays 20.5p a year in dividends. It aims to grow that amount annually and has been doing do, though no payout is ever guaranteed.

The current share price of M&G means that someone buying today can earn a yield of 6.7%. That is already tasty and well over double the FTSE 100 average.

But someone buying in the March 2020 stock market crash paid much less for M&G shares. The share price has risen 175% since, making for a tidy capital gain.

What about dividends though? The simple arithmetic of dividend yield means that someone buying into M&G at that far lower price in 2020 would now be earning a yield of over 18%.

Compound a retirement portfolio at 6.7% and it will take 11 years to double in value. By contrast, compounding it at 18% annually should mean it doubles in just five years.

Here’s how I’m preparing now!

I still think M&G is an attractive business. It has millions of customers, a strong brand and proven cash generation potential underpinning that above-average yield.

But there are risks too. I fear current market instability could see investors withdraw more from M&G funds than they put in, eating into earnings.

I think M&G merits consideration even now. But if I could buy a diversified range of blue-chip shares like it at much lower prices during a market crash, that could potentially give me the opportunity to retire early.  

C Ruane has no position in any of the shares mentioned. The Motley Fool UK has recommended Lloyds Banking Group Plc and M&g Plc. Views expressed on the companies mentioned in this article are those of the writer and therefore may differ from the official recommendations we make in our subscription services such as Share Advisor, Hidden Winners and Pro

Whilst if your plan is a TR plan, a stock market crash is the worst case scenario, unless you are in the early years of investing.

To benefit from a market crash and invest at a market beating yield, you can either sell shares in your Snowball if they haven’t fallen as far as the market, or have a cash equivalent share to sell and re-invest.

Remember there is no way of knowing when the market has finished falling so you have to be content with the buying yield.

Across the pond

I just bought this high-quality S&P 500 AI stock for my ISA while it’s down 23%

This high-quality S&P 500 AI stock has pulled back in recent weeks. And Edward Sheldon has capitalised on the weakness, adding it to his ISA portfolio.

Posted by

Edward Sheldon, CFA❯

Published 19 May

ANET

Finger clicking a button marked 'Buy' on a keyboard
Image source: Getty Images

S&P 500 technology stock Arista Networks (NYSE: ANET) has been a brilliant investment in recent years, rising more than six-fold. However recently, it has pulled back a little.

Given this pullback, I decided that it was time to buy a few shares for my ISA. Here’s why I bought it.

A new growth stock for my ISA

Arista Networks is a leading provider of cloud networking solutions. It specialises in switches (boxes full of ports) that can move vast amounts of digital information between servers at lightning speed and also offers a network operating system.

Today, its products are used by all the big cloud companies (AmazonAlphabet, etc). For these companies, Arista’s solutions help them manage massive amounts of data with low latency and high reliability.

Source: Google Finance

Why did I buy it now?

As for why I bought it, there are a few reasons. One is that recent Q1 earnings (which the wider market was unimpressed with) looked pretty good to me.

For the quarter, revenue was up 35% year on year to $2.7bn. Meanwhile, non-GAAP earnings per share were $0.87 versus $0.66 a year earlier.

Arista is off to a strong start in Q1 2026.
Jayshree Ullal, Chairperson and CEO of Arista Networks

Notably, numerous Wall Street analysts increased their price targets for the stock after the earnings report. Some firms went to $200 (more than 40% above the share price when I bought it).

So, it struck me that there was a disconnect between analyst sentiment and the share price action. I decided to capitalise on this.

An AI capex beneficiary

Another reason is that I expect the strong growth here to continue in the medium term as hyperscalers spend big on AI. After spending over $700bn this year, analysts believe that these tech firms could be set to spend over $1trn next year.

This should benefit Arista because as I said above, its products are used by all the big cloud companies.

A high-quality business

I’m also attracted to the quality of this company. This is a business that’s very profitable.

Over the last five years, return on capital employed (ROCE) has averaged 27%. Companies that have high ROCEs and a source of growth tend to be good long-term investments.

How’s the valuation?

Finally, I could justify the valuation. When I bought, the forward-looking price-to-earnings (P/E) ratio using next year’s earnings forecast was in the low 30s.

Now, obviously that valuation is still high. And it adds risk for me.

If revenue growth slows, the shares are likely to underperform given that lofty earnings multiple. And it could slow – hyperscalers may decide to pull back on data centre spending.

Taking a three-to-five year view, however, I’m excited about the potential here. I believe this stock is worthy of further research.


Edward Sheldon has positions in Arista Networks, Amazon, and Alphabet.

The SNOWBALL

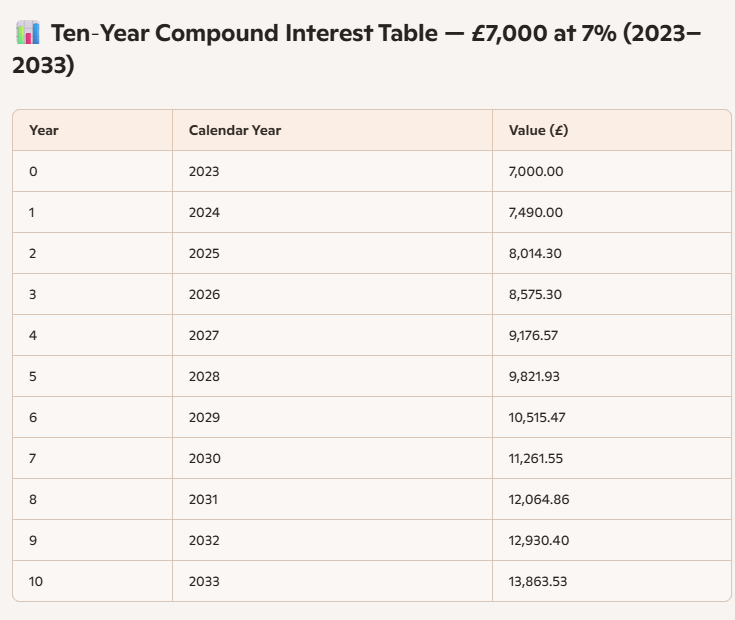
With only one share left to declare a dividend for the first six months of the year, the income for the SNOWBALL will be £7,653, with a year end figure of around £13,189

Whilst there is a lot of water to flow under a lot of bridges before the end of 2027, it would be great if the fcast would be £13,863, whilst possible it’s most probably unlikely.

RGL

Regional REIT Ltd – Q1 2026 Trading Update & Dividend Declaration

REGIONAL REIT Limited

Q1 2026 Trading Update & Dividend Declaration

Regional REIT Limited (LSE: RGL), the regional commercial property specialist, announces the following trading update for the period from 1 January 2026 to 31 March 2026 and a dividend declaration for the first quarter of 2025 of 2.0 pence per share.

Stephen Inglis, Head of ESR Europe LSPIM Ltd., Investment Adviser commented:

“Market conditions remain challenging, but we continue to deliver on our repositioning strategy, executing targeted disposals to strengthen the balance sheet while further improving the quality of our portfolio via our capex programme.

During Q1 2026, we undertook six sales generating proceeds of £12.6m, with a further three disposals totalling £2.5m completed post quarter end, all were close to their 31 December 2025 valuations and in aggregate c. 90% vacant. These disposals were largely from the sales segment of the portfolio where refurbishment would not have generated sufficient returns on the capital deployed. The LTV was further reduced at the end of Q1 2026 to 39.4% (2025: 40.4%).

The company completed 26 new lettings and renewals in the quarter, adding £1.1m to the rent roll. These lettings were secured at 9.8% above ERV, building on the 9.0% above ERV delivered in Q4 2025, underscoring rental growth created by continued demand for well-located, high-quality space and the effectiveness of our active asset improvement plan.

The increase in rents being achieved is indicative of our view in respect of the structural supply and demand imbalance in the provision of high quality and well-located regional office space that conform to EPC A and B, and this will become increasingly evident.

Our portfolio is currently well positioned with 61.1% already EPC B or better. Grade A vacancy across key UK regional markets remains tight at c.3-5%, with a constrained development pipeline and best‑in‑class space accounting for the majority of leasing activity*. This dynamic continues to support a broader ‘flight to quality’ and underpins our medium-term outlook.”

* Knight Frank Office Market Annual Review 2025

Portfolio update

·    110 properties, 1,075 units and 653 tenants, totalling c.£543.1m** of gross property assets value (31 December 2025: £555.2m)

·    26 lettings to new tenants and renewals/regears in the period across 113,885 sq ft delivering £1.1m of annualised rental income, an uplift of 9.8% against ERV

·    Rent roll of £49.8m (31 December 2025: £50.4m); ERV £75.0m (31 December 2025: £77.0m)

·    EPRA Occupancy for the Core segment portfolio 87.0% (31 December 2025: 86.5%) – reflecting stable Core occupancy

·    EPRA Occupancy (by ERV) 75.5% (31 December 2025: 75.9%); 31 March 2026 like-for-like 75.6% versus 31 March 2025 78.9%

·    Total rent collection for the quarter as at 15 May 2026 98.5% compared with 97.9% for the equivalent period in 2025

·    Post quarter end a further 7 new lettings and renewals/regears have been achieved across 50,828 sq ft providing £0.9m of annualised rental income, at 3.0% above ERV

Maintaining balance sheet discipline while pursuing updated strategy

·    Disposals in the period amounted to £12.6m (before costs) (2 properties and 4-part sales), reflecting a net initial yield of 4.0%

o Post quarter end, a further 1 disposal and 2-part sales completed totalling £2.5m (before costs).

o The current disposal programme comprises of 36 sales totalling c. £89.5m, though not all are expected to complete in 2026

·    Net capital expenditure £0.8m (Full year 2025: £11.8m) – continued focus upon the capital expenditure programme

·    Cash and cash equivalent balances £40.3m (31 December 2025: £37.7m)

·    Net loan-to-value ratio reduced to c. 39.4%** (31 December 2025: 40.4%)

·    Gross borrowings £254.5m (31 December 2025: £266.2m)

·    Group cost of debt (incl. hedging) 3.4% pa (31 December 2025: 3.3% pa)

**Gross property assets value based upon Colliers International Property Consultants Ltd. valuations as at 31 December 2025, adjusted for subsequent acquisitions, disposals and capital expenditure in the period.

Q1 2026 Dividend Declaration

The Company declares that it will pay a dividend of 2.0 pence per share (“pps”) for the period 1 January 2026 to 31 March 2026, (1 January 2025 to 31 March 2025: 2.50pps). The entire dividend will be paid as a REIT property income distribution (“PID”).

Shareholders have the option to invest their dividend in a Dividend Reinvestment Plan (“DRIP”), and more details can be found on the Company’s website.

The key dates relating to this dividend are:

Ex-dividend date28 May 2026
Record date29 May 2026
Last day for DRIP election19 June 2026
Payment date10 July 2026

The level of future payments of dividends will be determined by the Board having regard to, among other factors, the financial position and performance of the Group at the relevant time, UK REIT requirements, the interest of shareholders and the long-term future of the Company.

Forthcoming Events

19 May 2026Annual General Meeting
8 September 2026Interim Results Announcement
12 November 2026Q3 2026 Trading Update

Note: All dates are provisional and subject to change.

Across the pond

Too Good to Be True? No Way. This 9.4% Dividend Is 15% Off

Michael Foster, Investment Strategist
Updated: May 18, 2026

Stocks are up, and the media is finally coming around to what we’ve been saying at my CEF Insider service for months now.

Last week, The Economist wrote a breathless piece about how the US economy is firing on all cylinders—and fears that a recession will sideswipe stocks are just plain wrong.

We’re happy to see a leading publication like The Economist come around on this point, of course. Even better, we now we have the data to prove it:

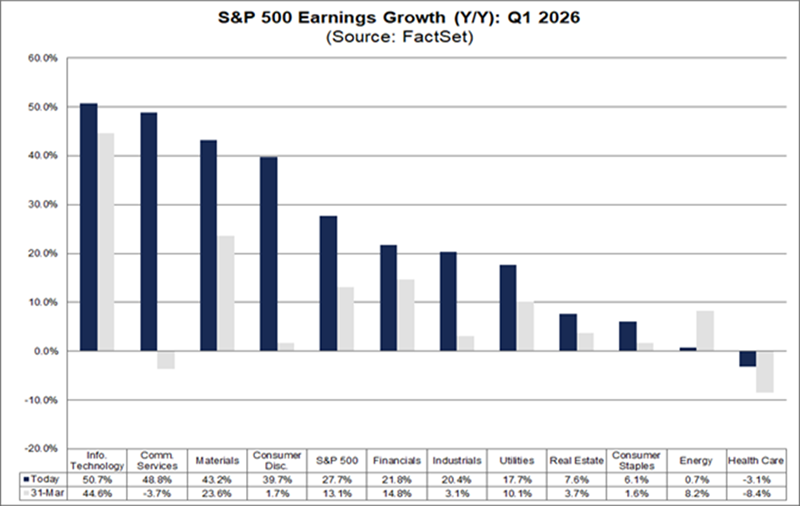
Across the board, the S&P 500 saw a 27.7% earnings gain in the first quarter. That’s shocking when, historically, profits have risen in the 5% to 8% range.

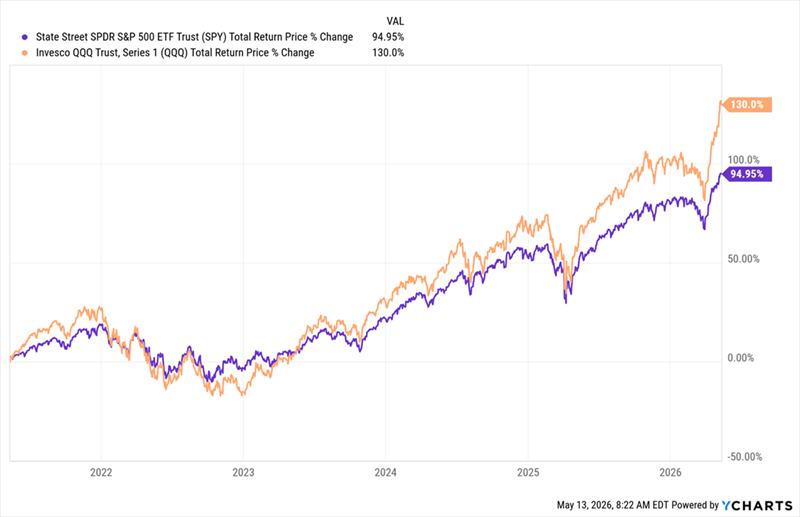
So it should come as no surprise that the S&P 500 benchmark  State Street SPDR S&P 500 ETF Trust (SPY) has gained nearly 9% this year, as of this writing. It should also be no surprise that the tech-focused NASDAQ, as tracked by the Invesco QQQ Trust (QQQ), is up around 15%. The numbers tech firms are putting up are nothing short of jaw-dropping:

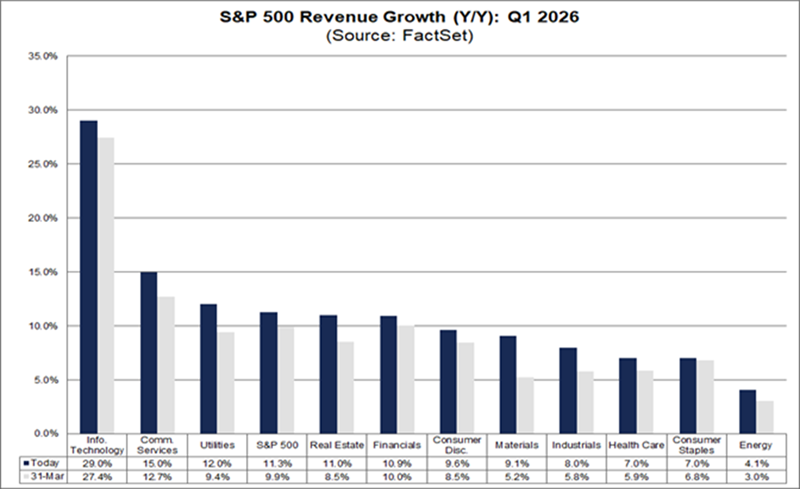
Take IT, where earnings are up 50% from a year ago, while sales (shown in the chart above) have spiked 29%. Communication services, which includes companies like Alphabet (GOOGL) and Meta Platforms (META), has also seen profits pop 48.8% on 15% higher revenue.

These big gains should put an end to bubble fears: They clearly show that the market’s strength is backed by profit and sales growth. And that’s before we talk about stock valuations, which give us one of the clearest indications this market is not in a bubble:

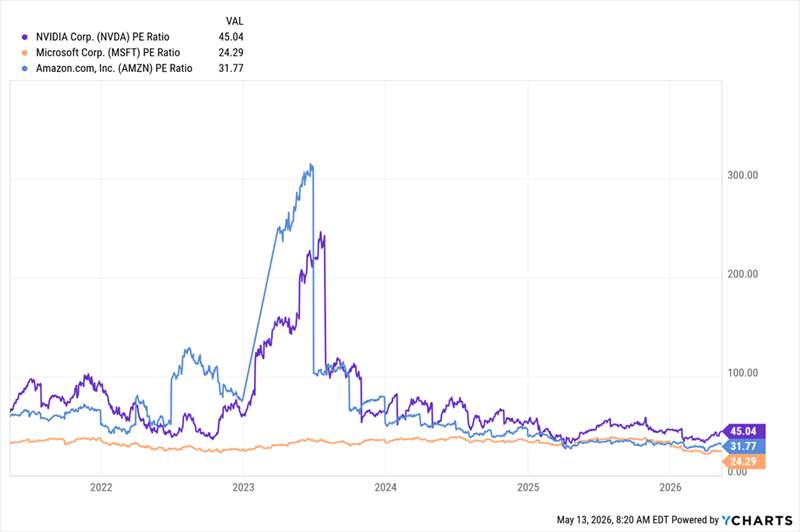
Earnings Pop, Valuations Drop

Here are the price-to-earnings (P/E) ratios of three of the biggest public companies in the AI world over the last five years: NVIDIA (NVDA), in purple; Amazon.com (AMZN), in blue; and Microsoft (MSFT), in orange.

While these stocks have what might be considered “high” P/E ratios compared to the market average, those ratios aren’t skyrocketing. Indeed, they’re falling as earnings rise and investors take a more rational view of these companies.

In fact, the chart above shows us that the “bubble” really occurred in 2023, and it didn’t pop. It slowly deflated, thanks to earnings rising, rather than prices falling.

Too Late? No Way. This Run Is Just Getting Started

Of course, looking at stocks’ gains lately, you might feel it’s too late to buy. That’s understandable. But let’s take a closer look at what’s happened in the last five years, with SPY again in purple and QQQ in orange:

Big Gains, Most of Them Recent

The recent jump in stocks is partly due to fresh AI-driven productivity gains—that’s the spike on the right side of the chart. But if we strip out that pop, what we really see is a rational recovery from the irrational 2022 selloff, not a bubble.

The 9.4%-paying closed-end fund (CEF) we’re going to talk about next is the perfect way to take advantage of this situation. It comes our way at a discount that should go a long way toward easing any bubble fears you may have. But there’s more to this high-yielding investment vehicle than just that.

The 9.4% Dividend Play

I’m talking about a CEF called the Neuberger Berman Next Generation Connectivity Fund (NBXG).

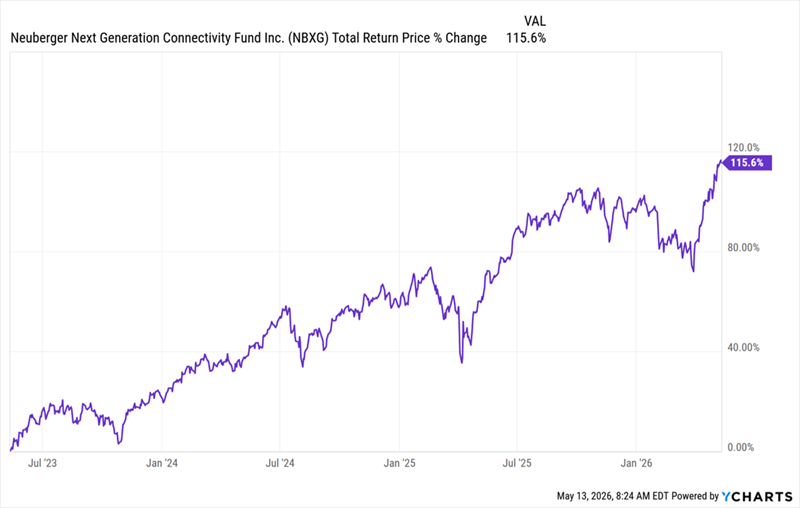
NBXG, as the name suggests, holds tech stocks. Its top holdings include Meta, Amazon, Microsoft, Taiwan Semiconductor (TSM) and NVIDIA. That tech lean has resulted in a triple-digit total return in the last three years:

NBXG’s Strong 3-Year Run

This is a much better proposition than buying an index fund like SPY, which yields around 1% now. NBXG, with its 9.4% payout, cuts the need to sell into a downturn if you need to tap your investment for cash. That’s our first reason why we see this fund as attractive now, even if you’re worried you’re late to the party. The second reason is more important, and more subtle.

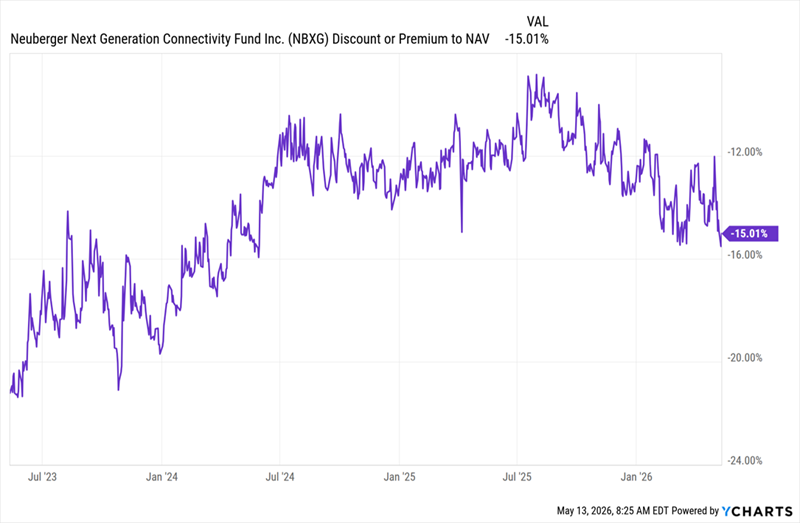
NBXG Gets Cheaper—Even as It Surges

As we saw with individual tech stocks above, NBXG is getting cheaper, going by its discount to net asset value (NAV—the key valuation measure for CEFs) while it delivers bigger returns. Except here, the effect is more pronounced.

With a 15% discount, we’re getting NBXG’s portfolio for 85 cents on the dollar. That gives us more upside potential and more downside insulation if the market hits a speed bump. It also means the fund’s 9.4% dividend is very sustainable (and positioned to grow).

Here’s why: As I just mentioned, NBXG yields 9.4%. That’s calculated on the CEF’s per-share market price. But remember that this price is discounted 15% from NBXG’s NAV, or its portfolio value.

If you calculate the fund’s yield on NAV, you get a much lower number: around 8%. This means management needs to earn 8%—a much lower bar than 9.4%—to keep the payout steady.

NBXG’s return in the last three years is far more than enough to do that. In fact, its return is so large that it puts another dividend hike on the table (after management already raised the payout 20% with the October 2025 payment).

That potential payout hike caps off a solid package: An investor buying NBXG today gets a portfolio of stocks with rising sales and profits, held in a fund that growth “translates” that into a 9.4% dividend (paid monthly). All of this comes at a discount, to boot.

Top 10 funds and trusts in ISAs


Company Name
Place change
1Royal London Short Term Money Mkt Y Acc
2Scottish Mortgage Ord SMT0.00%
3Polar Capital Technology Ord PCT1.86%
43i Group Ord III5.79%
5Vanguard FTSE Global All Cp Idx £ Acc
6Artemis Global Income I Acc
7HSBC FTSE All-World Index C Acc
8Vanguard LifeStrategy 80% Equity A Acc
9L&G Global Technology Index I Acc
10Seraphim Space Investment Trust Ord SSIT2.88%

Investors are liking the look of troubled private equity behemoth 3i Group Ord 

III after a fresh sell-off, propelling it back into our bestseller list.

The trust’s shares have been on a downward trajectory since late last year thanks to softening sales growth and US expansion plans for its main holding, discount retailer Action.

A trading update last week confirmed continued problems in Action’s main market France and more widely, prompting a fresh sell-off. That lower price, and the trust’s hefty discount, continues to draw in buyers.

We otherwise see a huge amount of continuity in the latest bestseller list.

The top three names, Royal London Short Term Money Mkt Y AccScottish Mortgage Ord  SMT and Polar Capital Technology Ord PCT maintain their positions from last week, while Artemis Global Income I Acc stays in the sixth spot.

A handful of diversified tracker funds and the L&G Global Technology Index I Acc remain in the top 10. Seraphim Space Investment Trust Ord  SSIT

 also stays in the list but drops all the way down to the bottom, while renewables play Greencoat UK Wind drifts out to 11th place.

Funds and trusts section written by Dave Baxter, senior fund content specialist at ii.

XD Dates this week

Thursday 21 May

JPMorgan Global Growth & Income PLC ex-dividend date
JPMorgan UK Small Cap Growth & Income PLC ex-dividend date
Murray Income Trust PLC ex-dividend date
Scottish American Investment Co PLC ex-dividend date
Town Centre Securities PLC ex-dividend date
Tritax Big Box REIT PLC ex-dividend date

Change to the SNOWBALL:Buy

I have bought 55 shares in XSTR Xtrackers II GBP Overnight Rate Swap UCITS ETF (XSTR) Share Price for £9,981.00

Future dividends as they are earned will now be re-invested into higher yielding shares. XSTR’s yield is around 4%, it’s a hold for when the market turns down so there is cash to buy a couple of coveted Trusts.

« Older posts Newer posts »

© 2026 Passive Income Live

Theme by Anders NorenUp ↑