Step 3: Create a “No Withdrawal” Portfolio
My colleague Tom Jacobs and I literally wrote the book on a dividend-powered retirement.
In How to Retire on Dividends: Earn a Safe 8%, Leave Your Principal Intact, we outline our “no withdrawal” approach to retirement:
- Save a bunch of money. (“Check.”)
- Buy safe dividend stocks with big yields
- Enjoy the income while keeping the original principal intact.
To make that nest egg last, and our working life worthwhile, we really need yields in the 7% to 10% range. We typically don’t see these stocks touted on Bloomberg or CNBC, but they are around.
Of course, there are plenty of landmines in the high-yield space. Some of these stocks are cheap for a reason. Which is why we need to be contrarian when looking for income.
We must identify why a yield is incorrectly allowed to be so high. (In other words, we need to figure out why the stock is priced so cheaply!)
As I write, the top 10 payers in my Contrarian Income Report portfolio yield about 10.6% on average.
On every million dollars invested, this dividend collection is spinning off an incredible $106,000 every single year!

And you don’t have to be a millionaire to take advantage of this strategy.
A $750k nest egg will generate $79,500 annually…
$500K could hand you $53,000…

You get the idea.
The important thing is that these yields are safe, which creates stability for the stock (and fund) prices attached to them.
We want our income, with our principal intact.
It’s really the only way to retire comfortably, without having to stare at stock tickers all day, every day.
Now, many blue-chip yields are reliable. They just need to hit the gym and bulk up a bit. Here’s how we take perfectly good, yet modest, dividends and make them into braggarts.
Step 4: Supersize Those Yields
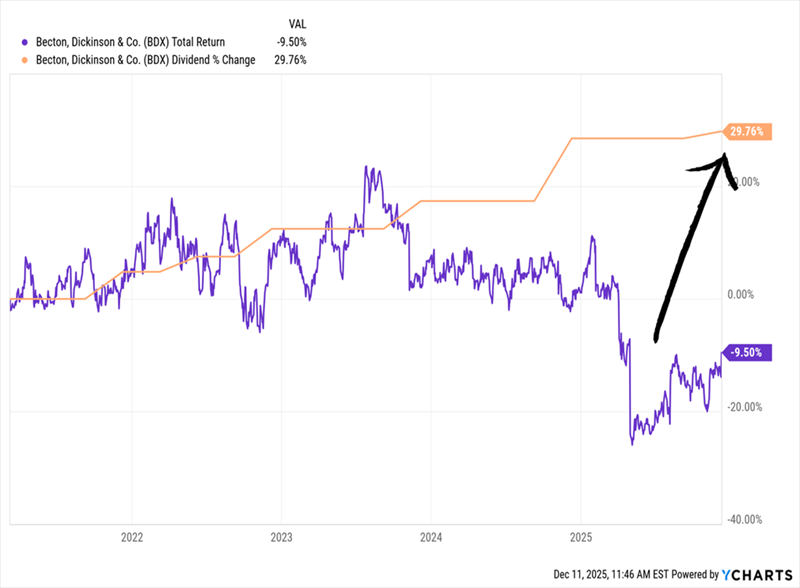
Mastercard (MA) is a near-perfect dividend stock. Its payout is always climbing, having nearly doubled over the last five years. (MA shareholders, you can thank every business that accepts Mastercard for your “pennies on every dollar” rake.)
Tap, tap, tap. Remember cash? Me neither. Another 2020 casualty, with Mastercard making a few dimes or dollars on every plastic transaction.
The cashless trend has been in motion for years. But international growth prospects remain huge. Just a few years ago, 80%+ of transactions in Spain, Italy and even tech-savvy Japan were in cash.
We expect more dividend hikes as more cash turns to plastic. Or skips plastic entirely and goes straight to e-transfers. Mastercard and close cousin Visa (V) nab a nice piece of that action, too.
The only chink in MA’s armor? Everyone knows it is a dynamic dividend stock. So it only yields 0.5%. Investors keep bidding it higher, knowing that the next dividend raise is just around the corner.
So, the compounding of those hikes makes MA a great stock for our kids and grandkids. You and I, however, don’t have the time to wait for 0.5% to grow. And $2,500 on a $500K investment simply won’t get it done.
Let’s instead consider top-notch closed-end fund (CEF) Gabelli Dividend & Income Trust (GDV), managed by legendary value investor Mario Gabelli.
Mastercard is one of Gabelli’s largest holdings. But we income investors would prefer GDV because it boasts a healthy dividend right around 6.4%, paid monthly, nearly 13 times what Mastercard pays (and this is low in CEF-land; other funds, like the next one we’ll talk about, pay nearly double that).

And as I write this, thanks to the conservative folks who buy CEFs, we have a rare opportunity to buy Mario’s portfolio for just 89 cents on the dollar.
Yup, GDV trades at an 11% discount to its net asset value, or NAV. It’s a way to boost MA’s payout and snag a discount, too.
Where does this discount come from?
CEFs are like their mutual fund cousins, with one exception: they have fixed pools of shares, so they can (and do) trade higher and lower than their NAVs, or “fair” values (the value of their holdings minus any debt).
As contrarians, we can step in when they are temporarily out of favor, like after a pullback, when liquidity is low, and buy them at generous discounts.
GDV holds more blue-chip dividend payers alongside MA, such as American Express (AXP), Microsoft (MSFT) and JPMorgan Chase & Co. (JPM). And with GDV, we have an opportunity to purchase them at an 11% discount.
These high-quality stocks wouldn’t normally qualify for our “retire on $500K” portfolio because everyone in the world knows they are strong long-term investments.
Even though these companies are constantly raising their dividends, constant demand for their shares keeps their prices high (and current yields low). So they never meet our current-yield requirement.
GDV does. The fund pays a monthly dividend that adds up to a nice 6.4% annual yield.
Let me give you one more idea (and this is where that much larger payout comes in): the Eaton Vance Tax-Managed Global Diversified Equity (EXG) is another CEF with a similar blue-chip dividend portfolio.
But EXG generates even more income than GDV by selling covered calls on the shares it owns.
More cash flow means a bigger dividend — and EXG pays an already terrific 8.9%!
So we buy and hold EXG and GDV forever, collecting their monthly dividends merrily along the way? Not quite.
In bull markets, these funds are great. But in bear markets, they’ll chew you up.
Step 5: Protect That Principal!
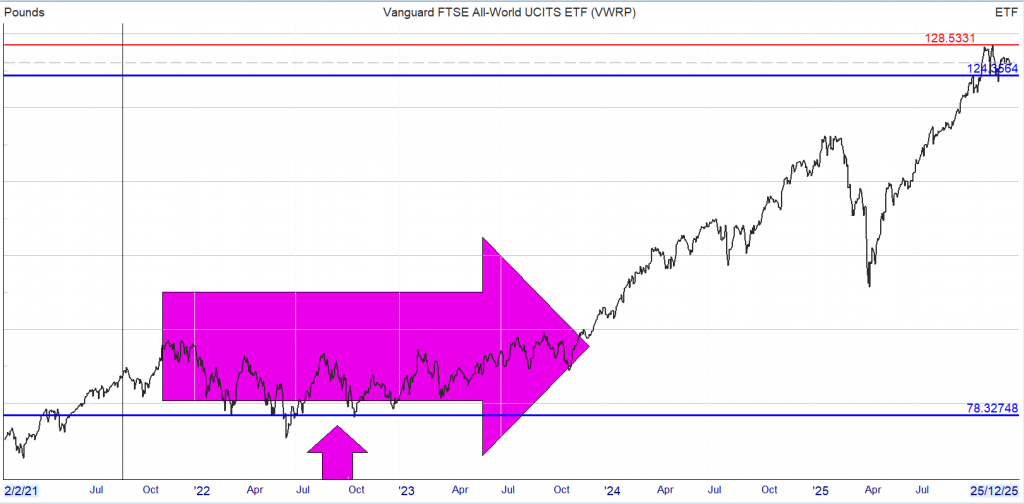
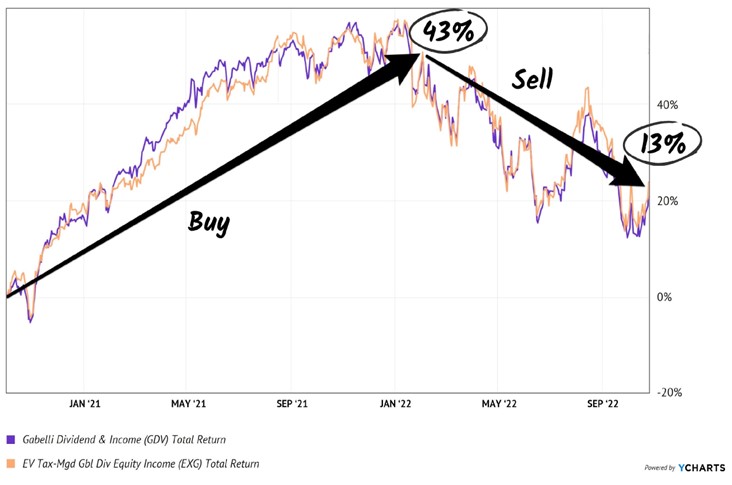
My CIR readers will fondly recall the 15 months we held GDV and EXG together, collecting monthly dividends plus price gains that added up to 43% total returns.
What was happening in that period, from October 2020 until February 2022? The Federal Reserve was printing money like crazy. Not only did the Fed stoke inflation, but we also enjoyed an asset-price lift.
Starting in 2022, we had the opposite situation. The stock market was topping, and we didn’t want to fight the Fed. We sold high, and by late 2022, both funds were down sharply:
We Sold EXG and GDV Just Before They Plunged
For whatever reason, “market timing” is a taboo phrase among long-term investors. That’s a shame because it is quite important.
By aligning our dividends with the market backdrop, we can protect our principal from bear markets.
Step 6: Start Here to Retire on $500K
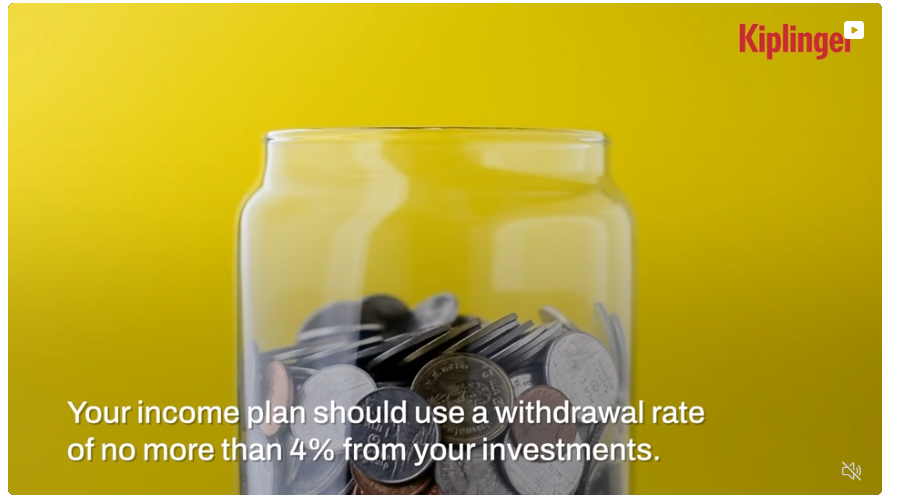
So if the “tried and true” money advice — like the 60/40 portfolio and the 4% rule — has been properly exposed as broken…
Where do we go from here?
Well, imagine your portfolio in just a few days or weeks from now spinning off 8%, 9% and even double-digit dividends with the reliability of a Swiss watch… with many of my recommendations paying every single month no less!
No more worrying how much is coming in next month.
No more worrying about the Fed’s next move. Or the next inflation or jobs report.
No more worrying about outliving your nest egg.
Let me tell you more about my solution — what I call the 11% “No-Withdrawal Portfolio.”
Better yet, I want to give you the names of my favorite stocks and funds to buy right now…
Yields Up to 11%, With Upside
To make it easy to transition into this new way of investing… where you are buying “bird in the hand” cash flows… instead of stocks that you just hope will go up… I’ve prepared two in-depth guides that hone in on the strategies I mentioned above…
Special Report #1:
Monthly Dividend Superstars: Yields Up to 11%, With Double-Digit Upside
This is where you’ll find the bargains that investors are leaving on the table in their misplaced fear of the Fed.
 Inside you’ll find the ticker symbol, my buy-up-to price and in-depth backstory on my three favorite CEFs:
- A well-hedged 11% payer in one of the most in-demand sectors right now,
- The brainchild of one of the top fund managers on the planet, throwing off an amazing 9.2% yield,
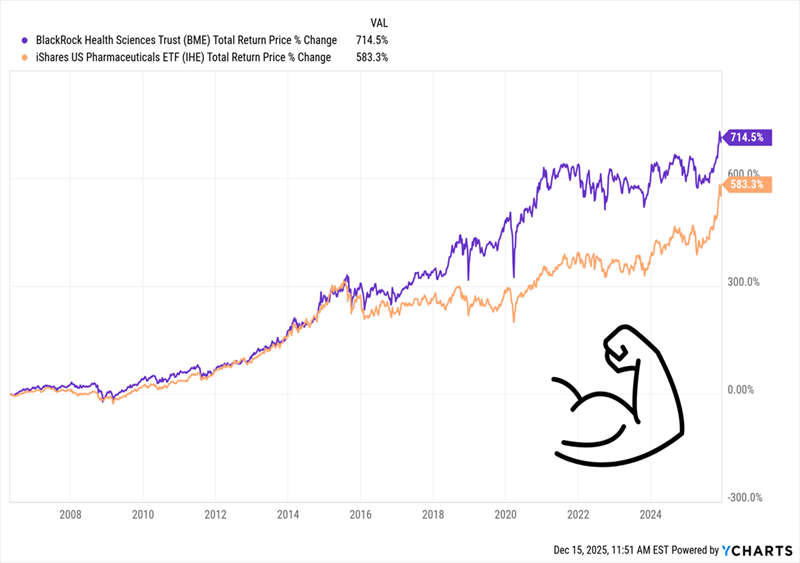
- And a rock-steady 7.1% dividend whose managers have guided it to an astonishing 1,500% total return since inception.
Special Report #2:
The Perfect Income Portfolio
In this guide, you’ll get all the details of what I call the “Perfect Income Portfolio.”
Step-by-step, I’ll show you exactly how to set up your portfolio for maximum income without taking on additional unnecessary risk.
And, if you follow the simple steps laid out, I’m confident you’ll be able to enjoy an income stream that far exceeds what most folks who buy the typical S&P 500 stock earn.
This report includes investments that have passed my strict due-diligence process—including one of the best ways I’ve ever seen to invest in utilities (which I’ve picked for strong gains as interest rates move lower).
This fund pays a rich 7% today, holds some of the strongest electrical utilities in the country and trades at a bargain valuation (even though most investors don’t realize it). Its bargain status won’t last as rates inevitably tilt lower, pulling more investors toward its healthy payout!
I’ll walk you through each recommendation, giving you a clear, concise and easy-to-understand breakdown of exactly why I see these as “perfect” income plays.
How to Get Both Reports Absolutely Free
To access both reports, Monthly Dividend Superstars and The Perfect Income Portfolio, at no cost whatsoever, I simply ask that you take a risk-free trial of my research service, Contrarian Income Report.
I created Contrarian Income Report to help investors uncover overlooked and underappreciated income plays before Wall Street and the mainstream herd bid them up.
People often ask me, “I get the income part, but where does ‘contrarian’ fit in?”
My answer is simple: You’ll never beat the market by following the herd.
If you buy the same investments as everyone else, you’re going to have the same results as other people — which are always mediocre. This is why my advisory is defiantly contrarian.
It all boils down to one simple principle: If you want to make money, really big money, do what nobody else is doing.
Contrarian investing is probably the simplest, sanest, most powerful and reliable money-making technique ever devised to buy low and sell high. It works in any market, from stocks and bonds to gold and real estate — because human nature is the same everywhere.
You don’t need special training. All you need is an independent mind, a bit of patience and an ounce of courage.
If you want to buy low and sell high, you must force yourself to buy when everybody, including yourself, is feeling discouraged — when the news is bad. That’s likely to be the bottom. And you should sell when everybody is excited and the news is good, because that’s likely to be the top.
Right now, we’re holding a diverse collection of these high-yielding stocks and funds, and you’ll get instant access to each one the moment your no-risk trial starts.
And every new investment you get in Contrarian Income Report comes with a simple goal: it will pay a reliable 5% dividend — or better.
In fact, some holdings in our portfolio go way further than that, delivering 12%+ income right now.
So just by “swapping out” your anemic blue chips for these cash cows, you could double, triple — or even quadruple — your income. And you could do it TODAY!
That sort of money can upgrade your lifestyle in a hurry.