Investment Trust Dividends

Author: admin (Page 6 of 408)

Bill Ackman

This “Celebrity” Fund Launch Can Teach Us a Lot (About What Not to Buy)

Michael Foster, Investment Strategist
Updated: May 14, 2026

If you ask the average investor what, say, an ETF is, you’ll likely get a good answer. A closed-end fund (CEF)? Likely a blank stare.

That’s because CEFs are a tiny corner of the market, with only about $300 billion in assets among them. ETFs? About $13.5 trillion. The scale is way out of whack here.

At CEF Insider, of course, we like it this way. It’s why “Insider” is in the service’s title.

Since CEFs are obscure, we can easily find overlooked ones trading at big discounts to net asset value (NAV, or the value of their underlying portfolios). Then there’s the income: Right now, the average CEF yields 8.7%, with many paying dividends monthly.

CEF discounts make our upside play straightforward: Buy when the discount is unusually wide, ride along (and collect our payouts!) until it narrows or flips to a premium. Then sell for a profit and move on to the next overlooked CEF.

Rinse and repeat.

CEF Obscurity Sometimes Attracts Celebrity Investors

But even though CEFs are off the radar, the odd famous investor does dip their toe in every so often. One such person is Bill Ackman.

Ackman is a value-investing maverick and multibillionaire whose public fights against corporate management teams have grabbed headlines worldwide.

He dramatically took on Herbalife (HLF) via a huge short position in 2012. He ended up on the losing end of that one, but his aggressive moves did turn Chipotle Mexican Grill (CMG) around. Similar tactics with Valeant Pharmaceuticals (VRX) and Canadian Pacific Kansas City (CP) had mixed results.

But overall, retail investors who’ve ridden along with Ackman haven’t seen great returns.

Below you can see the performance of his hedge fund, Pershing Square Holdings (PSHZF), in orange, versus an S&P 500 index fund, in purple, over the last decade.  Since Pershing is based in London, we’re looking at its US-listed over-the-counter (OTC) stock here:

UK-Based Pershing Square Has Underperformed for Years …

As a result, PSH has traded at a wide discount to NAV (around 30% much of the time) for years. That’s a steeper markdown than all but the six cheapest CEFs tracked by CEF Insider

Note that since PSH is London-based, its structure is a bit different than the CEFs we cover in CEF Insider (which is why you won’t find it on a screener like CEF Connect).

Nonetheless, let’s continue, because Ackman’s CEF efforts do hold useful lessons for us, especially since, in April, he debuted a US-listed CEF: Pershing Square USA Ltd. (PSUS). That fund fell sharply after its IPO:

… And Ackman’s US-Listed CEF Wobbled Out of the Gate, Too

While the S&P 500 (again shown through the performance of an S&P 500 index fund, in purple) has done well in the last couple of weeks, as of this writing, PSUS (in orange) has gone the other way, with a 17.7% drop in value from its IPO date.

What does this tell us? With PSUS moving from par to a roughly 12% discount in a couple weeks, the firm’s London listing clearly wasn’t the problem. It’s simply that, right now, investors don’t see Ackman as a star manager deserving premium pricing.

Moreover, PSUS has mainly marketed itself as a vehicle to invest alongside Ackman, and has not revealed its holdings. (CEFs don’t have to do so at IPO, and the fund is so young it hasn’t had time to make this disclosure.)

That makes it tough to predict where the discount will go from here, but the roughly 30% markdown PSH typically sports is a decent guide. That, along with the fact that PSUS doesn’t pay a dividend, either, makes this a fund to avoid.

The Fee Issue

Then there are PSUS’s fees, which in my mind are a bigger issue than the lack of clarity around its future moves. According to their SEC filings, PSUS’s managers will charge investors a flat 2% fee:

“The Company [i.e., PSUS itself] pays the Manager [i.e., Ackman and his team] a fee, payable quarterly in advance on the first business day of each fiscal quarter, based on the Company’s NAV on the last day of the previous fiscal quarter equal to 0.50% (or 2.0% on an annualized basis).”

Technically speaking, this is less than the average CEF, which has fees of 2.6%. However, that figure is skewed by CEFs with very high fees, like the XAI Octagon Floating Rate and Alternative Income Trust (XFLT), whose fees are more than 5% of assets.

There are plenty of solid CEFs with much lower fees, like the Adams Diversified Equity Fund (ADX), a CEF Insider holding whose fees are just 0.49% of assets.

This is also a bit of an unfair comparison because many CEFs (like XFLT) look like they charge high fees because they include the cost of leverage in their calculation. Notably, that 2% fee PSUS discloses does not include the costs on the $50 million of preferred shares it plans to issue, or the 15% to 20% leverage ratio it intends to carry over time.

That points to potentially higher fees in the future.

That isn’t necessarily a bad thing for CEFs, as strange as that sounds! A heavily discounted CEF with high fees can still outperform a low-fee CEF trading at a premium. But it also lowers PSUS’s appeal, unless and until its discount gets even wider still. Otherwise, this is a fund to avoid, despite its high-profile manager.

These 4 “Pivot Points”—Not Ackman’s Flashy CEF—Are Where We’re Going Next

The great thing about CEFs is that, despite their small market size, they give us lots of ways to tap into the fastest-growing trends out there. And they let us do so at a discount!

I’m tracking 4 CEFs that are cheap now, while kicking out a solid 10% average dividend. Plus they give us “upside two ways”:

  • Through their narrowing discounts: All 4 of these funds are unusually cheap, which can’t last because …
  • They’re dialed into the biggest shifts AI is driving today, including the automation of manufacturing, fast drug development and surging power demand.

Wall Street is starting to notice these shifts, but there’s still time to get in. And overlooked CEFs are the perfect way to do it with their way overdone discounts.

Across the pond

Is Wall Street’s Trash Our Treasure? 5 Outcasts Yielding up to 18.3%

Brett Owens, Chief Investment Strategist
Updated: May 15, 2026

Let’s capitalize on analyst incompetence—and bank yields up to 18.3%, with upside to boot!

A widely cited academic study on analyst target price accuracy found that only about 54% of 12-month price targets correctly predicted even the direction of the subsequent price move.

Fifty-four percent. On direction alone. That’s barely better than a coin flip!

Analysts give specific price targets to stocks like they are scripture. In reality, they don’t even know if the thing is going to move up or down.

And it gets uglier. A 2024 Yale School of Management study found that analysts systematically delay downgrading stocks after bad news—to curry favor with the companies they cover. The suits aren’t just bad at predicting stock moves. They’re deliberately stalling their warnings to protect their banking relationships.

Put those two facts together and the picture is clear. Wall Street “research” is a farce. Which is exactly why it works so well as a contrarian indicator!

When Wall Street’s collective price target sits below the stock’s current price, that’s not a signal to sell. That’s a signal that full pessimism is baked in! All it takes is one decent earnings report and the stock gaps higher while the research machine scrambles to reload.

Today we’ll review five hated dividend payers with yields of 6.7% to 18.3% with the potential to rally when analysts change their tune.

Virtus Investment Partners (VRTS)
Dividend Yield: 6.7%

Let’s start with Virtus Investment Partners (VRTS), an investment manager that provides mutual funds, exchange-traded funds (ETFs), closed-end funds (CEFs), insurance funds, separately managed accounts and more.

This is no Vanguard or Fidelity. Its $160 billion or so in assets under management (AUM) is a fraction of what the big boys handle, and most readers might not recognize the name.

But Virtus still stands out because of its structure. It’s a partnership of numerous boutique investment advisers, which means different funds under the Virtus name are often managed by different groups.


Source: Virtus Investment Partners, March 2026 Investor Presentation

This company peaked in late 2021 amid the broader market’s roaring recovery. Since then, however, it has lost nearly 60% of its value, reflecting slowdowns on both the top and bottom lines. This year might not be any different, with the pros looking for single-digit declines in both revenues and profits.

Part of the issue has been weak performance in some of Virtus’ most important funds. But there’s also the overall nature of its products—Virtus is a predominantly actively managed (read: higher-fee) outfit in an age when most investors are looking for passive, low-fee ways to invest.

Wall Street’s not high on this stock as a result. A common thread among hated stocks is that they’re also poorly covered stocks—many analysts prefer to simply drop coverage of a company rather than irk management by telling people to sell. That’s the case with VRTS, which has just four covering analysts. One says it’s a Buy, one calls it a Hold, and the other two are Sells. For however tame that might sound, that’s an ugly split in the stock-research world.

Virtus does have a handful of contrarian appeals, though.

Shares trade for a paper-thin 5.5 times next year’s earnings estimates. The dividend has exploded by more than 400% over the past decade, and that includes a near-doubling over the past five years alone. That payout is safe, too, at less than 40% of next year’s earnings. And the company has made numerous acquisitions (such as Alphasimplex, AGI and Stone Harbor) in hopes of sparking longer-term growth.

Alexander’s (ALX)
Dividend Yield: 7.6%

Alexander’s (ALX) is a REIT that operates exclusively in the greater New York City metropolitan area. It’s technically classified as an office landlord, though its properties also include retail and residential space. Vornado Realty Trust (VNO), which predominantly operates in the Big Apple (but also owns one property in each of Chicago and San Francisco), owns a 32.4% stake and also manages the company, which means ALX owes it annual management fees and occasionally development fees.

The most important thing to know about Alexander’s is just how concentrated it is. ALX has just five properties under its umbrella—and it’s about to be four. In March, the company entered an agreement to sell its Rego Park I property to Northwell Health for $202 million in net proceeds.

So, in a nutshell:

  • Alexander’s already-tiny real estate roster is somehow getting smaller.
  • Despite its small portfolio, the company still has external management expenses.
  • ALX earned $10.82 per share over the trailing 12 months and is expected to earn $12.08 per share across 2026, but it’s on pace to pay out almost 50% more than that ($18 per share) in dividends.
  • Shares trade around 19 times next year’s AFFO estimates.
  • The stock is down to one lone analyst who says we should Sell.

No Greatness From Alexander’s Since Its Last Dividend Hike in 2018

I pointed out Alexander’s loathed status on Wall Street back in November. Since then, it has put together a 15% gain, but it has done so by fattening an already hefty valuation.

If ALX continues to rise from here, it will be defying gravity—and sanity.

ConAgra Brands (CAG)
Dividend Yield: 10.0%

Companies selling pantry and household basics are not popular right now. I recently highlighted how sector-wide pain had driven up consumer staples yields, but it’s not just shareholders who are selling—analysts think we should unload those stocks, too. Wall Street’s most-hated list includes a ton of sector names, including Kraft Heinz (KHC)Campbell’s Soup (CPB) and General Mills (GIS), the last of which I identified as a prime GLP-1 victim.

But the worst-rated of the group right now is Conagra Brands (CAG), which has gone from a reasonably high yielder to a sky-high payday for the wrong reason: a multiyear cratering in shares.

CAG Is Paying 2x Its Historical Dividend Ceiling

Conagra owns a broad portfolio of packaged food brands, including Banquet, Healthy Choice, Marie Callender’s, Vlasic, Duncan Hines, Slim Jim, Reddi-Wip, and more. It also has a foodservice business that offers more diversification than most grocery-anchored staples names.

But it has been taking blows from all sides: GLP-1 adoption. Soaring input costs. Cuts to SNAP. Encroachment by private-label brands. Its top and bottom lines have been contracting, and the pros expect more of the same over the next couple years.

Understandably, the pros don’t love it. A dozen analysts covering Conagra say investors should stay on the sidelines; two call it a Buy, and four say it’s a Sell. Consider this a “bearish Hold”; analysts overcorrect toward being bullish, which means even Holds have a negative connotation, making this a very bearish consensus.

The dividend is in doubt. The payout represents about 80% of next year’s (lower) earnings estimates, which by itself doesn’t signal an immediate threat—plenty of defensive companies can manage at that level. However, 1.) it doesn’t give CAG much room to explore M&A to reposition its portfolio, and 2.) that’s well above Conagra’s stated target ratio range of 50% to 55%.

Western Union (WU)
Dividend Yield: 10.5%

Western Union (WU) was founded as a telegraph service, and its core business today is money transfers in an age of PayPal and Venmo.

It seems like such a dead company from 10,000 feet that Wall Street’s view—it has 10 Holds, just 1 Buy, and six Sells on the stock—almost seems too optimistic.

But credit where credit is due: Western Union has been scrapping hard to remain relevant.

Its “Evolve 2025” initiative is standard corporate fare: new products and improvements, as well as operational efficiencies.

However, in April 2025, it spent $77 million on foreign-exchange specialist Eurochange to further expand its “Travel Money” unit.

It made a bigger splash that summer with a $500 million acquisition of Miami-based International Money Express (IMXI), aka Intermex, which serves some 6 million customers who send money from the United States, Canada, Spain, Italy, the United Kingdom, and Germany to more than 60 countries. (The deal is expected to close in mid-2026.)

WU has also begun to lean heavily into digital assets. It very recently launched its own “USDPT” stablecoin alongside its Digital Asset Network, the latter of which will help people with partnered cryptocurrency wallets cash out across Western Union’s network of 380,000 agents. A Visa-branded prepaid USD “stable card” is expected to launch later this year, will let consumers hold value in Western Union’s USDPT and spend it globally.

The question is whether all of this will help counter the secular decline of its cash-based money-transfer business. One promising sign? Revenues are expected to improve by mid-single-digits this year and next, and while profits are expected to remain virtually flat for the fourth straight year, the pros now see a 10% bump in the bottom line for 2027.

Can Western Union Finally Stop the Long Bleed?

Prospect Capital (PSEC)
Dividend Yield: 18.3%

Prospect Capital (PSEC) has a lot of headline stats that are hard to ignore. It pays more than 18% right now. It’s a monthly dividend stock, to boot. And it trades at a wild 60% discount to its net asset value (NAV), making it one of the cheapest business development companies (BDCs) on the market.

On the other hand …

4 Dividend Cuts and Barely Breakeven Returns in 12 Years

It was already a miserable history to overcome, and it got even worse of late, with Prospect Capital taking another slice out of its dividend in early May.

Wall Street is fed up. Only one analyst covers PSEC anymore, and they think we’re better off without it.

However, despite its steep losses of the past few years, PSEC is still one of the larger BDCs by both market cap ($1.2 billion) and net assets ($3 billion).

Prospect has a diverse portfolio of 89 companies across 31 industries, though I should point out that’s a couple dozen fewer investments than it had less than a year ago. The company is in the midst of trying to transform its portfolio—it has been increasing its first lien mix (72%) and reducing its second lien senior and secured loans (12.4% of the portfolio at cost). It has also fully unloaded its CLO equity portfolio and exited several real estate properties.

PSEC is also much more defensively positioned for the current market moment, with just 3% software-industry exposure versus a peer average of 23%.

These moves might eventually bear fruit, but Prospect Capital is a “show me” stock given its past, and so far, it’s not showing much. PSEC has reported year-over-year declines in quarterly net interest income across all three quarters of its current fiscal year, it’s pacing for an 8% drop in profits for the full year, and its cash payout has been cut down yet again.

Monthly Dividends of 9%+ We Can Actually Count On!

Rock-solid 2% or 3% yielders are a dime a dozen. It’s easy to pay a modest dividend without breaking the bank.

We have to be a lot more selective about sky-high payers like we discussed above. Far fewer companies can pay us 8%, 9% or more, and some of them are very dangerous dividend landmines just waiting to blow up your portfolio.

The SNOWBALL

There are three SONIA‑tracking ETFs in the UK, the three main options are and they’re all ultra‑low‑risk cash‑equivalents designed to mirror the Sterling Overnight Index Average (SONIA).

Below is a clean, structured comparison of the three SONIA ETFs currently available:

  • Invesco GBP Overnight Return Swap (GONS)
  • Xtrackers GBP Overnight Rate Swap (XSTR)
  • Amundi Smart Overnight Return GBP Hedged (CSH2)

These are the only widely‑listed, liquid SONIA ETFs in the UK market today.

The SONIA ETF Landscape (UK)

1. Invesco GBP Overnight Return Swap UCITS ETF (GONS)

  • Tracks SONIA via swaps
  • Accumulating
  • TER 0.10%
  • Very low volatility
  • Designed as a cash‑like parking place

2. Xtrackers GBP Overnight Rate Swap UCITS ETF (XSTR)

  • Tracks Solactive SONIA Daily TR Index
  • Distributing
  • TER 0.10%
  • One of the oldest and most established SONIA ETFs

3. Amundi Smart Overnight Return GBP Hedged (CSH2)

  • Actively managed but still SONIA‑anchored
  • Accumulating
  • TER 0.10%
  • Very large AUM (£8.5bn fund)

Side‑by‑Side Comparison (SONIA ETFs)

Invesco GONS0.10% TERXtrackers XSTR0.10% TERAmundi CSH20.10% TER
Costs
TER0.10%0.10%0.10%
ReplicationSynthetic swapSynthetic swapActive (cash+SONIA)
Income
DistributionAccumulatingDistributingAccumulating
Yield4.15% (semi‑annual)
Exposure
IndexSONIA swapSolactive SONIA TRSONIA+enhanced cash
VolatilityVery lowVery lowVery low
Fund Size
AUM£5m£175m£8.5bn
Other
CurrencyGBPGBPGBP (hedged)
Launch20072022

Sources:

Which one fits what purpose?

For pure SONIA exposure (cleanest tracking):

XSTR — longest track record, straightforward SONIA TR exposure.

For accumulating cash‑like growth:

GONS or CSH2 — both roll up returns.

For maximum scale & liquidity:

CSH2 — huge AUM (£8.5bn), extremely stable.

With markets at all time highs and with the world at war, it’s scary times to re-invest in shares.

The SNOWBALL wants to build a cash fund to re-invest when the next market crashes occurs, hopefully not too soon until the cash element has built accrued.

I am content, at the present time with the dividend stream for this financial year, so I am going to re-invest the income in a money market ETF, yielding around 4%.

Watch List Leaders

Glenstone REIT PLC on Friday said it is considering an all-cash takeover of commercial property investor, Alternative Income REIT PLC.

Glenstone said it has been the largest shareholder in Alternative Income since November 2020, and holds 19.3 million shares, representing 24% of the company’s issued share capital.

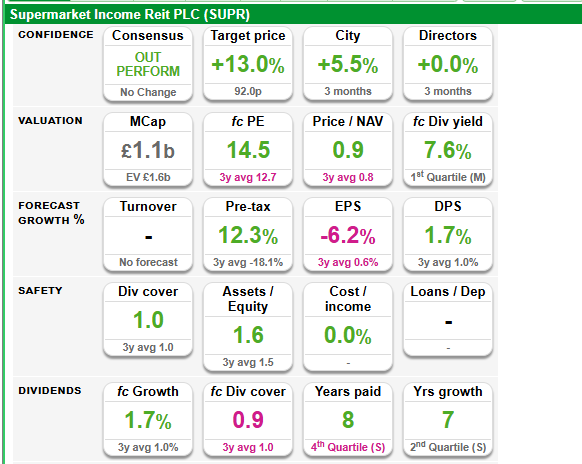
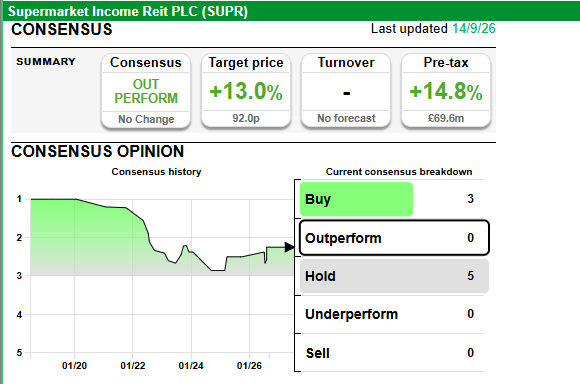
SUPeR

If you align the Bank Rate (2016–2025) with the SUPR stock price (2017–2026):

PeriodBank Rate TrendSUPR Price Reaction
2016–2020Flat near 0.5%, then drops to ~0%SUPR stable and gradually rising
2021–2023Rapid increase from ~0% to >5%SUPR peaks early 2022, then collapses sharply
2024–2025Gradual decline from ~5% to ~3.5%SUPR stabilizes and begins modest recovery

📊 Interpretation

  • The inverse relationship is striking: as the Bank Rate surged, SUPR’s price fell dramatically.
  • This reflects interest rate sensitivity typical of REITs — higher rates raise borrowing costs and reduce property valuations.
  • When rates began easing in 2024–2025, SUPR showed tentative recovery, suggesting investor optimism returning with lower yields.

Markets look ahead, the expectation is that interest rates will rise because of the oil price. Not a given but it’s the glorious uncertainty of owning stocks and shares.

Current yield 7.5%, a buy for the SNOWBALL but could you get 8% ?

The index funds and ETFs that active funds struggle to beat

Kyle Caldwell names the passive strategies that have caught the eye by outperforming many fund managers over the past five years

13th May 2026 13:42

by Kyle Caldwell from interactive investor

Two boys in a go-cart race

Some stock markets prove to be a tough nut for active managers to crack.

The S&P 500 index, for example, is notoriously difficult for fund managers to consistently beat, given that it is the most widely researched and followed index.

By the same token, active fund managers who invest in small companies tend to have a greater percentage of outperformers. Smaller stocks tend to be more volatile and less well researched than large companies, which gives active managers a better chance of beating a benchmark that simply owns stocks according to their size.

Below, we name passive strategies that have caught the eye by outperforming many fund managers over the past five years.  

L&G Global 100 Index Trust

Over multiple time periods – one, three and five years – L&G Global 100 Index Trust has produced top-quartile performance in the Investment Association’s (IA) global fund sector, according to FE Fundinfo. As at 12 May 2026, the fund’s five-year returns show a gain of 128.6% versus 50.8% for the global sector average.

The key reason for the outperformance is the make-up of the S&P 100 index that the L&G Global 100 Index Trust tracks.

The index holds multinational blue-chip companies of major importance in global equity markets. Companies included in the underlying index are screened for global exposure, sector representation, liquidity and size. Stocks with relatively larger sizes and higher liquidity are preferred.

In common with most indices, the S&P 100 is market-cap weighted, ranking companies by their size and share price success.  

The market cap of a company is the total number of shares in existence multiplied by the price of those shares. If a company’s share price goes up relative to other members of the index, it will represent a higher percentage of the index.

The end result for L&G Global 100 Index Trust is that this index has significant weightings in US technology behemoths that have delivered exceptional performance for most of the past decade.

As at the end of March, L&G Global 100 Index Trust had around 40% of its assets in four US tech stocks: NVIDIA Corp 

NVDA, Microsoft Corp MSFT and Amazon.com Inc AMZN. The respective weightings are: 12%, 10.6%, 7.9% and 5.9%.

Investors need to question whether the outperformance of Big Tech can continue, as well as if they are comfortable with those stock weightings.  

Other global trackers topping the charts  

Over the past five years or so the performance of global and US stock markets has been heavily influenced by a small number of very large stocks – primarily the US tech giants.

This has made the period a challenging environment for active fund managers – particularly those who hold less exposure than the index in these companies, the likes of Amazon, Apple, Alphabet Inc Class A  GOOGL and Microsoft.

Global index funds and exchange-traded funds (ETFs) have benefited from this trend, with five-year returns of just under 85% for theiShares Core MSCI World ETF GBP H Dist  IWDG

 Xtrackers MSCI World Value ETF 1C GBP  XDEV

 Fidelity Index World, and Invesco MSCI World ETF GBP MXWS. This is comfortably ahead of the IA Global sector average return of 50.8%.

Low-cost exposure to the US market pays off

In the US, there’s been similar levels of outperformance for passive strategies that track the ups and downs of the S&P 500 index. Over five years, the iShares Core S&P 500 ETF GBPH Dist  GSPX

andiShares Core S&P 500 ETF GBPH Dist  GSPX

have both returned around 100% versus 72.2% for the IA North America sector.

Over other time periods (three months, six months, one year and three years), the duo have outpaced the sector average. Both charge just 0.07% a year.

As you would expect, the same stocks are held, with the top 10 biggest positions being Nvidia, Apple, Microsoft, Amazon, Alphabet (two share classes held), Broadcom Inc  AVGO

,Meta Platforms Inc Class A  META

Tesla Inc TSLAand Berkshire Hathaway Inc Class B BRK.B0..

Vanguard FTSE UK Equity Income Index

Over one, three and five years Vanguard FTSE UK Equity Income Index, has had the upper hand over the IA UK equity income sector average, up 31.6%, 64% and 92.4% against 15.2%, 35.7% and 47.1%.

The index it follows – the FTSE UK Equity Income index – consists of shares “that are expected to pay dividends that generally are higher than average”.

Therefore, its performance and income generation is heavily influenced by the biggest FTSE 100-listed dividend stocks. Its top 10 holdings account for around half the portfolio, while financials account for a quarter of assets. In total, 110 stocks are held, and the top three positions currently are BP  BP.

 Shell  SHEL

 and GSK GSK.   

Vanguard LifeStrategy range

Last, but by no means least, the Vanguard LifeStrategy fund range has consistently outperformed most actively managed multi-asset funds since it launched over a decade ago.

Vanguard’s ready-made portfolios hold a collection of its own index funds and ETFs. Each of the five LifeStrategy funds holds a different proportion of shares, ranging from 20% to 100%, with the remainder in bonds. Three of the funds; the 20% Equity60% Equity and 80% Equity versions form part of interactive investor’s Quick-start Funds range that offers a simple starting point for investors.

In 2022, the five funds in the range didn’t perform in line with their risk level, as the 20% version produced the biggest losses, followed by the 40%, 60%, 80% and 100% options. This was due to sharp interest rate rises, which caused bond prices to fall, meaning the LifeStrategy funds with greater exposure to bonds saw their performances suffer more.

Over five years, three of the five funds in the range have outperformed their most relevant IA fund sector.

FundReturn (%)Investment Association (IA) sectorReturn (%)
Vanguard LifeStrategy 100% Equity A Acc77%IA Global50.9%
Vanguard LifeStrategy 80% Equity A Acc55.2%IA Mixed Investment 40%-85% Shares33.6%
Vanguard LifeStrategy 60% Equity A Acc36.0%IA Mixed Investment 40%-85% Shares33.6%
Vanguard LifeStrategy 40% Equity A Acc18.7%IA Mixed Investment 20%-60% Shares22.5%
Vanguard LifeStrategy 20% Eq A Grs Acc5.3%IA Mixed Investment 0%-35% Shares11.1%

Source: FE Analytics. Data to 12 May 2026. Past performance is not a guide to future performance.

The low costs, with each fund having an ongoing charges figure (OCF) of only 0.2%, make it challenging for actively managed multi-asset funds to beat them. A typical OCF for an actively managed multi-asset fund is around 1%, while multi-manager funds, which invest in other funds, tend to be even more expensive, typically around 1.2% to 1.5%.

Five ways to invest during turbulent times

From a global recession to stagflation, we offer dynamic and robust portfolios to cover all eventualitiesFive ways to invest during turbulent times

Published on May 14, 2026

by Julian Hofmann

Table of contents

Why scenarios beat predictions

What to do with your portfolio at a time of uncertainty is the hardest question in investing, and the honest answer is that it depends on which world you find yourself in. Pretending otherwise at a time when a single social media post can erase (or restore) billions of market value in an afternoon would be wilfully blind.

The current period of rapidly changing market conditions would tax the portfolio management skills of even the most experienced investor. The core problem is that markets are not really pricing in a single outcome in which investors can have much confidence.

Instead, they are oscillating between several incompatible ones: a negotiated de-escalation of trade tariffs; a protracted stand-off in the Middle East; a potential escalation in eastern Europe; a US dollar decline; and a higher-for-longer interest rate environment that punishes long-term positions. Each of these outcomes is possible, but we cannot anticipate them all at once. For retail investors, this is a paralysing problem, and it is tempting to do nothing and hope the fog lifts.

But sitting still may not prove foolproof, either. The past three years have been characterised by higher interest rates, an AI-driven US stock market boom and a general assumption that inflation would stay at manageable levels. A portfolio that worked well through that period is, by default, a bet on the specific combination of economic and investment conditions that prevailed during that time. Can anyone now champion these assumptions with confidence?

If not, the uncomfortable question is: what is your current portfolio relying on, and would you have consciously chosen this stance at the outset? The useful response to elevated uncertainty is not to attempt predictions, but to understand which scenario your existing allocation is implicitly positioned for, and to ask whether one or two modest adjustments might improve its resilience.

Why scenarios beat predictions

Volatility is an unavoidable part of investing, but the current backdrop feels more destabilised than at any time since the end of the cold war.

The World Uncertainty Index, constructed by Hites Ahir and Davide Furceri of the IMF together with Stanford’s Nicholas Bloom, demonstrates the turbulence of the past decade, with major spikes around Brexit, the Covid-19 pandemic and the second Donald Trump presidency (see chart below).

Column chart of World Uncertainty Index (GDP weighted) showing A turbulent period

In fact, it is entirely possible that the so-called ‘Great Moderation’ from 1990 to 2008 was the exception to the rule, and that a permanent state of uncertainty and instability is in fact the new ‘normal’. In which case, preparing conceptually for several different scenarios should be a key mental discipline for investors.

Achieving sustained insight means assessing risk dispassionately. Investors have traditionally relied on smoke signals from the bond market to forecast trouble ahead. However, part of the current problem is that this market may no longer be transmitting reliable information, due to surging sovereign debt loads pushing yields higher for structural, rather than purely economic, reasons.

For example, in its latest Fiscal Monitor report, the IMF estimates that global public debt was just under 94 per cent of world GDP in 2025 and is on course to reach 100 per cent by 2029, with the accumulation driven largely by the world’s major economies.

Indeed, the market historian Russell Napier argues that investors cannot rely on the signals from bond yields for the next 15 years or so. His reasoning is that government debt levels are now so high that they require inflation to erode them. He thinks the ‘financial repression’ investors experienced after 2008, whereby interest rates were kept lower than the rate of inflation, is now an embedded part of the financial system.

Investors do not need to accept every implication that Napier draws to take the underlying point seriously: if sovereign bond yields no longer transmit a reliable price signal, a portfolio built on assumptions to the contrary is taking a position that is not consciously chosen.

This reinforces the theoretical point that is less often stated but still important. A portfolio built for one economic outcome is, by definition, an unhedged bet on that outcome materialising.

Generally, the assumed correlations between asset classes bear weight: equities rise, bonds cushion, the ‘60/40’ equity/bond portfolio works as envisioned. However, in abnormal times, those correlations invert without warning and investors discover, usually too late, that they were never really diversified at all.

Investors’ Chronicle

The Five Portfolio Scenarios

Portfolio one: Stagflation

Inflation is sticky, growth stalls, and the two halves of a balanced portfolio fail

This is the scenario that often arrives in the wake of an external crisis (such as an oil shock that does not easily unwind). It leads to rising wage demands at the same time as output stumbles. What is so damaging about stagflation is that inflation does not need to return to double-digit levels to do serious damage: it simply needs to stay above target while activity weakens.

When inflation is high and rising, the negative correlation between equities and government bonds turns positive, meaning both suffer and the 60/40 portfolio no longer works.

In this scenario, inflation-linked gilts provide more ballast than conventional gilts, although they too can be caught out if base rates rise faster than markets expect. Another option would be selectively chosen infrastructure and resources funds. Indeed, this is when energy and broad commodities exposure earns its keep, despite being uncomfortable to hold in any other scenario.

Line chart of  showing Gilt prices squeezed

On the equities side, the choice narrows to those companies that can pass cost inflation on to customers without losing them, which is a far smaller universe than generally advertised. This increases the case for holding stalwarts such as AstraZeneca (AZN) or Unilever (ULVR) that anchor a portfolio, precisely because these companies can still increase earnings when turnover is flat.

The history of the 1970s stagflationary period shows that it was brutal, but not uniformly so. The pain was certainly concentrated: the FT30 (the precursor to the FTSE 100) lost roughly three-quarters of its value between May 1972 and December 1974, a worse absolute fall than the UK market suffered during either world war or the Great Depression.

Gilts suffered in real terms, with UK inflation hitting 25 per cent in 1975 and savers watching the purchasing power of fixed coupons evaporate. The winners were the assets the typical British investor of the time either could not access or actively distrusted.

Gold rose from $35 an ounce when the US abandoned the gold peg in 1971 to around $850 by January 1980, comfortably outpacing inflation. Broad commodity baskets, as measured by the S&P GSCI index, returned more than 580 per cent over the decade.

Portfolio two: Soft landing

The Federal Reserve cuts rates once or twice, tariff damage is absorbed, earnings hold up

This was the consensus scenario at the start of 2026, so by definition the one most open to disappointment. A soft landing would require consumer prices not to climb too much due to tariffs or supply shocks and trade negotiations to grind their way to bilateral deals, while central banks deliver two or three more base rate cuts.

The temptation in this scenario is to assume that what worked over the past three years will continue to work. The main weakness in this assumption is that returns have been driven by a handful of US megacap technology shares trading at high multiples.

For example, the S&P 500 is on a forward price/earnings (PE) ratio of roughly 21 times, according to FactSet, above its 10-year average of around 19, and that headline figure flatters the picture as the largest constituents trade considerably higher.

A soft landing may not mark the return to an indiscriminate risk-on environment; instead it may mean the conditions under which neglected value shares come back into focus. Currently, that points towards European equities, where the Stoxx Europe 600 trades on a more forgiving forward multiple of around 14.5, according to FactSet.

The case for holding the UK in a soft-landing scenario is sharper still. The FTSE 100, on a forward PE ratio of 12.6 with a dividend yield over 3 per cent, has trailed the S&P 500 consistently over the past decade. The gap has narrowed over the past 18 months, but is still wide enough that even a modest mean reversion would have a material effect.

The FTSE 250 is the more interesting prospect for those willing to take domestic risk. The mid-cap index continued to lag its larger counterpart last year (see chart below), and on a FactSet forward PE ratio of around 12 against a long-run average closer to 15, it sits at a relative discount to its own performance.

Line chart of  showing blue chips lead the way

The bond side of the portfolio benefits gently rather than dramatically in this scenario. Central bank policy that delivers modest rate cuts will pull gilt prices up by enough to deliver a respectable total return.

Investment-grade corporate bonds benefit from the same dynamic, with spreads relative to government debt compressing as recession risk fades. The running yields on offer at the start of 2026 – sterling corporate bond funds were distributing around 5 per cent – provide a cushion that did not exist for most of the past decade.

Cash is the loser here in this scenario, in relative terms. The 4 per cent cash yield that competes credibly with equity risk in a ‘higher-for-longer’ interest rate scenario starts drifting back towards 3 per cent as the rate-cutting cycle proceeds; the common investor mistake is to stay too long in cash on the way down.

The structural hedge worth carrying is a deliberate tilt away from the US. Tracker fund drift (global benchmarks now have 60-70 per cent of assets in the US) has left most UK retail portfolios more US-exposed than the holders would consciously choose if asked, and a soft landing is not a reason to stay there by accident.

Portfolio three: Recession

Tariffs and the Strait of Hormuz closure bite, consumer confidence slumps, earnings disappoint

A recessionary scenario is unusual in that it requires two portfolios at once – a defensive one for the next 18 months and an opportunistic one for the period after. The investors who do badly in recessions are not those who fail to predict them, but those who treat the defensive phase and the subsequent deployment phase as the same problem.

Capital preservation dominates the first phase. Short-duration fixed income earns its keep again, after a decade in which it was barely worth owning. Cash finally pays and defensive sectors, such as consumer staples, utilities and parts of healthcare, do the income work that the textbooks promise they will, with the caveat that valuations within them are now uneven enough to require genuine stockpicking. This is also where conventional gilts become a genuine income option again, as their negative correlation with equities reasserts itself.

Understanding the deployment phase

Recessions produce bargain prices that make 20-year compounding possible, but only for investors with the cash, the discipline and the time horizon to act on them. Holding 10 per cent of your portfolio in instruments that can be deployed quickly is not dramatically strategic, but it allows the next decade’s returns to be earned at sensible prices.

It is worth noting that two assets behave less obviously than the textbooks suggest in a recession scenario.

Gold’s recession record is more mixed than its reputation implies. The metal has tended to perform strongly in inflationary recessions and crisis periods but can drift sideways or fall in conventional downturns, when real yields rise and the US dollar strengthens as a haven asset. A modest position is defensible as a tail-risk hedge, but should not be confused with the recession-proofing role that conventional gilts can perform in its place.

Non-US equities are the other consideration that deserves attention. The most vulnerable market at the start of a sell-off will depend on which sectors are at the centre of the shock in question. But as a general rule, other markets tend to start from cheaper valuations and recover faster.

This makes them the natural home for capital being deployed in the second phase. UK and European mid-caps have historically been among the most rewarding hunting grounds for investors who have the patience to buy throughout the bottom, rather than waiting for confirmation that a recovery has arrived.

Portfolio four: Dollar decline

A structurally weaker dollar changes the total returns on offer from US assets, without anything happening to underlying businesses

This scenario is already partially under way, although less dramatically than much news coverage suggests. The US dollar is meaningfully softer than the 2022-23 cycle, but talk of collapse mistakes a multiyear drift for a rout (see chart below).

Line chart of US dollar index, January 2025 to present showing An age of dollar weakness?

The structural point matters more than the precise level of the dollar. As mentioned, UK retail portfolios have become more US-exposed than many holders would consciously choose. This is due to the simple mathematics of letting Wall Street’s outperformance compound inside a default global index allocation.

However, the Investment Association’s full-year 2025 data, published in February, shows the picture beginning to shift. UK retail investors pulled £4.8bn from global equity funds in 2025, with North American equities suffering £2bn of redemptions in the second half alone, while European equity funds attracted net inflows of £761mn, in what could be the first signs of conscious geographical reallocation rather than a passive drift.

The response to the dollar problem takes different forms. Gold has historically been negatively correlated with the currency. But the metal’s soaring price – last year was its strongest annual performance since 1979, driven by sustained central bank buying and sovereign debt anxiety – raises the risk of a reversal even in a scenario where the dollar keeps weakening.

For income investors who want to reduce their currency risk, sterling-denominated bonds now offer a genuine alternative in this scenario. Ten-year gilt yields are above 5 per cent, the highest level this century, and sterling investment-grade corporate bond funds are typically paying around this level, too.

Portfolio five: Interest rates stay higher for longer

Rates remain elevated, the cutting cycle is shallow, long bonds are a trap

This is the scenario in which cash genuinely competes with equity risk, which inverts the past decade of investor experience. It does not require a rebound in inflation, just for it to persist above target, leaving central banks unable to cut for fear of stoking further price growth.

It is in this context that the Bank of England and the Federal Reserve have both signalled that the floor for rates during the current cycle may be higher than during the post-2008 period.

The portfolio implications are uncomfortable for anyone whose mental model was set between 2009 and 2021. Cash and money market instruments are a changed asset class because, with a yield of 4 per cent or more, they compensate for a corresponding underperformance in equities, as the discounted rate of future cash flows suffers from higher-for-longer interest rates. Short-duration bonds can also play a role.

The other important asset class in this scenario is long-duration bonds, but only in the sense that investors should be wary of them as long as rates remain higher. These will remain a value trap until a sharp fall in interest rates raises their prices.

The structural hedge here is a modest gold allocation, not because gold competes with cash on yield, but because the higher-for-longer scenario is arguably also the one in which the institutional framework supporting those cash interest rates comes under the most strain. If political pressure for rates to ease increases and central bank credibility starts to fray, inflation expectations can rise, and cash is the asset that suffers first.

The five scenarios are not equally probable, but the test of a portfolio is not whether it passes the most likely scenario, but if it survives all of them at an acceptable cost.

Looking across the framework, two assets earn their place in three of the five future scenarios. Gold works in stagflation, dollar decline and higher-for-longer rates scenarios, and serves as tail-risk insurance in a fourth. Short-duration fixed income does well in recessions, dollar decline and higher-for-longer rates. Neither asset is particularly glamorous. But equities, and their unrivalled potential for long-term compounding, should not be forgotten. The possibility of geographical exposure outside the US market is also a serious option for investors looking for stockpicking options during downturns.

The honest answer to what investors should do remains: it depends on which world emerges. By organising according to scenarios, at least the portfolio that arises is the result of conscious decisions.

Recessions produce bargain prices that make 20-year compounding possible, but only for investors with the cash, the discipline and the time horizon to act on them. Holding 10 per cent of your portfolio in instruments that can be deployed quickly is not dramatically strategic, but it allows the next decade’s returns to be earned at sensible prices.

UKW 10.3% yield

This UK dividend stock is rising, but still offers a stunning 10.3% yield!

Shares in this dividend stock have had a poor five years, despite a great dividend track record. But might that be about to change? Let’s dig in.

Posted by Alan Oscroft

Published 14 May

DIVIDEND YIELD text written on a notebook with chart
Image source: Getty Images

You’re reading a free article with opinions that may differ from The Motley Fool’s Premium Investing Services.

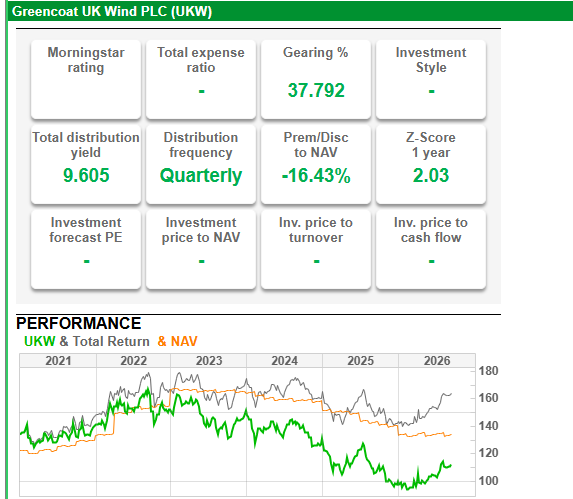
When we see a dividend stock with a forecast yield as high as 10.3%, it can be wise to be suspicious. It often means something has gone wrong with the company, and investors don’t trust the dividend. Dividend cuts and share price falls are often the outcome.

In this case, I’m talking about Greencoat UK Wind (LSE: UKW), and an interesting thing has been happening. Its share price has risen 10% since a 2026 low point in February.

It’s still down more than 20% over the past five years, but it does seem investors are taking a renewed interest in it. Let’s dig a bit deeper.

How does the dividend look?

Delivered a 12th consecutive year of dividend increases with or ahead of inflation

— Lucinda Riches C.B.E.

That quote is from the board chair, at full-year results time in February. It can’t be coincidence that that’s when the share price gains started.

The update also told us the “dividend policy will now be to aim to provide shareholders with an annual dividend that increases in line with CPI inflation“. That means a target of 10.7p per share in 2026, with the company aiming for long-term cover of two times by earnings.

The company made share buybacks of £109m too, and reduced its debt principal by £168m. Does this sound like a dividend stock that’s short of cash? No, I don’t think so, either. The feared cuts might be nothing to worry about after all.

Renewable energy struggles

It’s not all sweetness and light at Greencoat, however. And the main problem seems to be falling asset values, as the desire for renewable energy has waned under a political redirection towards oil.

At FY 2025 results time, Riches also spoke of “significant divestments” during the year. She added that capital plans for 2026 include “further divestments, reducing gearing, continuing share buybacks and a disciplined return to reinvestment“.

The following table shows how dividends have been rising over the past five years, but year-end net asset value per share (NAV) has been falling since 2022.

Year202120222023202420252026
Dividend7.19p7.72p10p10p10.35p10.7p (est)
NAV133.5p167.1p164.1p151.2p133.5p

The company, structured as a real estate investment trust (REIT), has strict debt management policies. That includes a limit on aggregate debt of no more than 40% of gross asset value at the time of drawing. The figure stood at 42% at 31 December — still within covenants, but clearly making investors a bit twitchy.

What should investors look for?

It seems a shame to me that Greencoat, while generating strong cash flow and paying increasing dividends, needs to dispose of some of the very assets its cash depends on.

Still, I expect we’ll see better focus in the future, retaining higher-valued assets. And I have little doubt that renewable energy will return to favour — hopefully before too much longer.

Despite the market’s apparent misgivings, I rate Greencoat UK Wind as a long-term dividend stock definitely worth considering.

« Older posts Newer posts »

© 2026 Passive Income Live

Theme by Anders NorenUp ↑