Dividend heroes: the investment trusts that have increased their dividends for 20+ years
Investment trusts can be a good option for income-focused investors – but which trusts have consistently increased their dividends over the past 20 years?
By Dan McEvoy
(Image credit: Klaus Vedfelt via Getty Images)
Twenty investment trusts have increased their dividend payment every year for two decades, according to the Association of Investment Companies (AIC). Ten of these so-called “dividend heroes” have gone a step further, stretching this track record to half a century or more.
Topping the list of these reliable income-paying investment trusts are the City of London investment trust (LON:CTY), the Bankers Investment Trust (LON:BNKR) and Alliance Witan (LON:ALW). All three have increased their dividends for 59 consecutive years.
Last year, Murray International Trust (LON:MYI) became the newest dividend hero, and it has retained its place in the list as it was able to increase its dividend payout in the most recent financial year.
Stay ahead of the curve with MoneyWeek magazine and enjoy the latest financial news and expert analysis, plus 58% off after your trial.
“Dividends serve a dual purpose for us,” said Richard Clode, co-manager of the Bankers Investment Trust. “They are an important component of the attractive long-term total returns we aim to deliver to shareholders in combination with capital growth.
“Dividends also provide capital discipline to the companies we invest in as well as to how we invest as we seek out companies that can generate long-term profit and cash flow growth,” Clode added.
Investment trusts have a unique structure which allows them to hold back up to 15% of their income each year in a dividend reserve. This can then be used in years when companies pay lower dividends than expected.
This feature can make trusts particularly attractive to income-focused investors. In periods like the coronavirus pandemic, when swathes of companies cut or paused their dividends, trusts were able to fall back on these reserves to deliver a smooth income stream.
Dividend heroes: which investment trusts have increased payouts for 20 years or more?
The full list of the 20 dividend heroes is below:
Investment trust
Number of consecutive years dividend increased
Dividend yield (%)
5-year annualised dividend growth rate (%)
City of London Investment Trust
59
3.91
2.31
Bankers Investment Trust
59
2.08
4.96
Alliance Witan
59
2.31
14.52
Caledonia Investments
58
2.22
3.79
The Global Smaller Companies Trust
55
1.67
12.03
F&C Investment Trust
55*
1.28
6.10
Brunner Investment Trust
54
1.78
4.50
JPMorgan Claverhouse
53
4.22
4.18
Murray Income Trust
52
4.40
3.15
Scottish American
52
3.15
5.82
Merchants Trust
43
4.85
1.43
Scottish Mortgage Investment Trust
43
0.37
6.15
Value and Indexed Property Income
38
7.08
2.66
CT UK Capital & Income
32
3.80
2.48
Schroder Income Growth Fund
30
4.25
3.13
Aberdeen Equity Income Trust
25
5.69
2.23
Athelney Trust
23
7.41
1.25
BlackRock Smaller Companies
22
3.49
6.25
Henderson Smaller Companies
22
3.26
3.57
Murray International Trust
21
3.63
2.61
Source: theaic.co.uk / Morningstar. Data at 12/03/26. * Dividend rise announced on 16/3/2026
Top dividend heroes in focus: three investment trusts that have increased dividends for nearly 60 years
The three trusts at the top of the list have increased the dividend income they generate for investors for 59 years, consistently raising payouts even through market upheavals like the inflationary 1970s, the dot-com bubble in the late 1990s, the global financial crisis of 2008 and the Covid pandemic.
City of London invests in companies listed on the London stock exchange; top holdings as of 28 February include HSBC (LON:HSBA), Shell (LON:SHEL) and British American Tobacco (LON:BATS). Of the three investment trusts that have increased their dividends for 59 consecutive years, City of London has the highest dividend yield, at 3.91%.
Alliance Witan also invests globally, with a focus on long-term capital growth and, of course, rising dividend payments. Its top holdings, as of the end of February, are Microsoft (NASDAQ:MSFT), Alphabet (NASDAQ:GOOGL) and Amazon.
The first estimate for income for the 2027 SNOWBALL is £10,290.
As the dividends are re-invested this figure will increase but it could be tempered, if any more shares trim their dividend but after the markets reaction to the NESF share price they may think twice before doing so.
The fcast remains £10,500 which should be achieved.
I’ve bought for the SNOWBALL 13000 shares in PHP for 13k.
The yield is 7.3%, which could be improved in just over a year as the buy precedes the xd date.
It may just be a holding position until markets settle down, which may not happen for a while but I get this itch if there is cash sitting in the account not earning its keep.
Combination between PHP and Assura successfully delivered, creating a £6 billion healthcare REIT investing in critical healthcare infrastructure
●
On track to deliver annualised synergies identified at the time of the merger of £9 million with £7.5 million or 83% of total annualised synergies already delivered since Competition and Markets Authority (“CMA”) clearance, as integration moves forward at pace and the benefits of the combination are delivered for shareholders
●
Good progress is being made on expanding the existing primary care joint venture and establishing a strategic joint venture for our private hospital portfolio, where we see exciting growth opportunities
EARNINGS AND DIVIDENDS
●
Adjusted earnings per share up 4% at 7.3 pence (2024: 7.0 pence)
●
IFRS earnings per share increased to 6.6 pence (2024: 3.1 pence) reflecting non-cashflow gains arising on the valuation of the Group’s property portfolio and interest rate derivatives
●
Annualised contracted rent roll now stands at £342 million (2024: £154 million) with rent reviews and asset management in the year generating an additional £9 million of annualised income, an increase of just under 7% over the previous passing rent or over 3% on an annualised basis, which supports our positive rental growth outlook
●
EPRA cost ratio 9.8% (2024: 10.1%), excluding Axis overheads and direct vacancy costs, representing one of the lowest in the UK REIT sector
●
Quarterly dividends totalling 7.1 pence (2024: 6.9 pence) per share distributed in the year, a 3% increase, and fully covered
●
Second quarterly dividend of 1.825 pence per share declared and payable on 8 May 2026, equivalent to 7.3 pence on an annualised basis and a 3% increase over the 2025 dividend per share, marking the start of the Company’s 30th consecutive year of dividend growth
The Company intends to maintain its strategy of paying a progressive, fully covered dividend
TRANSFORMATIONAL ACQUISITION OF ASSURA
●
Combination between PHP and Assura successfully delivered, creating a £6 billion healthcare REIT investing in critical healthcare infrastructure
●
On track to deliver annualised synergies identified at the time of the merger of £9 million with £7.5 million or 83% of total annualised synergies already delivered since Competition and Markets Authority (“CMA”) clearance, as integration moves forward at pace and the benefits of the combination are delivered for shareholders
●
Good progress is being made on expanding the existing primary care joint venture and establishing a strategic joint venture for our private hospital portfolio, where we see exciting growth opportunities
EARNINGS AND DIVIDENDS
●
Adjusted earnings per share up 4% at 7.3 pence (2024: 7.0 pence)
●
IFRS earnings per share increased to 6.6 pence (2024: 3.1 pence) reflecting non-cashflow gains arising on the valuation of the Group’s property portfolio and interest rate derivatives
●
Annualised contracted rent roll now stands at £342 million (2024: £154 million) with rent reviews and asset management in the year generating an additional £9 million of annualised income, an increase of just under 7% over the previous passing rent or over 3% on an annualised basis, which supports our positive rental growth outlook
●
EPRA cost ratio 9.8% (2024: 10.1%), excluding Axis overheads and direct vacancy costs, representing one of the lowest in the UK REIT sector
●
Quarterly dividends totalling 7.1 pence (2024: 6.9 pence) per share distributed in the year, a 3% increase, and fully covered
●
Second quarterly dividend of 1.825 pence per share declared and payable on 8 May 2026, equivalent to 7.3 pence on an annualised basis and a 3% increase over the 2025 dividend per share, marking the start of the Company’s 30th consecutive year of dividend growth
The Company intends to maintain its strategy of paying a progressive, fully covered dividend
Previous trends dominated by a handful of companies in a concentrated global stock market
Tom Stevenson writes about investment for fund manager Fidelity International following a 20-year career in financial journalism, most recently at the Daily Telegraph.
Published 08 January 2026
Best performers have been the funds with an uncomplicated goal and a broad investment canvas Credit: Manusapon Kasosod/Moment RF
As I select my annual fund picks each January, I’m reminded of Samuel Johnson’s quip about second marriages. “A triumph of hope over experience” is a bit harsh for my situation – my win percentage has been better, and they’ve cost me less. But it is a yearly reminder that picking funds is trickier than it looks.
For the record, this year’s recommendations are: the Dodge & Cox Worldwide Global Stock Fund; Fidelity Special Situations; and Lazard Emerging Markets. Together, they are the distillation of my latest investment outlook, also published this week. This, like those of many of my fellow pundits, errs as much towards hope as experience, three years into a remarkable bull market.
With earnings rising, valuations outside the US undemanding, and interest rates coming down, it is tempting to think all will be well. But my optimism is tempered by caution and expressed with fingers crossed. A fourth consecutive year of rising stock markets would be welcome but unusual.
The Dodge & Cox fund is a value-focused global portfolio with a big underweight to the US. It assumes a continuation of the rotation out of America that we started to see last year. Fidelity Special Sits will benefit if a proportion of that money flows across the Atlantic to what is now one of the world’s cheapest markets. For the Lazard fund to deliver, emerging markets will need to build on last year’s surprising outperformance of the US. Obviously, I think those scenarios are likely, but I offer the picks with the usual dollop of humility.
So I swing a bottle against the hulls of these three funds and wish them well. For now, though, I’m more interested in looking back to see what, if anything, I can learn from my earlier recommendations. As part of this year’s fund picks process, I tracked the performance of all my picks since 2016 that have had at least five years to run. Those up to and including January 2021.
The good news is that of the 23 fund picks I made over those six years, just one lost investors’ money if held to the end of 2025. The less good news is that in most of those years, a portfolio evenly shared between all the fund picks did not do much better than a passive fund tracking the MSCI World index over the same period.
The first lesson from ten years of fund picks, therefore, is that while some active managers beat the market, many do not – and knowing the difference ahead of time is hard.
The second lesson, however, is that the past is a poor guide to the future. The last ten years has been an unusual period, dominated by a handful of companies in a very concentrated global stock market. It has been extremely difficult to beat the global index unless you had a basket of investments heavily skewed towards America’s technology giants.
Given their stellar performance, and their massive contribution to the global index, being underweight has meant, almost by definition, underperforming the benchmark. It’s been a testing time to be a stock picker, but that could easily change.
The third thing I’ve learnt from a decade of trying to beat the market is that patience is a virtue that few of us possess in sufficient quantities. The best example of this was provided by 2020’s recommendation of the Artemis Smart GARP Emerging Markets fund. This pick lost more than 20pc of its value when Covid struck just weeks after my recommendation. It then took four years to achieve just a 40pc return on the initial investment, but then doubled that gain in just six months this year as emerging markets zoomed back into favour. It has been a long haul, but in the end a satisfactory investment.
The fourth lesson I have learnt from my picks is that when you find a well-managed fund the best thing you can do is to put it in a metaphorical drawer and forget about it. I was lucky enough to find my best-performing fund pick in my first year of trying. Rathbone Global Opportunities delivered in 2016 and, with the exception of a painful 2022, when interest rates rose sharply, has continued to do so ever since. An investor who put £100 into the fund at the start of 2016 has £320 today. Even the tech-heavy world index has only risen to £250 over that 10-year period.
Lesson number five has been to keep it simple. The best performers have been the funds with an uncomplicated goal and a broad investment canvas. Like Rathbone’s global growth remit, the Fidelity Global Dividend Fund has a simple objective – high quality dividend growers. I recommended it in 2019 and 2020. Since the first pick, it has doubled investors’ money in seven years.
The final lesson I take from the past decade’s fund picks is the need to accept your mistakes and move on. While patience can be a virtue, inaction can be a drag on your returns too. As a rule, taking a year’s worst performer and reinvesting the proceeds in the year’s best fund would have significantly improved the overall return in subsequent years. Sometimes you just get it wrong and there’s no shame in switching horses. Investment success is about having more winners than losers, and in running the former while cutting the latter.
Picking the right funds without the benefit of a crystal ball is hard. I’ve tested this to destruction over the past ten years. But it is more than just hope over experience. It’s investing with your eyes open. Because a bride at her second marriage doesn’t wear a veil – she wants to see what she is getting.
Tom Stevenson is an investment director at Fidelity International. These views are his own
The 25 best funds for your Isa – picked by our experts
The Telegraph 25: Our annual list of investments to grow, protect and diversify your wealth
James Baxter-Derrington
James is Investment Editor at The Telegraph.
Published 11 March 2026
Every year, Telegraph Money identifies its favourite investment funds – read on to see which ones have made the cut this time.
Markets are complicated beasts and the past few years have only proved that theory. Rumours of recessions and bubbles abound, while governments twist themselves in knots in pursuit of growth.Wars, tariffs and myriad unknown risks continue to crop up, and it seems more difficult than ever for investors to build a long-term view of the world.
Inflation and higher interest rates were seemingly tamed, but now threaten to return because of a combination of international strife and domestic mistakes.
There are professionally managed funds to arm yourself against such difficulties, but the wide range on offer can make choosing one a daunting prospect.
Enter Telegraph 25, a list of our favourite investment funds. It is a mixture of those that we believe will grow your money in the long run, some that provide income, others with strategies that will protect your savings when markets fall, and ones we think offer an exciting opportunity.
We aim to choose funds that can stand the test of time. Even with so much uncertainty right now, these funds should do what we need them to.
As ever, investors must remember that this list is not an off-the-peg portfolio to pump your money into and forget about. DIY investing requires you to understand the risks you are taking and conduct your own research to ensure that an investment fits your needs and blends with others that you already hold.
Neither do we recommend buying all the funds on the list at the same time. The funds and their aims must be considered and match the aims and objectives of the investor.
Some funds on the list have been chosen expressly because they can be relied on to do several jobs well without the need for close monitoring. Others, however, take more risk by design.
When buying open-ended funds, investors must also consider whether they seek income or accumulation shares. Income will pay out any dividend directly to your account, whereas accumulation will automatically reinvest these payouts.
The Telegraph 25 is designed to highlight investments that are the best in the field they operate in and that we believe will give the best returns for the risk being taken. Unless we make clear to the contrary, they are intended for long-term investors who want a home for their money for five, 10 or even 20 years.
We have divided the list into five sections: British funds, world funds, income funds, wealth preservers, and wild cards.
How much you will pay your Isa manager
Investing is for the long-term, and we take that seriously at Telegraph Money. Long-standing readers will recognise the vast majority of names on this list. We don’t take the decision to replace a fund lightly, and one difficult year won’t be enough to end our conviction. However, if a better opportunity is out there, we won’t ignore it. Keep your eyes peeled for several additions scattered throughout.
1. iShares UK Equity Index
An investment in the domestic economy should be a core consideration for any investor and there is no simpler way to own it all than with a passive fund. To access the UK markets, this price remains hard to beat.
Value investing has not been so popular during the “magnificent seven” era but managers Ian Lance and Nick Purves’s portfolio of British stocks, including BP, ITV and Marks & Spencer, is a good option for those seeking reliable dividends.
With a more specific mandate than wider funds, this trust aims to deliver a total return in excess of the FTSE 250 (excluding trusts) and, over various time frames, it has achieved its goal. This fund is a new addition to our list. Offering 27.6pc last year, and more than 130pc in 10 years, it continues to outshine its benchmark – even if it’s slightly pricey.
With benchmark-smashing returns yet again in 2025, Alex Wright, its manager, continues to shake off previous difficult years. Over both five and 10 years, the trust has far outstripped the wider market. As markets continue to scare easily, value investing offers a great opportunity, and this trust features underpriced gems.
It has been a tricky few years for this fund as successive managers have tried to wrestle with both the portfolio and the distinctly harsh atmosphere for the UK’s smallest companies. We have stuck with it through the bad and it appears our faith has paid off as performance continues to climb.
Baillie Gifford’s flagship fund had a tough few years as interest rates rose, but it offers exposure to a concentrated portfolio of high-growth stocks, including Elon Musk’s SpaceX and Nvidia.
This multi-asset fund stands out for its unique fee structure. Investors only pay if the fund outperforms its benchmark; if it underperforms, they get refunded. This should mean the management team is highly motivated to deliver superior returns. Alec Cutler, the fund’s manager, takes a contrarian approach and prides himself on finding overlooked opportunities.
Charge: 0pc base fee with refundable performance fee of 40pc of out-performance refundable at 40pc for under-performance | Cheapest share class: Standard | Five-year return: 126.2pc
9. JP Morgan American Investment Trust
Although this trust had a tough year, it still managed double-digit returns – and over 10 years has shone brightly, with a 349pc return. This blend of value and growth investing offers diversification without sacrificing performance, and should also defend when markets turn.
Charge: 0.35pc | Ticker: JAM | Five-year return: 104.6pc
10. JP Morgan Emerging Markets Growth & Income Investment Trust
This is another fund that has proved it is worth sticking with, and the experience of Austin Forey continues to right the ship in yet another tough year. We will continue to monitor performance but keep the faith in this £1.4bn trust.
Rounding out thetrinity of core holdings, any investor must consider owning the S&P 500 as cheaply as possible. Consider this to complement your UK and global tracker funds.
Since appointing Nish Patel as manager, the Global Smaller Companies Trust has continued to justify its 137-year existence. It is one to continue monitoring but it has happily maintained performance against comparable funds investing in the same space.
This £2.3bn fund, which is a new addition to our list, has a concentrated holding of 31 companies ranging from Deutsche Bank to Ryanair, and has outperformed an already impressive European market in recent years. Managers James Inglis-Jones and Samantha Gleave continue to impress with top-quartile performance over every period.
For investors who want a stake in property, this trust is an excellent starting point. The company is invested in a combination of direct holdings in bricks and mortar and UK and international property shares. With a 4.7pc yield and an attractive 11pc discount at the time of writing, it remains worth consideration.
This stalwart fund has had a tough year, but with top-quartile performance over three, five and 10 years, Artemis Income remains a strong option for both income and capital growth.
For those looking for geographic diversification, Guinness Asian Equity Income offers a high-conviction approach to dividend-paying companies in the Asia-Pacific region.
Despite losing two managers in the same year, Schroder Income maintains a strong team – including a founding member of the firm’s Global Value team. With this and a solid track record in mind, we’re happy to keep the faith for now. The fund mainly invests in above-average yielding equities in order to beat the FTSE All-Share, and we will monitor its future performance.
King of the dividend heroes, this trust has raised its payout for 59 years and counting. Holding a stable of famous yielders and with a strong reputation, it is one of the few trusts to command a (small) premium.
There are very few periods of discrete performance in recent years where this trust dips into the red. Beyond protecting your wealth from erosion, capital growth has also been impressive. For those seeking a smoother ride, it is worth knowing.
A favourite of financial advisers. One of the cheapest and simplest options for those who do not have the time or inclination to think about investing. Each of the five portfolios offers a different exposure to shares, from 20pc to 100pc, with the remaining chunk held in bonds. Invested across Vanguard tracker funds, managing risk has rarely been so easy to understand.
The first port of call for an investor seeking to diversify, there is a reason Ruffer holds its reputation. This fund remains the essential holding for investors who want something to rise when everything falls.
After decades in the cold, it seems Japan may have finally risen again. Since clawing its way back to its 1989 peak just a couple of years ago, the Nikkei 225 has risen a further 40pc – and with new regulation on the horizon to force companies to start spending their large cash reserves, there’s plenty of room to run. A top-quartile performer over one, three and five years, this fund is worth considering, and is a new arrival on our 2026 list.
This fund invests in biotechnology, pharmaceutical and life sciences firms from around the world. David Pinniger, its manager, has delivered outperformance against the very strong Nasdaq Biotechnology Index every year over the past decade.
Another Telegraph 25 staple, Dale Nicholls’ offering is a standout performer, even if the investment case for China is more uncertain than it once was. While the five-year performance figure looks bleak for this trust, this is a result of unfortunate timing more than anything else. Five years ago Chinese markets reached an all-time high, before regulatory pressures and the AI boom in the US sucked the wind out of its sails. Even so, this industry darling weathered the storm better than most – and with a 40pc return over 2025 and a near 200pc return in 10 years, we’ll stick with this wild card.
abrdn UK Smaller Cos Growth Trust PLC ex-dividend date Diverse Income Trust PLC ex-dividend date HgCapital Trust PLC ex-dividend date Law Debenture Corp PLC ex-dividend date Life Settlement Assets PLC ex-dividend date Patria Private Equity Trust PLC ex-dividend date
Tech mania fanned by the dawning of the internet age inflated the dotcom bubble to maximum extent, on this day in 2000.
By Chris Carter
last updated 10 March 2020
(Image credit: Chris Hondros/Getty Images)
It only takes a pin to burst a bubble. And on Friday, 10 March 2000, that’s exactly what we got. On that day, the tech-heavy Nasdaq Composite index reached its pinnacle at 5,132.52, ending the day at 5,048.62. The dotcom bubble that had been inflating since 1997 finally popped. When traders returned to their desks after the weekend, it was to months of misery.
It’s not hard to see what had got them so excited in the first place. The dawning of the internet age during the 1990s seemed like a genuine revolution of the way we live our lives, from doing our shopping online to emailing and research. In many ways, it was a revolution.But in the frenzy to grab a piece of the pie, investors piled in to whatever happened to end in .com. Between 19 October 1999 and 10 March 2000, the index rose by an astonishing 87.8% in less than six months.
Out went the tried and trusted valuation metrics all the ones that we at MoneyWeek are such fans of. All that mattered was that a hot, young tech company had enough cash to expand its customer base beyond the reach of its peers, measured by its “burn rate” ie, the amount of cash a company could burn through before it went bust.Article continues below
Stay ahead of the curve with MoneyWeek magazine and enjoy the latest financial news and expert analysis, plus 58% off after your trial.
Some companies did survive the bursting of the bubble, such as Amazon and Google. But many didn’t, or were sufficiently hobbled by the fallout to be terminal cases. Anybody remember GeoCities?
By December 2000, nine months after hitting its peak, the Nasdaq Composite had more than halved. While the end of the dotcom debacle is considered to be 2003, it wasn’t until last summer that the index overtook its 2000 high, having slumped as low as 1,293 in the wake of the 2008 financial crisis.
In longer ‘compound’ performance terms, 2025’s +24.7% return comes on the back of 2024’s +35.6 % and 2023’s +46.4%, a solid +106.7% return over the past three financial years, representing a +2.7 percentage point outperformance of the benchmark index over that time. Of course, those with a longer memory will point out 2022’s -33.6%. The point I make is twofold – the volatility associated with the tech sector can be painful, but the rewards when they do come have also been substantial. This is the balance one has to remember when investing in tech.
If you are looking for a share for your Snowball to provide the TFLS for your Snowball, tech is one area you could research.
2022’s -33.6% so not a consideration for the SNOWBALL.
A solid +106.7% return over the past three financial years
IF you get your timing right it could provide cash for your Snowball and still retain your stake in the company.
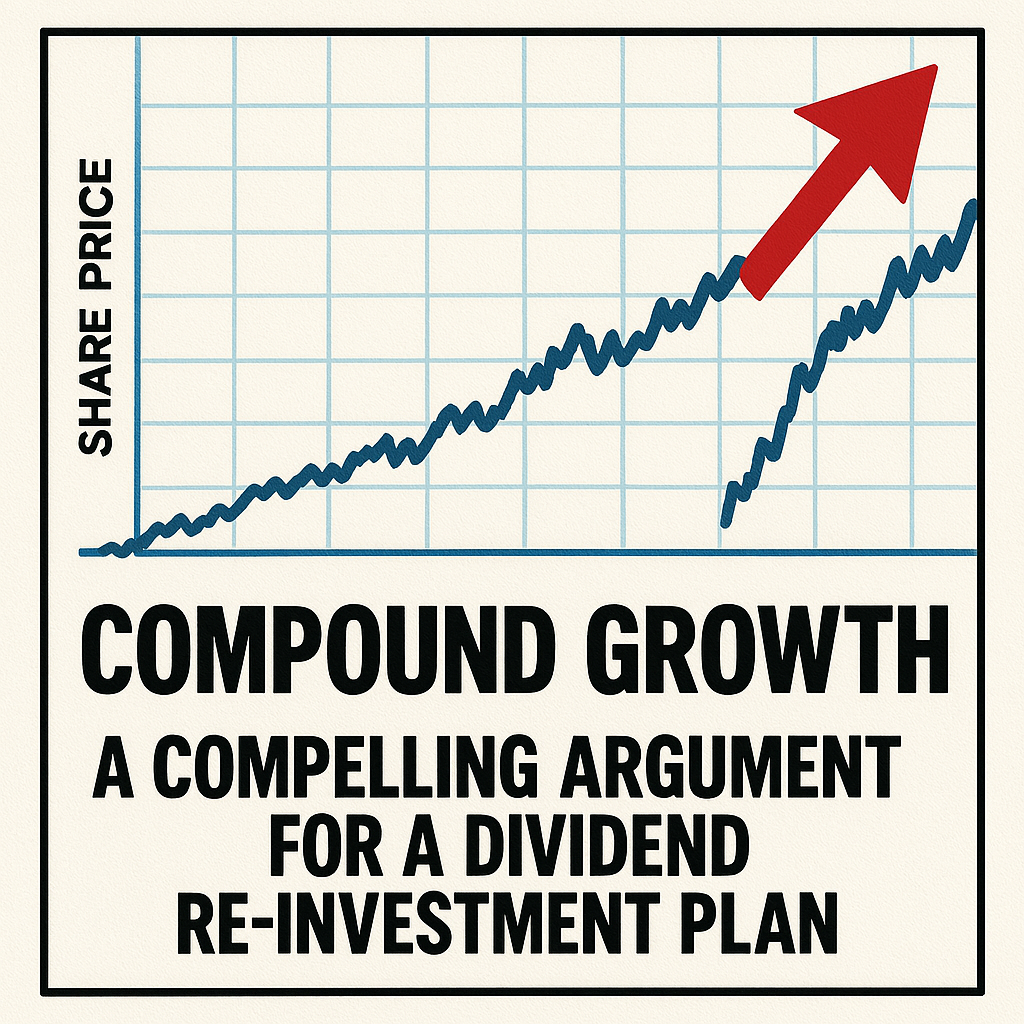
Dividends delivered more than half of FTSE 100 returns over the past decade
First published: 05:44 14 Mar 2026 GMT
As growth stock valuations stretch and SaaS shares slide, data from Bowmore Asset Management puts the case for income investing back on the table, from London to Singapore.
Dividends accounted for 52% of the total return of the FTSE 100 over the last 10 years, according to research by Bowmore Asset Management, a finding that puts the often-overlooked role of income at the centre of the long-run equity performance debate.
The data arrives at a telling moment. After years in which growth investing dominated, with technology and software companies routinely outpacing income-focused strategies, the tide is shifting. Stretched valuations on growth stocks and a recent rout in software-as-a-service shares have reminded investors that high multiples carry real risks.
The Asia Pacific picture
The pattern extends far beyond the UK. Over the 20 years to November 2025, dividends drove 56% of total equity returns across the Asia Pacific region, suggesting that income’s contribution to long-run performance is not a quirk of the British market but something more fundamental.
The macro backdrop reinforces the case. Global dividends reached a record $519bn in the third quarter of 2025, up 6.2% year-on-year, reflecting broad corporate health and a continuing commitment to returning cash to shareholders.
Why income is back in favour
James Woodman, Investment Director at Bowmore Asset Management, frames the shift in investor sentiment as a direct response to valuation concerns in growth markets.
“The multiples on many growth stocks no longer look attractive, which is why investors are looking at higher-yielding shares,” he says. “Growth shares have taken a hit recently and are at risk of a larger correction. At the same time, corporate governance reforms globally continue to drive dividend growth.”
Equity income investing focuses on generating returns through steady cash flow rather than relying solely on share price appreciation. The approach tends to favour sectors with resilient earnings, including utilities, consumer staples, financials and energy.
Dividends as a sign of strength, not stagnation
The research also pushes back on a persistent misconception: that dividend-paying companies are mature, slow-moving businesses that have run out of growth ideas.
Woodman is direct on this point. “Dividends are not a sign that a company has run out of ideas. They are a sign of financial strength and rational capital allocation. Returning excess cash to shareholders allows investors to redeploy it into new opportunities rather than leaving it tied up in projects that may not generate attractive returns.”
The argument positions income investing not as a defensive retreat, but as a disciplined approach to capital that serves investors across market cycles.
FTSE 100 total return: dividends vs price alone
The chart illustrates the cumulative divergence between the FTSE 100 total return index, which includes reinvested dividends, and the price return index over the past decade. Over time, the compounding effect of dividends accounts for a substantial share of the gap.