What’s the right balance of growth and income shares for a SIPP?
Story by Christopher Ruane
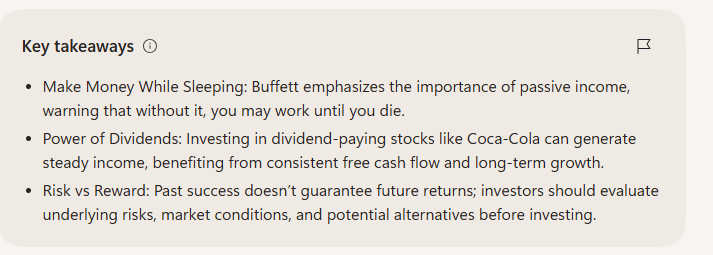
Key takeaways
Investment Strategy: Consider a mix of growth and income shares based on your retirement timeline, objectives, and risk tolerance. Growth shares can benefit from long-term business development, while income shares provide steady dividends.
Income Quality: Focus on the source and sustainability of dividends. High yields today may not last if the underlying business is weak. Look for companies with proven cash flow and growth prospects.
Personal Goals: Define whether your SIPP aims for capital gains or regular income, and adjust your portfolio accordingly. Understanding your financial needs in retirement is key to choosing the right balance.
Pensions, for many of us, seem a long way off until they don’t. So a lot of investors pay too little attention to their Self-Invested Personal Pension (SIPP) for a long time before later scrambling to try and bulk it up as retirement draws closer.
This can raise the question of how to strike the right balance between growth and income shares for a SIPP.
This can raise the question of how to strike the right balance between growth and income shares for a SIPP.
Why growth can make sense in a SIPP Each investor is different, of course, so there is no one correct answer. Some investors may even feel there is no need to balance, for example plumping for putting their whole SIPP into income shares in the hope of steady passive income streams.
This is understandable. Retirement costs money and pensions may be the only source of income at that point.
But I think the long-term nature of investing for retirement in a SIPP can provide the sort of timeline in which some growth shares are able to shine, as their businesses prove themselves and then develop.
Understand your objectives and risk tolerance Part of this process will also depend on what someone is looking for from their SIPP, in terms of investment objectives.
Some people will hope dividends from the SIPP can form a significant part of their income in retirement. Others will be looking for the prospect of capital gain and may place a lower value on dividends.
Getting clear about your objectives and your risk tolerance (how much risk is willing to be taken in search of the targeted level of reward) is always an important part of any investing. This is true when it comes to deciding how to invest the money in a SIPP too. Thinking about income and the source of income One of the things I think is important when it comes to any income shares is trying to dig into the source of income. Where is it coming from? How likely is it to last?
Some investment trusts or companies may offer a high yield today, but in a way that seems ultimately unlikely to be sustainable over the long term. Maybe the business is in decline, or the trust’s spare cash is being eaten up.
Few investors come close to matching the exceptional track record of billionaire Warren Buffett. The ‘Oracle of Omaha’ has steered his investment firm to generate close to a 20% average annualised return since the 1960s. So it’s no surprise that when Buffett gives advice, investors listen… carefully.
And with the cost of living continuing to rise, his previous tips about the need to earn passive income are now more relevant than ever. After all, “If you don’t find a way to make money while you sleep, you will work until you die”, he famously said.
With that in mind, here’s how any investor can immediately start earning a passive income overnight.
The power of dividends
While many investment portfolios tend to be geared towards growth, it’s easy to overlook mature, boring dividend-paying stocks. After all, why would you invest in a dull self-storage enterprise when there are bleeding-edge biotechs curing cancer?
However, despite the lack of excitement and attention, income stocks nonetheless drive the bulk of shareholder returns over the long run. And that’s especially true for UK shares, which offer some of the most generous dividends in the world.
So how do investors tap into all this passive income potential? It’s simple. All they need to do is buy shares in a dividend-paying company, and wait for the money to come rolling in (usually once every quarter).
But is it really that simple?
Risk versus reward
The most lucrative dividend stocks over the long run aren’t necessarily the ones with the highest yields today. Instead, it’s the businesses that generate exorbitant volumes of consistent free cash flow that not only fund shareholder payouts but also enable them to grow over time.
That’s a lesson Buffett has learned first hand with his investment in Coca-Cola (NYSE:KO). The soft drinks giant has used its consistent and steady cash flows to increase dividends every year for 63 years in a row. And consequently, Buffett’s now earning more than a 60% yield on his original investment in the late 1980s.
Does that make Coca-Cola a no-brainer today?
Sadly, past performance doesn’t guarantee future results. And if investors blindly buy previously successful income stocks without investigating the underlying risks or potential rewards, their passive income could quickly disappoint.
You’re reading a free article with opinions that may differ from The Twelfth Magpie’s Premium Investing Services.
Property investments have long since been a terrific way to generate a second income stream. Buy-to-let strategies have yielded fantastic results over the years. But more recently, tax changes, rising property prices, and higher interest rates have made the barriers to entry significantly higher for the everyday investor.
Fortunately, there’s a clever alternative that not only allows the average Joe or Joanne to tap into the real estate sector for income, but also do it entirely passively.
A hands-free real estate income stream
One of the easiest ways to start investing in this space is by using a real estate investment trust, or REIT. This special vehicle behaves and trades like a regular stock, allowing money to be added or withdrawn almost instantly – a massive liquidity advantage.
The underlying business is essentially a portfolio of properties actively managed by a team of experts and designed to generate regular cash flow, typically through rent, which is then returned to shareholders as a dividend.
What’s more, since REITs are traded like regular stocks, they can be put inside a Stocks and Shares ISA, removing taxes from the equation – another terrific advantage over classic buy-to-let.
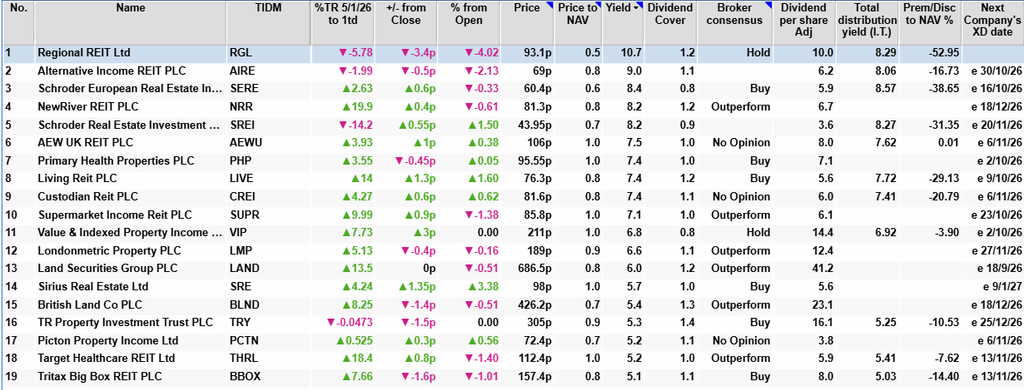
Even with as little as £500, there are plenty of REITs on the London Stock Exchange to choose from, each focusing on its own types of property. It’s not just residential housing but also hospitals, carparks, wind farms, logistical hubs and many more.
Please note that tax treatment depends on the individual circumstances of each client and may be subject to change in future. The content in this article is provided for information purposes only. It is not intended to be, neither does it constitute, any form of tax advice.
A REIT to consider?
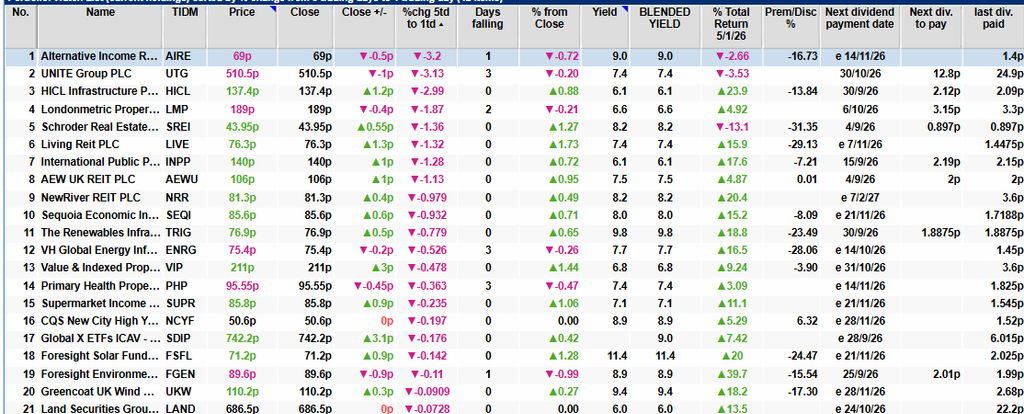
Of all the stock market real estate opportunities available right now, LondonMetric Property (LSE:LMP) is among my personal favourites. The group specialises in triple-net, long-term leasing real estate with a particular knack for urban logistics.
With tenancy agreements typically spanning over a decade, the group has had little trouble maintaining exceptionally high occupancy levels even as UK economic conditions suffered. And following its merger with LXi REIT in 2024, along with further bolt-on acquisitions in 2025, the company’s been leveraging its impressive cash flows to absorb its weaker rivals and expand market share.
This has ultimately culminated in a decade of continuous dividend growth as well as its introduction into the FTSE 100 earlier this year. And with a 6.8% dividend yield still on offer, the second income investors could generate from buying shares remains substantial.Zoom1M3M6MYTD1Y5Y10YALL
Every investment carries risk
As much as I admire the operational excellence of this business, I’m not blind to the risks it faces. While its long-term rental contracts have provided the cash flow needed to keep its leverage under control, higher interest rates have nonetheless negatively impacted the valuation of its property portfolio. And with a number of key leases coming up for renewal, lease pricing may be renegotiated downward.
Nevertheless, management’s solid track record makes me cautiously optimistic. And with a valuation driven by short-term weakness in property valuations rather than rental cash flows, I feel these shares are a terrific opportunity for investors to potentially unlock a substantial long-term second income. Of course, there are also plenty of other REITs to explore as well.
ADX vs ARCC: two very different income vehicles — one an equity closed‑end fund (ADX), the other a giant private‑credit BDC (ARCC). The short takeaway: ADX = equity exposure + deep discount + 7.3% yield, while ARCC = private credit + 9.6% yield + steadier earnings. They serve different roles in a portfolio.
Below is a structured, side‑by‑side comparison using the latest sourced financial data.
Implication: ARCC is a credit‑income machine. It performs best when defaults stay low and rates stay high. It is less volatile than equities but carries credit‑risk and leverage‑risk.
Adams Diversified Equity Fund and Ares Capital Corp. stand out as high-quality income vehicles with strong track records and distinct risk profiles.
ADX delivers an 8% annualized distribution from a diversified, actively managed large-cap equity portfolio, mainly funded by capital gains, with total returns beating the S&P 500.
ARCC provides a stable 10% yield from private credit, supported by a diversified loan book, low non-accruals, and a 17-year record of stable or growing dividends.
Both trade near NAV/book value, offering fair entry points, with ADX distributions taxed as capital gains and ARCC as ordinary income—key for after-tax returns.
gargantiopa/iStock via Getty Images
(A Way Too Long) Introduction
I remember that in the very first book on investing I ever read (I think I was 14 or 15 back then), it included a story about people who were so frugal that they collected shower water in buckets to water the plants and used thick blankets to keep heating to a minimum during winter.
Unfortunately, I have no idea who this was about and what eventually happened to them (I don’t even know the name of the book anymore), but I thought about that a lot. I’m a bit frugal, too, but only relatively speaking. I don’t do any weird things, and I’m known to spend a lot of money on things if it makes my life even a tiny bit easier (I’m also a bit lazy in some regards).
There are a number of reasons why I’m not a typical compounder from the FIRE movement who saves every penny and cuts costs to the bone just to retire early. One of them is that no new day is guaranteed. Don’t forget to enjoy life. I know so many people who earn below average, yet I am pretty sure that they have happiness levels way above the levels of many millionaires. Also, I am very blessed to make OK money, which means I don’t have to turn over every penny (or euro cent, in my case) before making a purchase.
Having said all of this, my biggest message to people isn’t to be overly frugal, but to focus on growing one’s salary/income. Income is our most powerful lever, as that’s the money that comes in every month. And while this is Seeking Alpha, where I believe many people are good at picking stocks, in general, I tell people to just buy ETFs and focus their energy on getting a higher income.
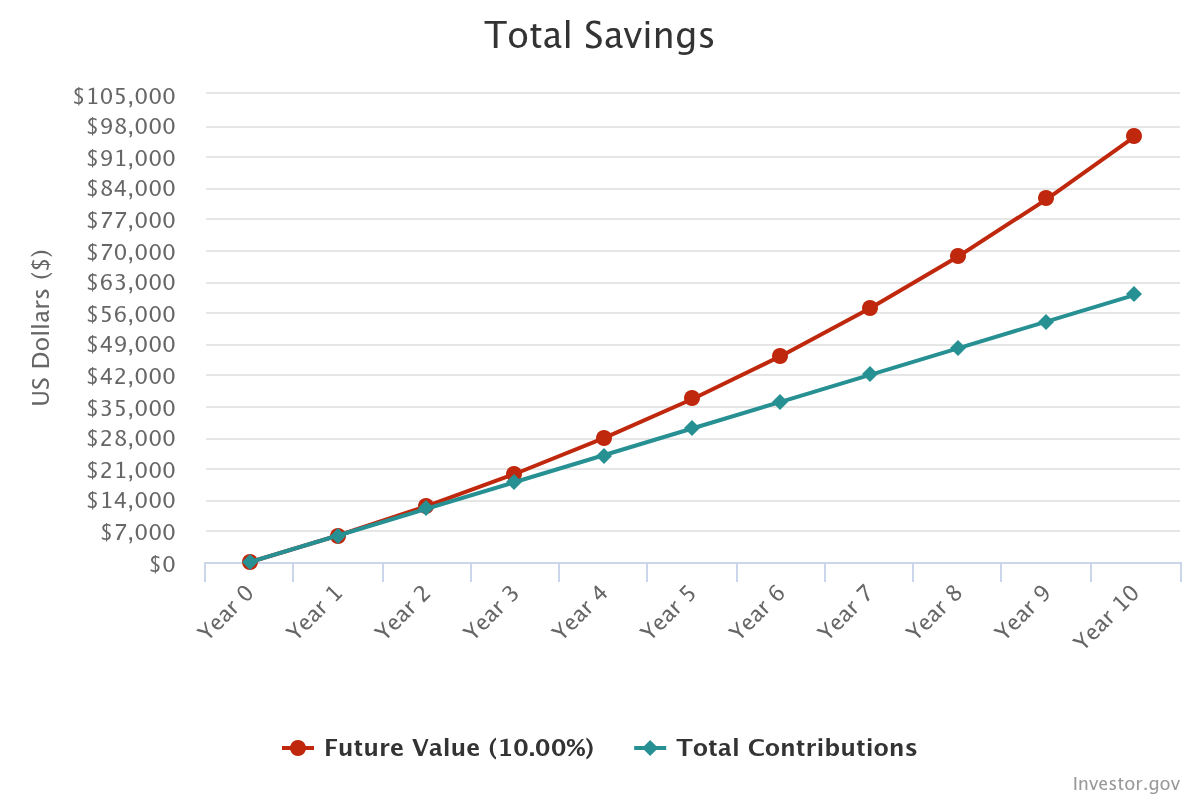
I hope it doesn’t sound condescending, but someone who spends weeks thinking about where to invest $500 or $1,000 is way better off buying an ETF and just excelling at their job (which is hopefully based on their passion). If your income grows by just $500 a month, and you invest all of it, you end up with almost $100,000 after ten years based on no initial investment and 10% annual returns (see below).
Compound Interest Calculator
It’s purely theoretical, but you get the point.
Then, there are costs. As important as income may be, costs can be huge pitfalls. Just think about overly expensive rents, that car you want but don’t need that costs $700 in monthly payments, or that addictive hobby (think of sports betting). Or even eating out and stuff like that.
It is so incredibly easy to waste a lot of money.
Another great example of costs is the Kiplinger ranking of the richest counties in the U.S. That ranking took the cost of living into account, as it adjusted the median household income for the cost of living. For example, if I earn 10% above average in a given city but have to deal with 25% higher costs, I don’t really win, do I?
To give you a real example from the article, Stafford County is the 18th-richest county on paper. But after adjusting for costs, it’s the third-best. Falls Church drops from 5th to 8th place due to 21% higher-than-average costs.
By the way, the winner was Loudoun County, Virginia. As some/many of you may know, it’s where many defense contractors are. It’s where Washington Dulles International was built in the 1960s. It is a massive data center market, and many people have high degrees. Also, its cost of living is 13% above the U.S. average, which isn’t horrible in light of its income profile.
And that’s what the second part of this article is about, as I focus on high-quality income where costs are under control and risks are acceptable. After all, we’re talking about 8% and 10% income, which is usually an area where I get extremely careful due to the risks that come with seriously elevated income.
That’s also why taxation and other costs are important, as we don’t want to waste our capital on items like tax before we get to decide what to do with it.
Now, let’s get to it!
Adams Diversified Equity Fund (ADX) – The One That Pays 2% Each Quarter
In a recent article, I brought up PEO, which is the Adams Natural Resources Fund (PEO).
ADX is similar, as it’s also a closed-end fund (“CEF”). However, unlike PEO, ADX brings a lot of diversification to the table, which is a great thing if you want to avoid stock picking. And, for many investors who focus on income, avoiding stock picking and the related costs (think of transaction costs) is a great way to keep more of your income (which brings me back to the intro of this article).
With that said, ADX has been around for a long time, as it was founded in 1929. And because there are many CEFs on the market, I need to add that this one is special, as it’s an actively managed one that doesn’t use leverage and focuses on large-cap U.S. stocks.
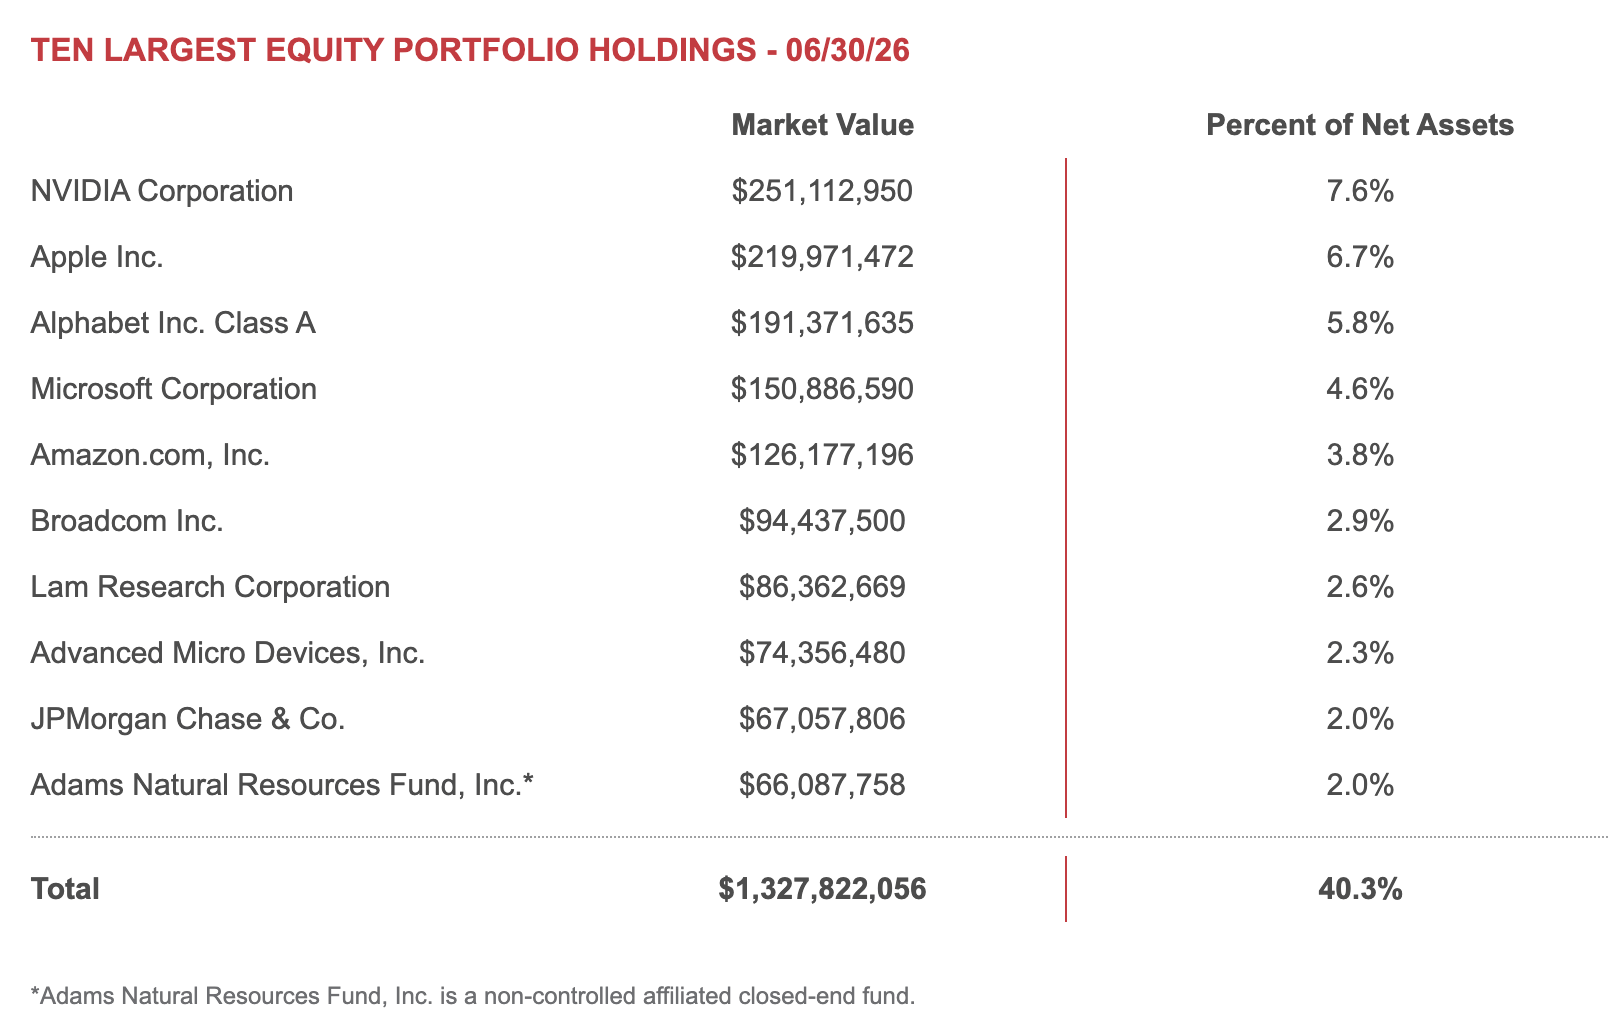
Here’s the current list of its biggest holdings. Note that it also owns PEO (2% exposure).
Adams Diversified Equity Fund
The problem is that, as much as I love most of these stocks, they don’t provide much income.
ADX, however, pays 2% per quarter in distributions (dividends). That’s 8% per year.
So, how does that work?
There are multiple ways for CEFs to pay distributions. That’s almost obvious, as there’s no way you can get 8% income from a fund that owns some of America’s biggest companies that all yield way less than 8%.
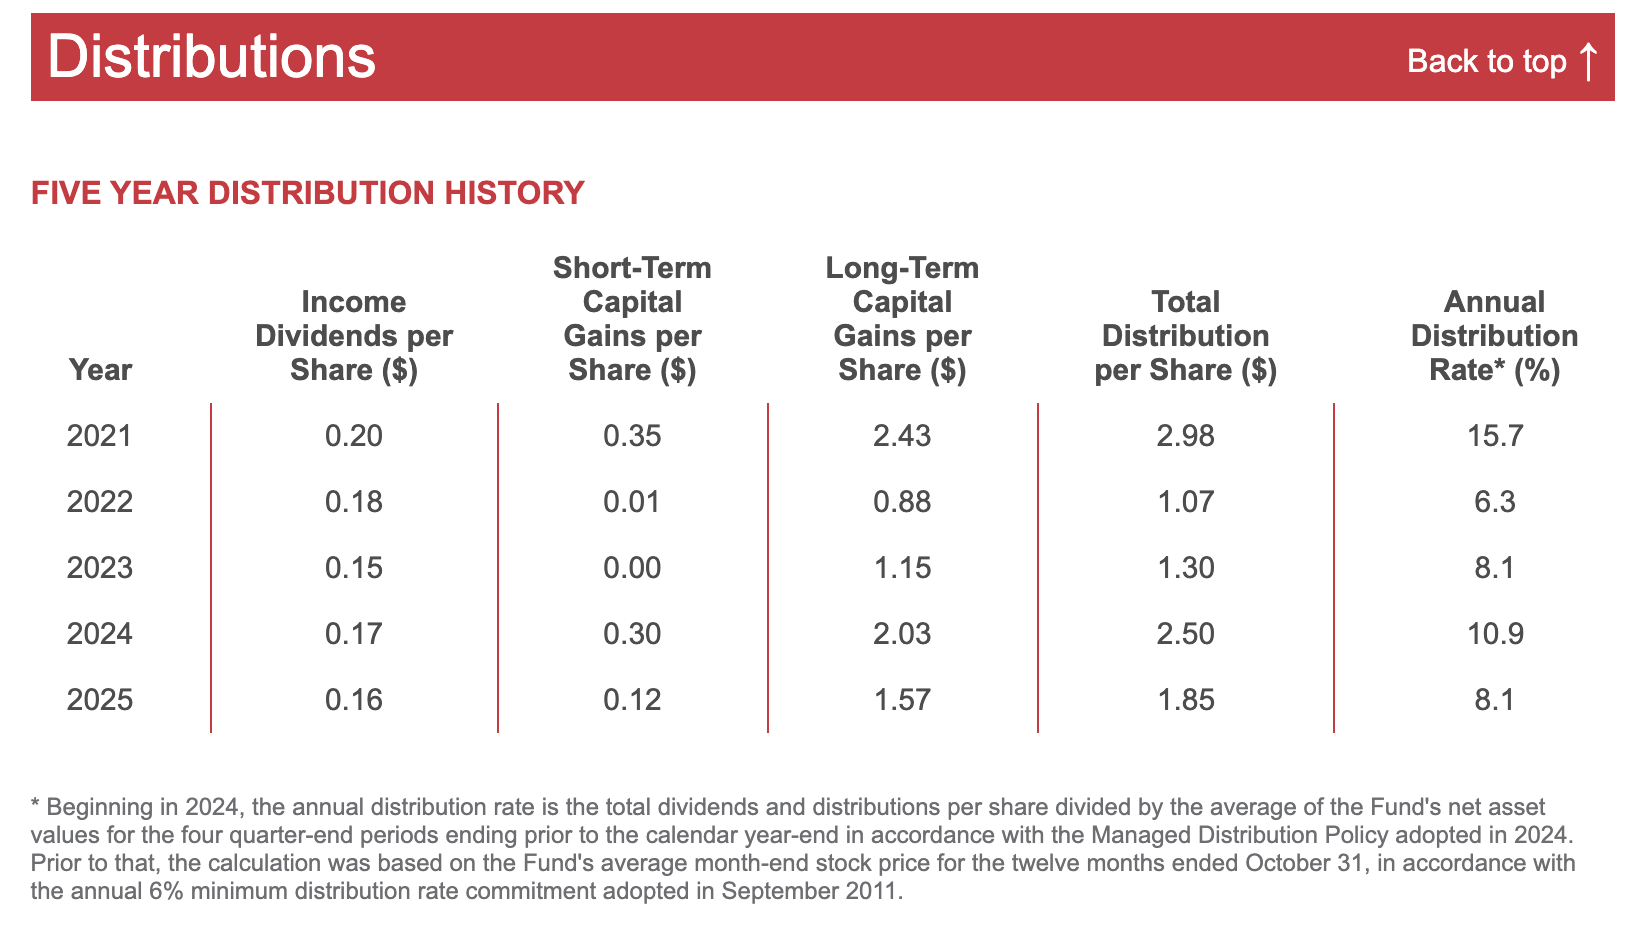
As we can see in the handy overview below, income dividends account for just a tiny part of total distributions. These are the dividends it receives from the companies it holds. Most income came from both short-term and long-term capital gains. The company sells these stocks at a profit and returns the proceeds to its investors. They do that to avoid being taxed, as they are forced to distribute at least 90% of these proceeds.
Adams Diversified Equity Fund
That explains the variance in distributions, as poor stock market years tend to result in the absence of major gains to distribute. That’s something investors need to keep in mind.
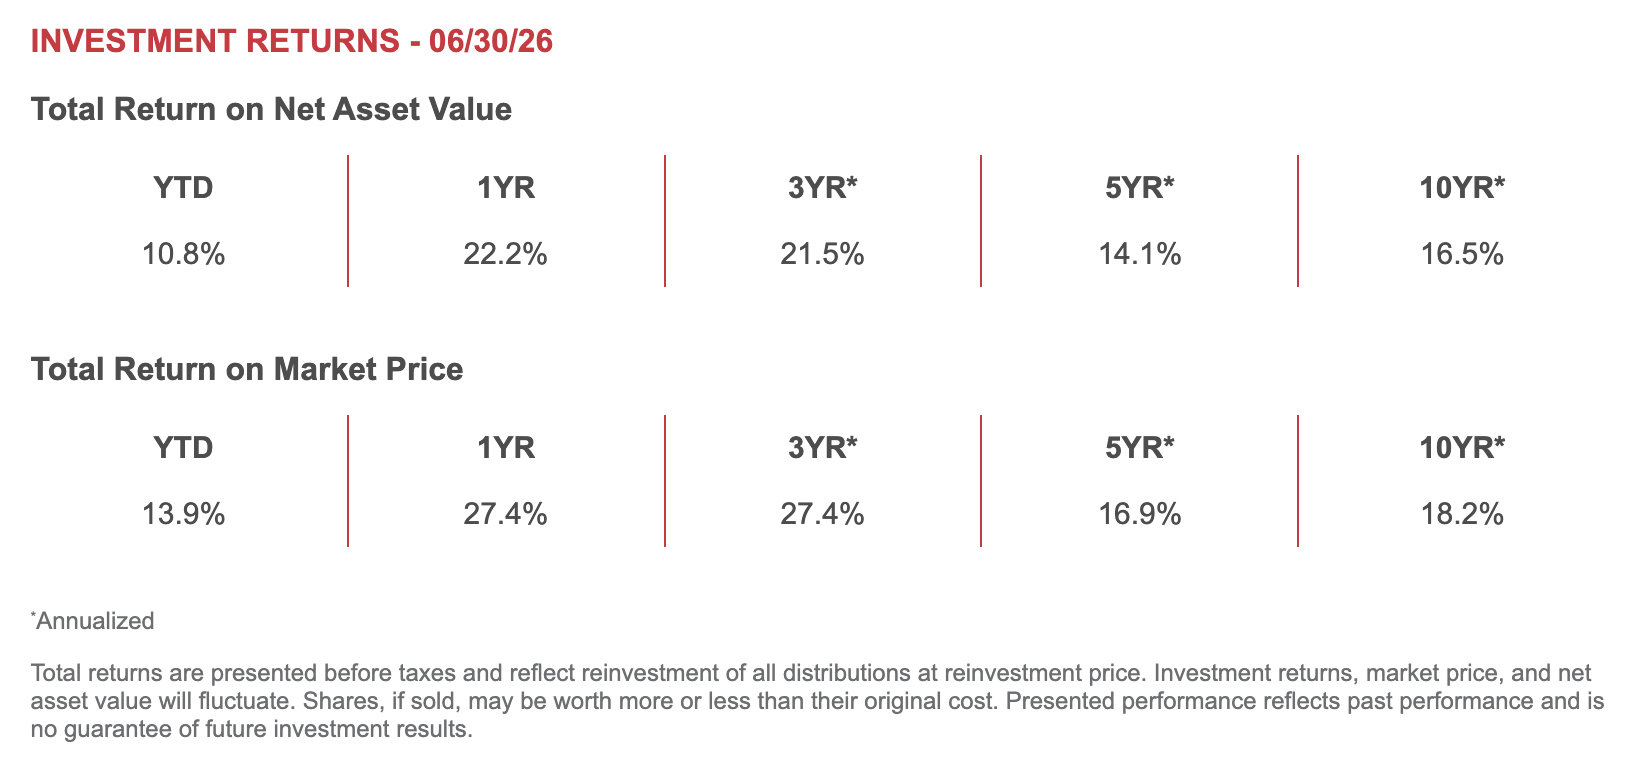
And now comes a very important thing. An 8% payout of its NAV basically means that the NAV grows at the total return minus the 8%. That’s simple, as it’s the growth that doesn’t return to shareholders. As ADX returned 16.5% per year over the past ten years (see below), it means that the company grew its total assets even after distributions. That’s great (and important), as I highly dislike it when investors get paid their own capital.
Adams Diversified Equity Fund
Also, this breakdown means that it’s mostly taxed as long-term capital gains. I’m not a tax specialist, but that can be very beneficial for investors, as it’s usually taxed at 0%, 15%, or 20%, depending on the tax bracket.
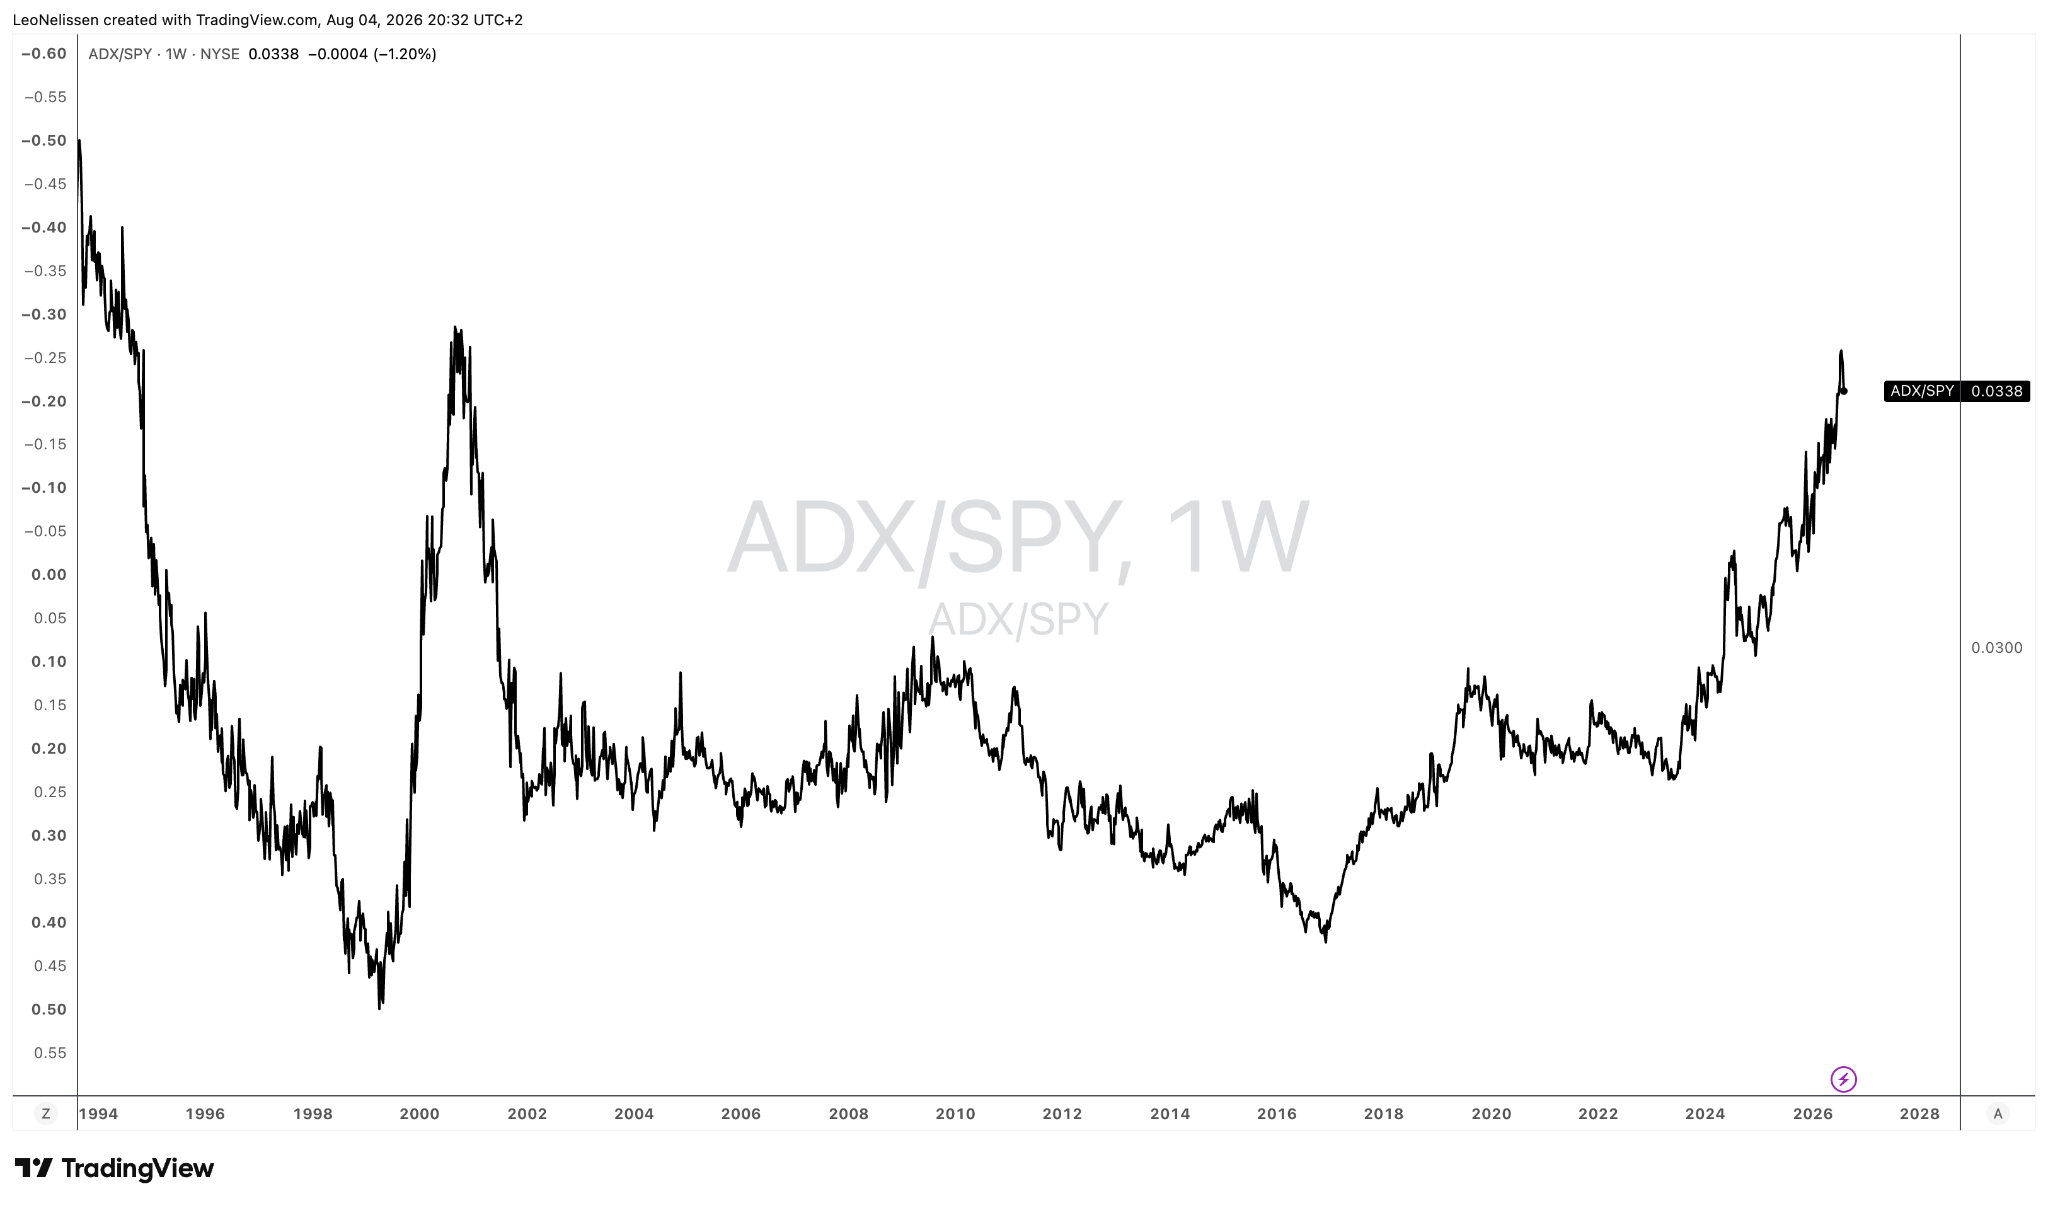
Even better, on a total return basis (reinvested distributions), ADX has beaten the S&P 500 on a very consistent basis since the early 2000s, as the ADX/SPY total return ratio below shows.
TradingView (ADX/SPY Total Return Ratio)
Last but not least, note that the default situation is that ADX pays distributions in shares. So, if you want a cash payout, you need to select that. Most do it on their broker’s platform.
All things considered, while I’m not investing in income yet, I love ADX. It’s a terrific income vehicle that tends to come with a great total return for investors who require income without the will to give up on growth.
Valuation-wise, you’re basically paying NAV to get ADX. A discount would be better, but to me, that’s not a deal-breaker at all due to the qualities that ADX brings to the table.
The next pick is different.
Ares Capital Corp. (ARCC) – Buying 10% Income And A Terrific Track Record
I like Ares Management (ARES). It’s one of my favorite asset managers. There’s just one problem, which is that it doesn’t have a high yield. That’s not a problem for my strategy, but for the purpose of this article, it’s a big problem.
ARCC is nothing like ADX, as it’s a Business Development Company. It means that it lends money to middle-market companies that are too small for the large corporate bond market and too big to go to the bank for a loan (I’m painting with a broad brush).
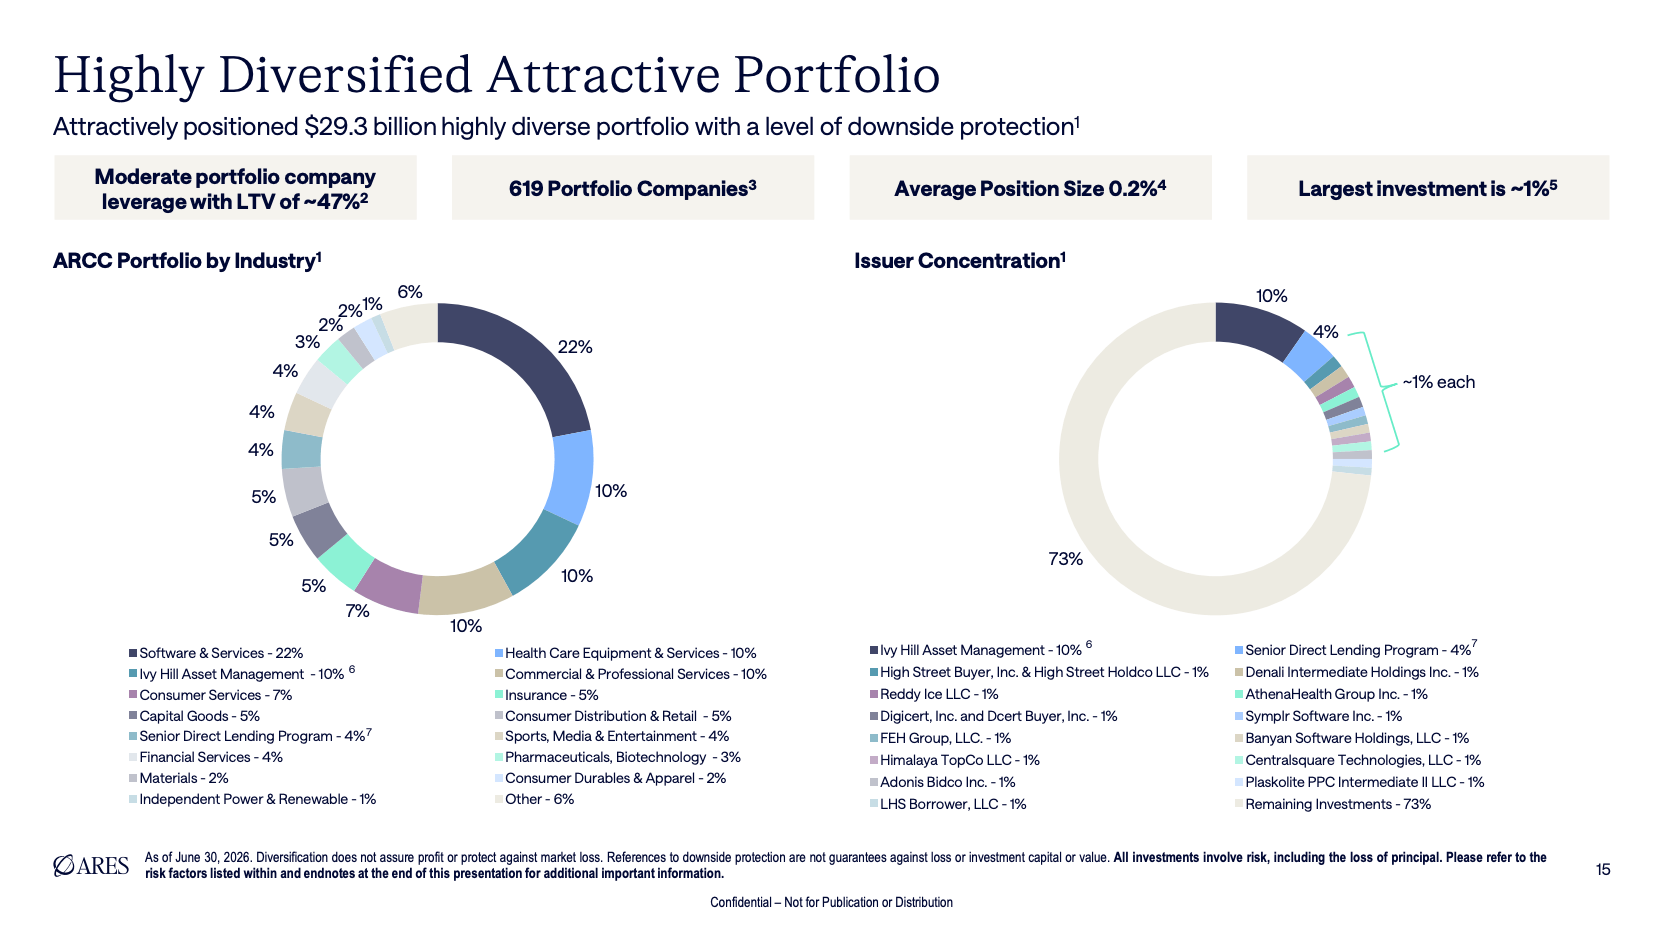
Everything in this business is about creating a favorable risk/reward. As I have often said, lending money is easy. Getting it back (with interest) is the hard part. As the handy overview below shows us, ARCC has close to $30 billion in assets in its portfolio. That’s mostly loans with 619 portfolio companies, none of which account for more than 0.2% of the portfolio.
Ares Capital Corp.
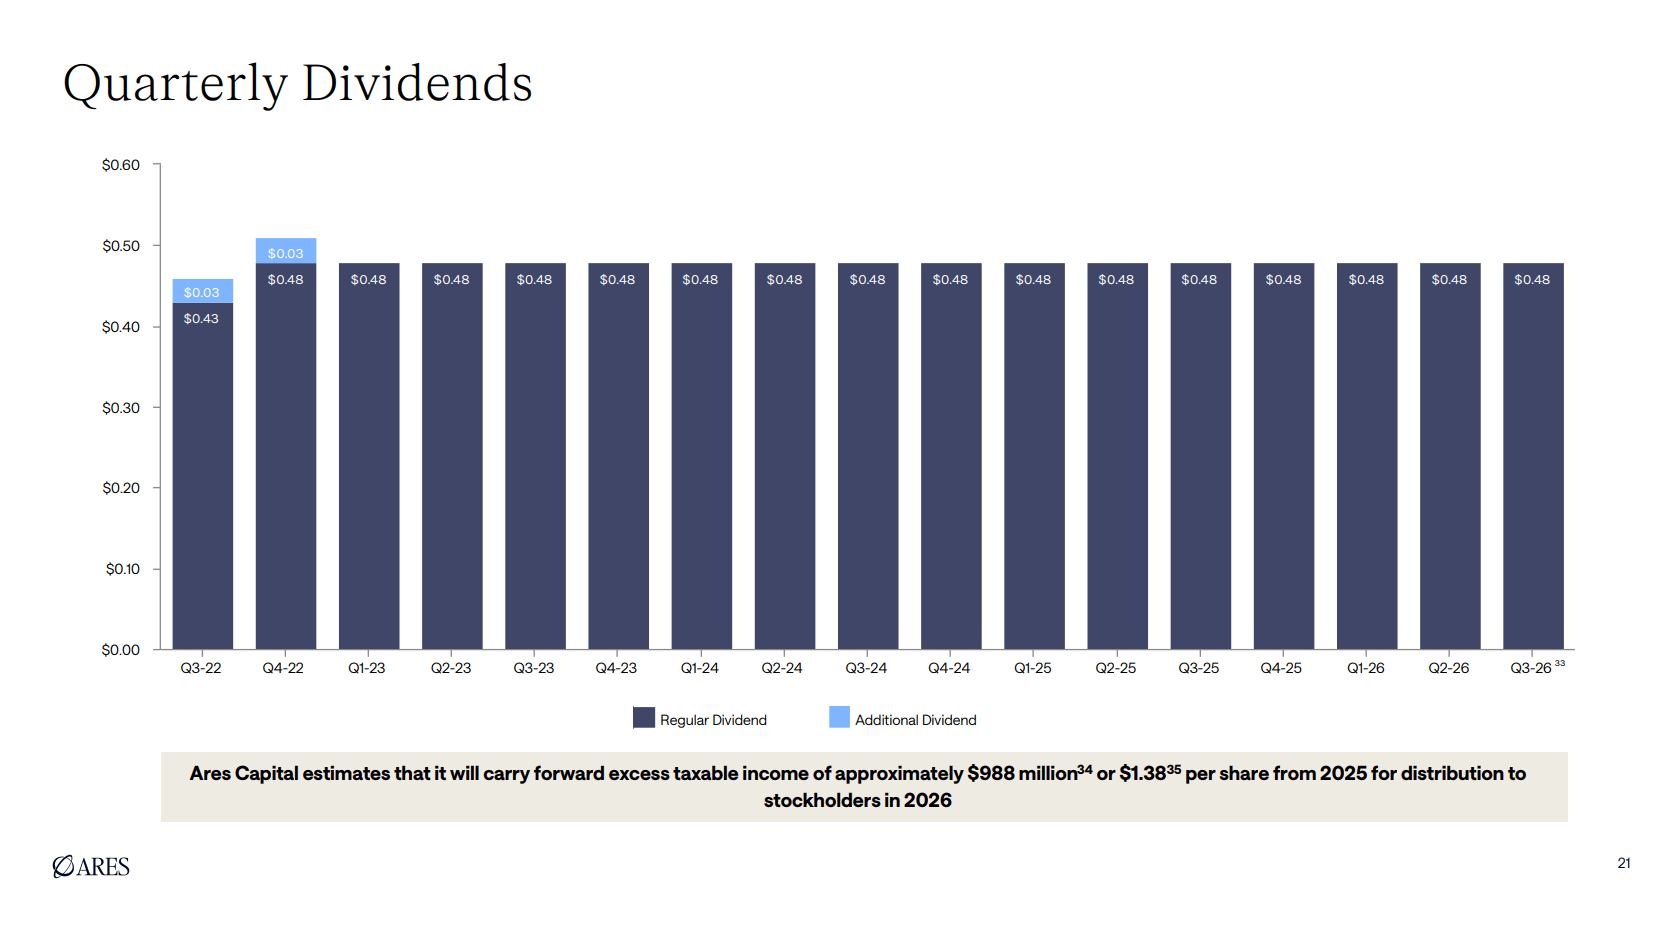
This portfolio provides investors with a yield of roughly 10% with a very stable payout that hasn’t been cut for 17 consecutive years, as the company said during its 2Q26 earnings call. During that call, it was very upbeat about its dividend, as the quote below shows:
Turning to our dividend outlook. We continue to believe ARCC’s current regular dividend appropriately reflects our long-run underlying earnings power. Our earnings and dividend profile is further supported by substantial spillover income, modest leverage, a more stable interest rate environment, and continued overall healthy credit performance.
Our significant spillover income provides an additional layer of flexibility and can help bridge during periods of slower transaction activity. In addition, over the last 12 months, core earnings have exceeded our regular dividend, while an additional $0.15 per share of net realized gains has provided further support for our overall dividend paying capacity. Taken together, these factors support our outlook for relative stability in earnings and our decision to maintain a stable quarterly dividend, building on our track record of stable or growing regular quarterly dividends for 17 consecutive years. – ARCC 2Q26 Earnings Call
Ares Capital Corp.
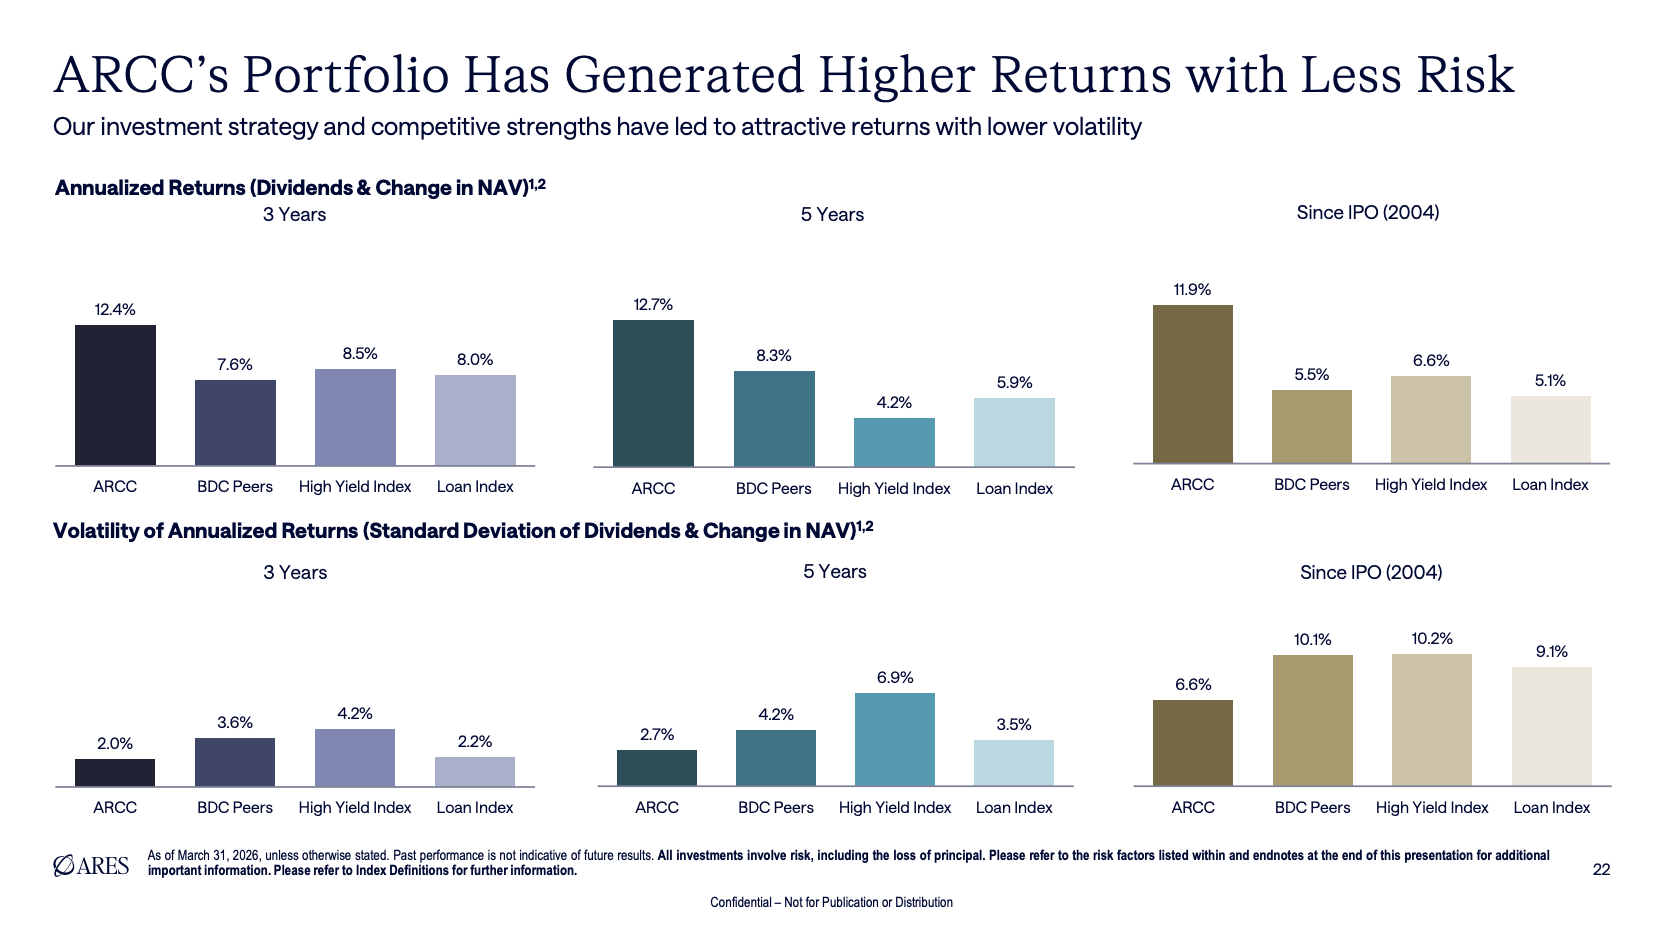
Its net investment income per share is $0.50, which implies a payout ratio slightly below 100%. And, even better, the company has a stellar track record. As we can see below, since its IPO in 2004, it has returned 11.9% per year (capital gains + dividends). That’s way above the BDC average. That outperformance has lasted, as it also occurred on a three- and a five-year basis.
Ares Capital Corp.
And going back to the second quarter, the company showed some very important things, including the fact that non-accruals were just at 2.4% at cost. This is below its own 3% post-Great Financial Crisis average and even further below the BDC industry average of 4%.
The biggest risk for Ares Capital is a steep downturn in the economy that comes with lower short-term rates. It would pressure the yields on new deals and hurt the credit quality. However, I believe we get to a best-case scenario, as I expect sticky inflation to result in sticky rates and economic growth broadening to support loan quality. Note that ARCC has an investment-grade rating of BBB (or equivalent) from all three major rating agencies, which gives it access to attractive funding deals and helps to improve the yield on deals.
I also think that credit fears in software are overblown.
Although software is prone to more disruption due to AI and ARCC has 22% software exposure, I believe ARCC is doing a stellar job managing these risks. Here’s what the company said during its 2Q26 earnings call:
Nearly all of our software investments are focused on what we view as foundational infrastructure for complex businesses, often serving as systems of record in regulated end markets with high switching costs and significant embedded value.
Importantly, we continue to see strong operating performance across our software investments with organic LTM EBITDA growth accelerating during the second quarter and exceeding the broader portfolio average. Within our software portfolio, only one small loan is currently on nonaccrual, and our debt investments remain supported by loan-to-value ratios in the low 40% range, providing substantial equity value beneath our positions. – ARCC 2Q26 Earnings Call
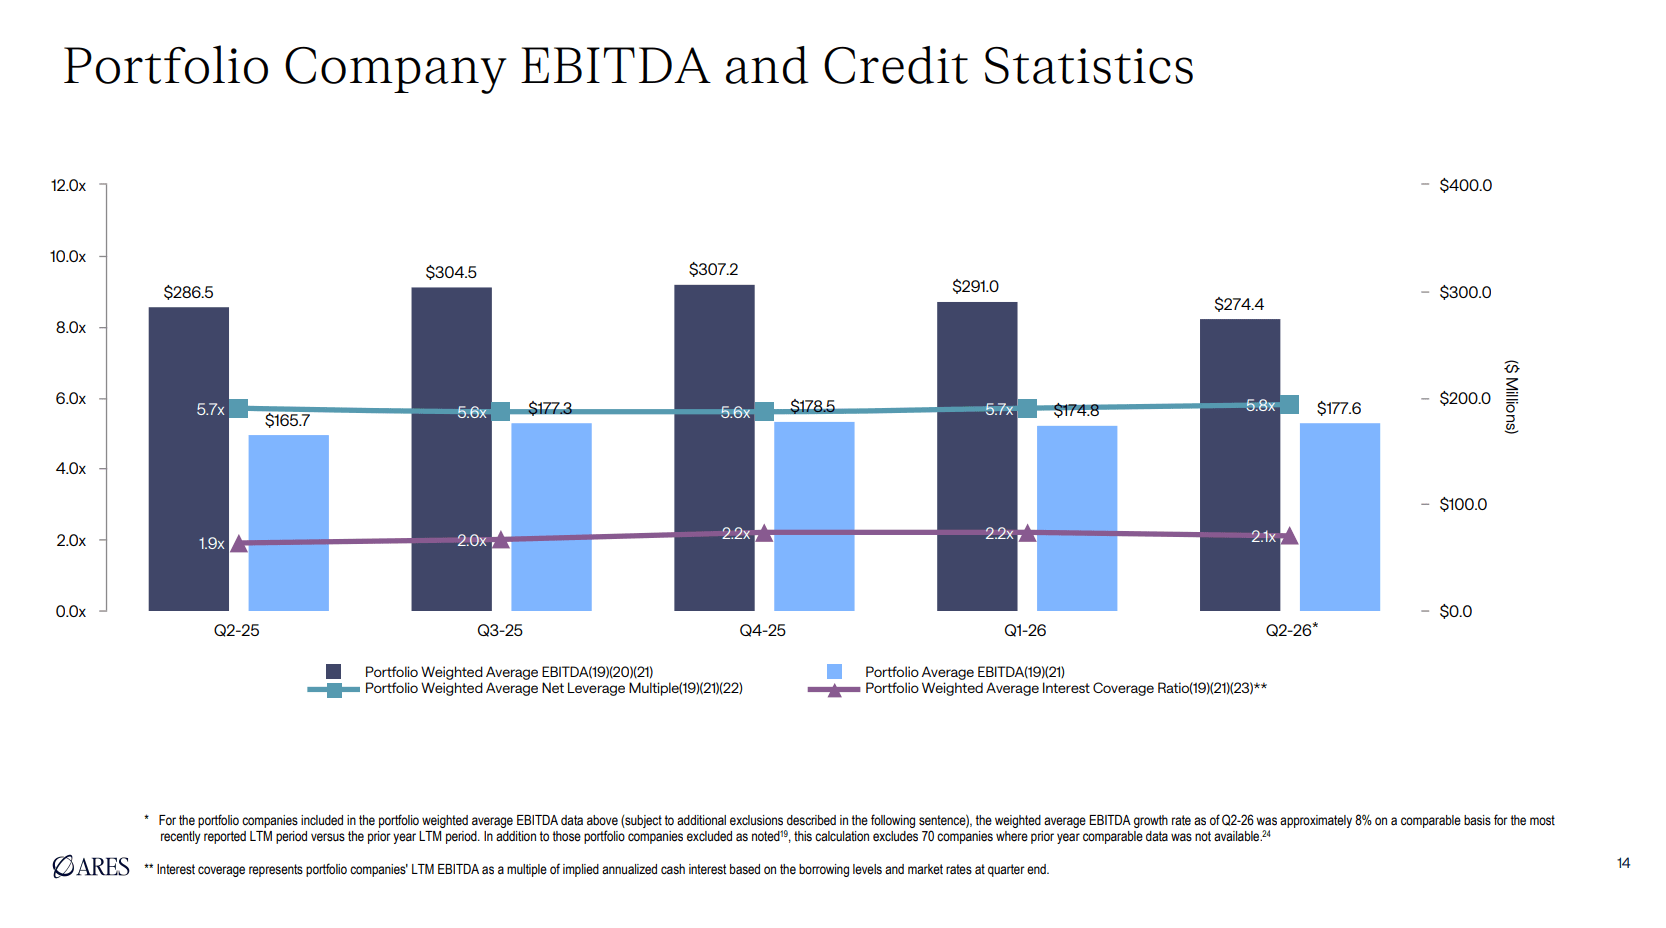
And in general, its portfolio companies remain very healthy, as we can see below:
Ares Capital Corp.
Now comes the bad news. ARCC is taxed as ordinary income, which is not something everyone likes. ARCC is taxed differently because its revenue comes from interest. ADX makes most money from capital gains, as we just discussed.
That is something to keep in mind, especially as this article started by explaining that sometimes, costs (taxes) can create a different picture than one might expect.
But either way, ARCC’s elevated gross yield and stellar management make it very attractive for me. It’s the reason it’s a holding of the Main Street Alpha Dividend Income Model Portfolio. I would also own it myself, but then again, I’m currently more focused on growing my principal before I squeeze more income out of it.
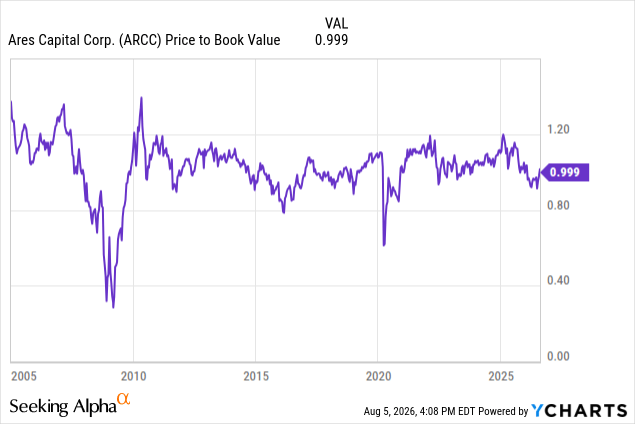
And valuation-wise, you’re basically paying 1x book value for the company, which is roughly in line with its long-term average and a price I consider to be very fair. Please note that I have often said that I have no interest in buying steep discounts. For me, in BDCs, the number one priority is quality. Getting high quality at book value here is a great deal, if you ask me.
I say it a lot, but I truly believe that one of the biggest mistakes investors can make is hunting for the highest yields. I’ve seen many portfolios get demolished by investors ignoring risks and simply buying high income.
It’s all about establishing goals, looking for quality, reducing costs, and investing in what works. That’s why I brought up ADX and ARCC today. To me, they are two of my favorite assets to buy for income. ADX offers an 8% annualized distribution that comes from a very diversified equity portfolio, while ARCC offers 10% income from private credit.
Both have risks, as ADX cannot efficiently distribute capital gains if the market isn’t favorable, and ARCC is prone to economic/credit and interest rate risks. That’s what makes them so different, which is great for diversification.
However, even in light of these risks, I think the risk/reward for income investors is great, as both assets show that high income can work very well if the underlying foundation is strong. That’s also why both have such great track records in their areas.
They aren’t perfect (nothing is), but for income, I love both.
Even small monthly investments can grow into tens of thousands of dollars.
By David Dierking – Aug 29, 2026
Key Points
Over the past 100 years, the S&P 500 has generated an average annual return of around 10%.
With those kinds of returns, even small investments can grow substantially over years.
Here’s exactly how much $100 a month could turn into over the next two decades.
A lot of people think it takes a lot of money to make money investing in the stock market. In reality, any investment can do the job. Even small monthly investments made consistently over the course of decades.
For many people, a simple $100 monthly investment in the S&P 500(^GSPC-0.25%) is achievable. It may not sound like much, but how large can your investment grow if you keep investing for 20 years?
Let’s do the math.
Source: Getty Images.
What $100 a month in the S&P 500 turns into
Historically, the S&P 500 has generated an average annual return of around 10% over the past century. While returns can fluctuate significantly in the short term, a 10% annual rate of return assumption gives us a good benchmark to work with.
Assuming an investor starts with nothing and consistently contributes $100 a month to something like the Vanguard S&P 500 ETF(VOO-0.21%), at a 10% average annual return, those investments would turn into roughly $76,000.
That means your total of $24,000 in contributions would have generated roughly $52,000 in investment gains. Once the snowball effect of those monthly investments accelerates, the majority of your returns come from compounding, not from the investments themselves.
Most people assume that the rate of return you see on your investments is the most important factor in how big your portfolio can become. There’s no question it’s a major catalyst, but it’s not the biggest one.
The ability to consistently contribute to your investment account is perhaps the most important thing for long-term wealth creation.
There will be times when the market declines, occasionally very significantly. But it’s the ability to continue investing through those times that could create the biggest benefit. That’s because in those situations, you’re buying shares at a discount. Taking advantage of those periods could actually improve your long-term returns over pausing your investments when the market gets rougher.
Short answer: DX (Dynex Capital) is a high‑yield, high‑risk mortgage REIT with a 15.4% dividend yield, extreme leverage, and improving earnings spreads, but still exposed to rate‑cycle volatility. It is not a traditional property REIT — it is a leveraged bond‑carry vehicle. For income investors, DX is attractive only if you accept the volatility and the risk of dividend cuts.
📌 DX — Full Investment Analysis (Grounded in latest data)
🧭 1. What DXis
DX is an internally managed mortgage REIT (mREIT) investing in:
Agency RMBS (Fannie/Freddie)
Ginnie Mae MBS
CMBS
Interest‑only strips
It earns money from net interest spread, not rents. This makes DX behave more like a leveraged bond fund than a property REIT.
Source:
💰 2. Dividend & Income Profile
Dividend yield:15.41%
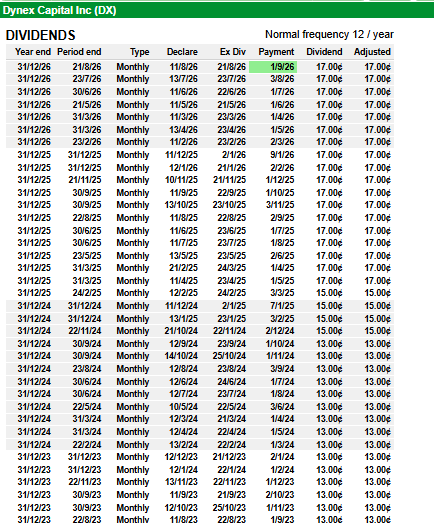
Dividend: $2.04 annually, paid monthly
Payout ratio: 211% of GAAP operating cash flow (very high)
Dividend risk score: F
Years of dividend growth: 2
Source:
Interpretation: DX’s dividend is not safe. Mortgage REIT dividends move with interest spreads and leverage. DX has cut dividends in past rate cycles.
📈 3. Earnings & Spread Trends
DX’s Q2 2026 results show meaningful improvement:
EAD per share: $0.36 (+63.6% YoY)
Net interest spread:1.17%, up 21 bps YoY
Portfolio growth: +40% YoY
Coupons locked: 5–6% RMBS
Source:
Interpretation: DX is benefiting from stabilising rates and higher‑coupon MBS. This is the strongest operational improvement in several years.
⚖️ 4. Leverage & Balance Sheet
Leverage:8.1× equity
Debt/book capital: 88.55%
Net debt/EBITDA: 26.35×
Source:
Interpretation: DX is extremely leveraged — typical for mREITs, but still dangerous. Small spread changes = large earnings swings.
📊 5. Valuation & Returns
Price: ~$13
PE: 5.31
ROE: 13.74%
12‑month return: +20.6%
10‑year CAGR: 6.97% (below S&P 500’s 13.49%)
Source:
Interpretation: DX is cheap on earnings but historically underperforms broad equities. Returns come mostly from dividends, not price appreciation.
🧨 6. Key Risks
Rate cycle risk (dominant)
DX is highly sensitive to:
Yield curve inversion
Rapid rate hikes
Spread compression
This is the single biggest determinant of dividend safety.
Dividend cut risk
Payout ratio >200% of GAAP OCF is unsustainable long‑term.
Leverage risk
8× leverage magnifies both gains and losses.
MBS market volatility
Agency MBS are safe from credit risk, but not from duration/hedging risk.
🧠 7. Is DX a Buy?
UK‑based, income‑focused, analytical, and comfortable with REITs — here’s the tailored view:
DX is a buyonly ifyou want:
Very high monthly income
Exposure to stabilising US rate spreads
A contrarian, high‑yield mREIT with improving fundamentals