If the price rises and the yield falls, you could book your profits and re-invest in a higher yielder/risk IT. If not keep re-investing the dividends either back into CMPI or your Snowball.
The SNOWBALL currently doesn’t invest in CMPI as the earned and re-invested dividend stream means that the SNOWBALL can take more risks when re-investing. When the SNOWBALL nears its drawdown period, it could become a key component of it’s income stream.
4 ETFs Yielding Over 7% That Income Investors Are Quietly Buying
These ETFs are compelling as investors still struggle to capture meaningful yields from equities.
By David Dierking – Mar 22, 2026
Key Points
Income seekers are looking beyond traditional equities for high yields.
Option income strategies remain popular, but investors have been committing money to alternative strategies as well.
These ETFs yielding 7% or more have proved to be good high-income diversifiers, but be aware of the risks.
If you’re a dividend stock investor, things are finally looking better for you in 2026.
After three straight years of underperformance in a market dominated by large-cap tech, dividend stocks have finally swung back into favor. One exchange-traded fund (ETF), the WisdomTree U.S. Total Dividend ETF, is outperforming the S&P 500 by about 5% year to date on the heels of leadership from value and defensive stocks.
But dividend yields are still pretty thin. The Vanguard S&P 500 ETF is only yielding about 1.1%. If you focus more on high yield stocks, you can capture something in the 3% to 4% range. To find something higher than that, you have to consider more niche and unique strategies.
Income investors have been looking into various strategies for high yields. Here are four ETFs that have drawn positive net inflows over the past three months and the past year, but have yet to really capture the market’s attention.
Image source: Getty Images.
1. JPMorgan Equity Premium Income ETF
The JPMorgan Equity Premium Income ETF(JEPI) was one of the biggest success stories of the 2022 bear market. As yields began soaring and fixed income was delivering double-digit losses, covered-call strategies emerged as an alternative to bonds. With yields pushing 10% or higher, they soon drew billions of dollars of investor money.
This fund’s returns have cooled off over the past couple of years during the AI boom, but investor interest hasn’t waned. It’s up to more than $43 billion in assets and has taken in net new money of $2.3 billion in 2026 alone. It has a current yield of 7.6%.
The JPMorgan Equity Premium Income ETF is built on a portfolio of low-volatility stocks, so it’s made for an environment like the one we’re seeing now. It worked well in 2022, and it could work again in 2026.
2. JPMorgan Nasdaq Equity Premium Income ETF
The JPMorgan Nasdaq Equity Premium Income ETF(JEPQ+0.17%) is essentially the Nasdaq 100 version of the fund above. It was just launched in 2022, but it caught the popularity wave of its sister fund and then captured further buying interest due to the bull market in tech stocks. It offers a current yield of 11.4%.Collapse
That higher yield is a product of the higher volatility that comes from the Nasdaq 100 stocks compared to a portfolio of low-volatility stocks. If the major U.S. indexes continue meandering sideways, as they have in 2026, it could be the kind of environment where we see the JPMorgan Nasdaq Equity Premium Income ETF actually outperform the Invesco QQQ ETF.
3. Global X SuperDividend ETF
The Global X SuperDividend ETF(SDIV) is about as pure of a high-yield equity play as you’ll find. Its strategy is simple: Include the 100 highest-yielding equity securities in the world (subject to minimum liquidity and tradable potential). Outside of that, it places almost no restrictions on what can make the cut.
What you end up with is a portfolio that’s heavy in financials (32%), real estate investment trusts (20%), and energy (18%). It’s also very diversified globally. The U.S., developed markets, and emerging markets all have nearly equal allocations of one-third each. It has a current yield of 7.3%.Collapse
Over the past year, investors have loved this fund. It has experienced 14 consecutive months of net inflows, including $60 million so far in March 2026. If that number holds, it would be the biggest monthly net inflow in 12 years.
4. VanEck BDC Income ETF
The VanEck BDC Income ETF(BIZD) is a fund that investors keep dipping their toes into, but it should come with a big warning. This fund invests in business development companies (BDCs), and that means heavy exposure to private credit.
Its three biggest holdings are Ares Capital, Blue Owl Capital, and the Blackstone Secured Lending Fund. Blue Owl, in particular, has been in the news a lot lately for freezing investor capital and halting redemption requests. There can be plenty of potential with this segment of the market, but private credit can be illiquid and risky, as many investors are finding out right now.
The VanEck BDC Income ETF has an attractive yield of 9.6%, but be careful about getting too aggressive with the yield hunting here.
Charcol; and Nick Sutton, sales director, Retirement Solutions
Ms Lowe’s concerns around equity release are completely valid, particularly when it comes to the potential for interest to compound over time. If Ms Lowe were to borrow £250,000 against her £800,000 home, the current best rate available as of today is a 6.4pc monthly equivalent rate (MER), or 6.59pc annual equivalent rate (AER).
If she chose not to make any repayments, the balance after 15 years would grow to approximately £651,261. This gives her the cash now without the need for monthly payments but does of course mean a significant reduction in the value of the estate left behind.
A higher-for-longer interest rate environment has created a restrictive macro landscape where traditional income strategies fail to clear the surging 5.10% long-bond hurdle rate.
This targeted pair provides a robust “Cash Flow Fortress” capable of absorbing inflationary pressures through exceptional balance sheet strength.
By combining high-conviction Quant “Strong Buys” with accelerating fundamental momentum, this elite duo delivers an inflation-protected income stream without sacrificing safety or capital growth.
I am Steven Cress, Head of Quantitative Strategies at Seeking Alpha. I manage the quant ratings and factor grades on stocks and ETFs in Seeking Alpha Premium. I also lead Quant Growth and Income, which is a model portfolio for dividend investors interested in capital appreciation and income.
vicnt/iStock via Getty Images
Higher for Longer
The bull is in the china shop. The “bull” is the equity market, which has been charging to all-time highs despite a brief pullback over the last few days.
The “china shop” would be delicate bonds, which are getting destroyed once again.
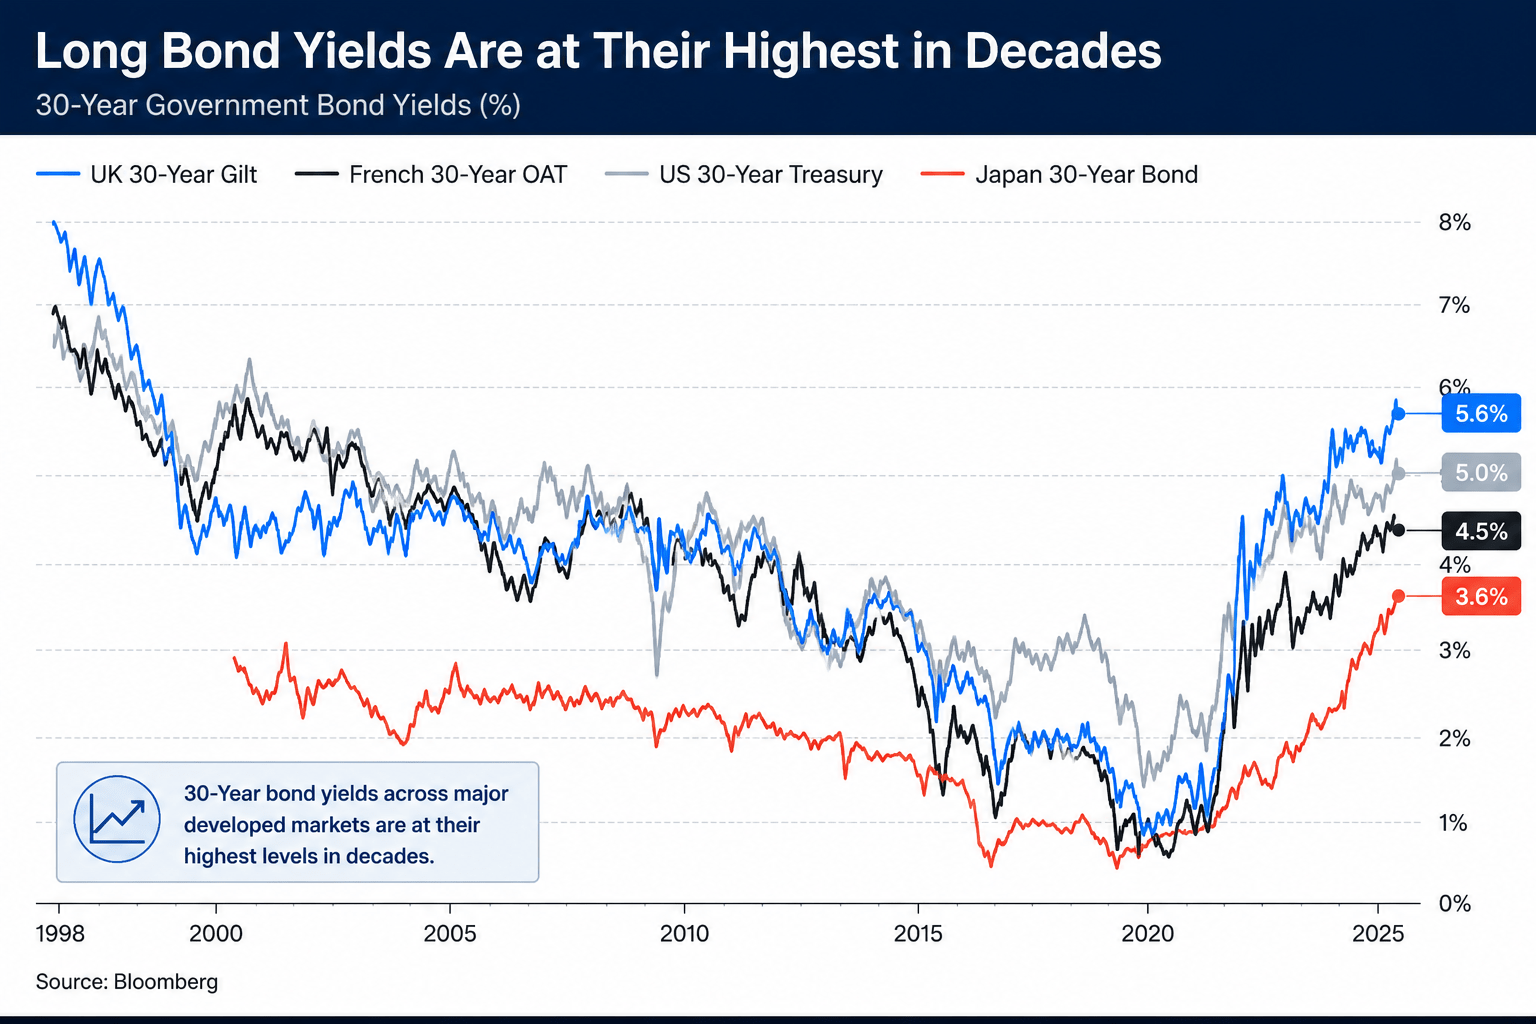
The bond market is selling off at a blistering pace. Yields are surging, and the long end of the curve is flying off the charts. In a matter of weeks, the benchmark 30-year U.S. Treasury yield blasted past 5.10%, hitting its highest level since July 2007.
Seeking Alpha, Bloomberg
The culprit here isn’t a secret. The ongoing energy price shock stemming from the war in Iran has completely opened the doors to macro chaos, sending oil prices soaring and reigniting fears of a second inflation wave in four years.
Any hopes we saw in late 2025 for a central bank policy pivot toward substantial rate cuts have been virtually extinguished. Put out by the return of the restrictive “higher-for-longer” policy that’s now the definitive base case through the end of 2026.
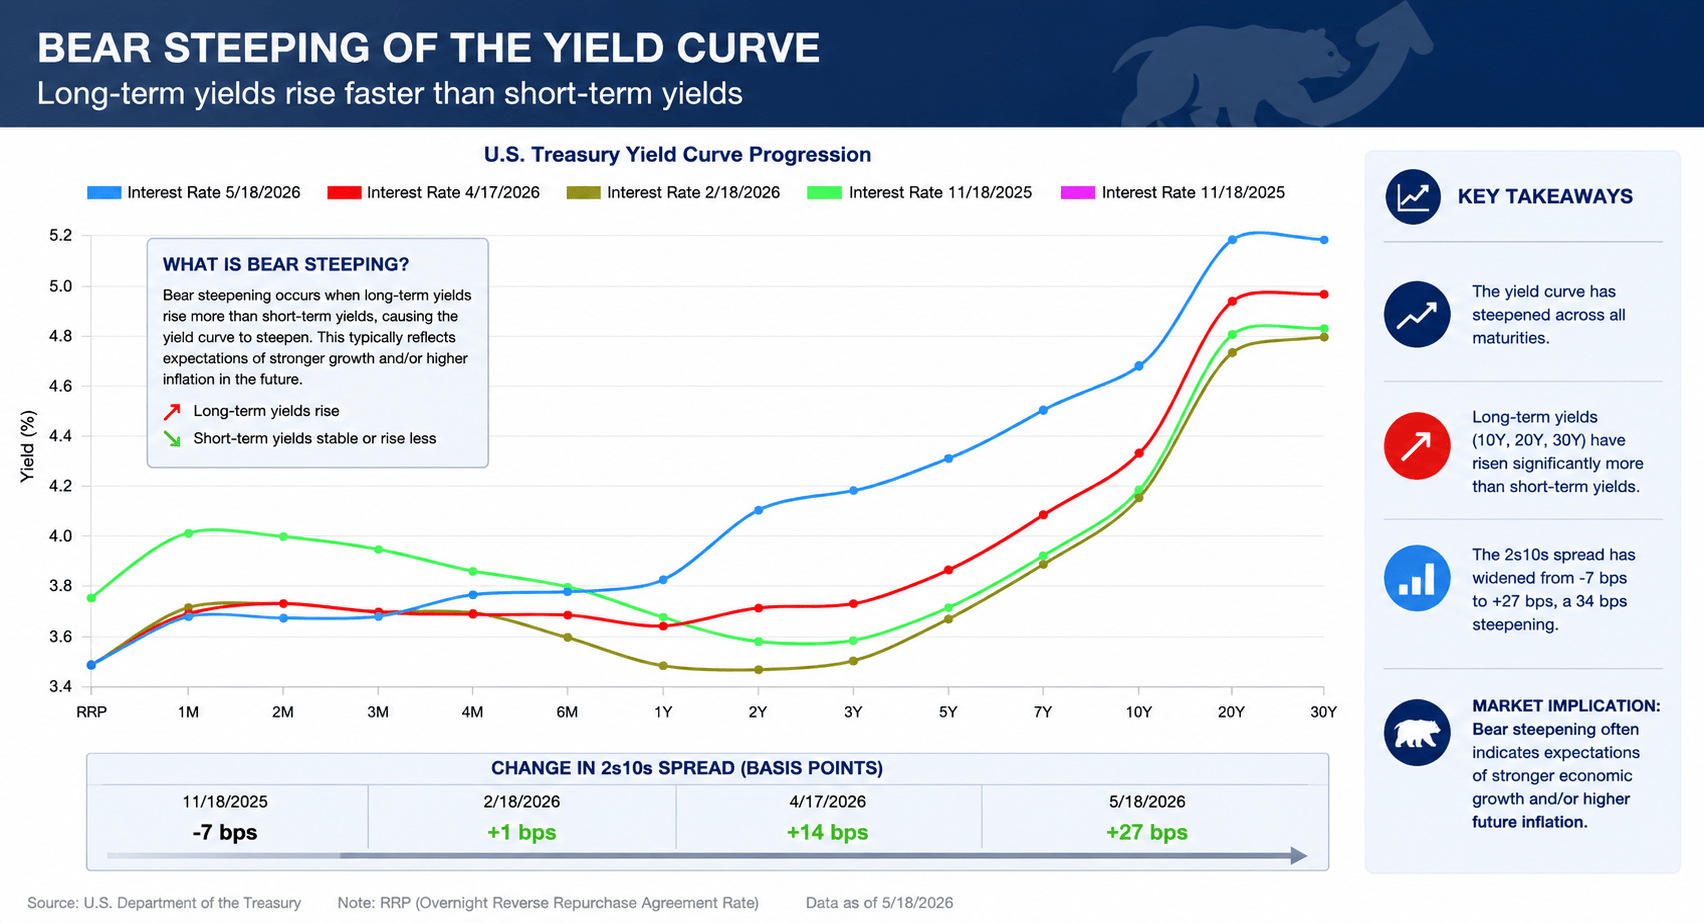
A Bear Steepener
What we’re witnessing right now is a textbook “bear steepening” of the yield curve. A bear steepening occurs when long-term interest rates rise faster than short-term interest rates. These rising yields result in a bond market sell-off on the longer-duration bonds.
Seeking Alpha
Understanding What a Bear Steepener Means for the Market
The Fed’s operational lever on interest rates is generally confined to the short end of the curve, orchestrated by the Federal Open Market Committee’s setting of the Federal Funds Rate. The open market, however, holds greater influence over the long end of the curve. With inflation rapidly reigniting, fear of structural and sticky pricing pressures has permeated. In response, investors are demanding a higher premium on government bonds.
Higher yields on 10-, 20-, and 30-year maturities can also act as a direct tax on consumers, significantly increasing the cost of consumer-driven debt. This includes mortgages and auto loans, which are heavily anchored to the benchmark 10-year U.S. Treasury – added pressures to consider for the new Fed Chair.
Welcome to the Party
On May 15, Fed Chair Jerome Powell officially handed over the reins to newly appointed Fed Chair Kevin Warsh, who is set to be sworn in by President Donald Trump on Friday, May 22.
This welcome party has quickly turned into an unwanted surprise party. The FOMC is split along ideological lines, essentially sitting on opposite sides of the room. Warsh is stepping into the most divided Fed since 1992. One camp is fearful of slowing growth and a stagnant labor market, while the other is concerned about a resurgence of high inflation led by the recent commodity shock. In this climate of extreme volatility, noise, policy gridlock, and uncertainty, trying to navigate all of these factors unprepared would be a fool’s errand. Instead, investors have an opportunity to take the smart approach.
Even in times of policy division, they often can’t help but verbalize their fears and/or policy motivations. By analyzing the recent commentary of Fed members combined, we can map those hidden insights directly to Seeking Alpha’s Quant Model, pointing us to two top-rated dividend stocks built to withstand the current market environment.
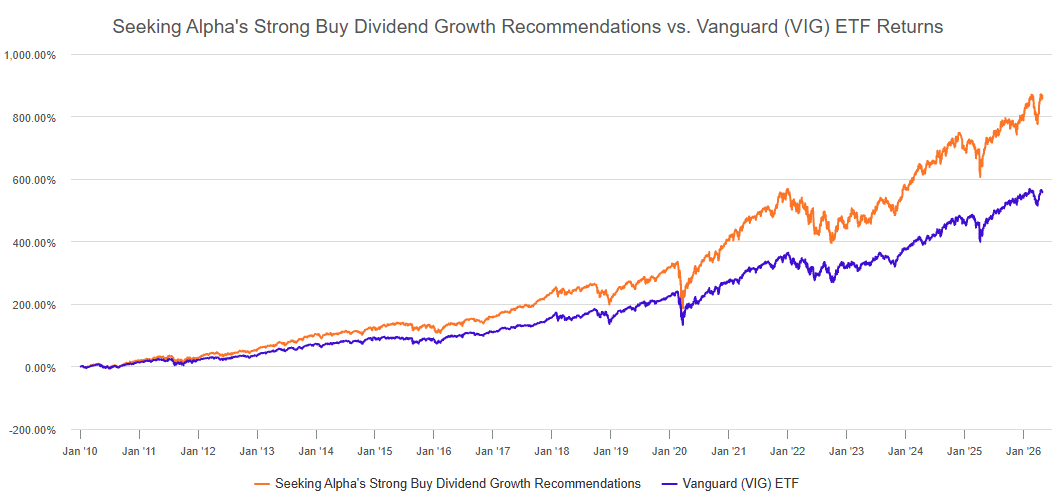
Seeking Alpha’s Quant Model has consistently outperformed the Vanguard Dividend Appreciation ETF (VIG) over the past decade. The historical chart below illustrates the effectiveness of this quantitative approach and sets the table for the strategy we’re discussing today.
Seeking Alpha
Top Dividend Stocks
Today, we’re going to look at recent quotes from Federal Reserve members and pair their commentary with select opportunities according to our Quant Model.
To select the top dividend stocks to feature in this article, I used the Seeking Alpha Stock Screener and chose the pre-selected Top Dividend Stocks and filtered for Quant Strong Buys/Buys only. I then sorted for stocks that exhibited Dividend Safety and Growth Grades of ‘C+’ and higher.
Founded in 1864, the Royal Bank of Canada is the country’s largest financial institution by market capitalization and holds the rare distinction by the International Financial Stability Board of being a “Global Systemically Important Bank” [G-SIB]. As a G-SIB, RY is required to hold higher capital buffers and is met with stricter regulatory oversight due to its importance within the financial system.
This designation is precisely what makes it a safe harbor for income investors worried about potential Fed policy affecting more vulnerable banking institutions.
With the 30-year Treasury yield marching north of 5.10%, traditional commercial banks begin to exercise the very stress test scenarios they prepare for. Rising long-term yields cause unrealized losses on investment holdings to grow and exert undue stress on balance sheets as deposit costs rise and competition for deposit volume increases.
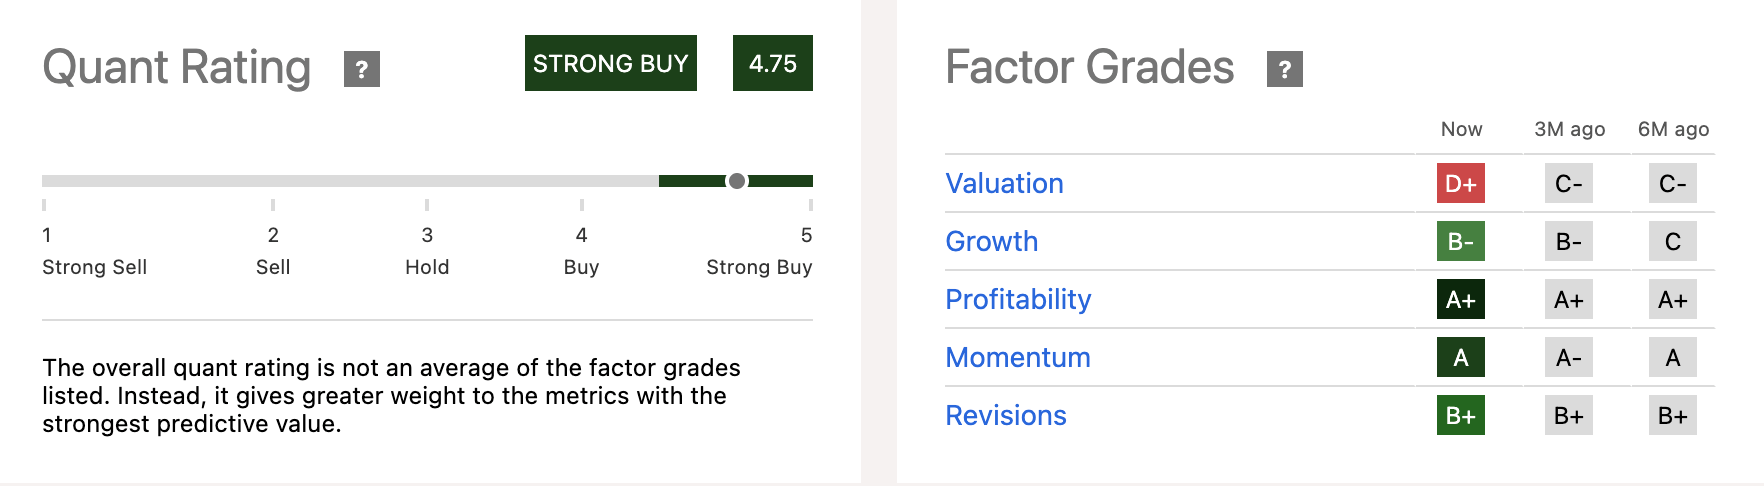
But for a global giant like the Royal Bank of Canada, this market stress can be an opportunity to consider a ‘Strong Buy’ Quant-Rated company like RY.
Seeking Alpha
When a Fed governor explicitly uses phrases such as “undermine bank resilience” or “threaten financial stability,” investors shouldn’t just cover their ears and hope for the best. Federal Reserve Governor Michael S. Barr issued this warning in a recent speech regarding the potential dangers of policy normalization on the financial sector:
I think shrinking the balance sheet is the wrong objective, and many of the proposals to meet this objective would undermine bank resilience, impede money market functioning, and, ultimately, threaten financial stability.
RY is positioned to combat any instability in the financial system due to its consistently high profitability metrics. Recently, RY raised its return on equity target to a baseline of 17%. President and Chief Executive Officer Dave McKay expanded on this achievement in the Q4 earnings call:
As I noted earlier, we are increasing our through-the-cycle medium-term ROE objective to 17%-plus due to the improved cost efficiencies and increased revenue productivity, including strong client flows and funding synergies from deposit growth… Our premium ROE, robust capital generation, and current CET1 ratio give us significant strategic optionality. Even after deploying capital to grow our franchises and pay dividends, we expect to build significant excess capital over the coming years. Net income, net of dividends, and core RWA growth is estimated to add approximately 80 basis points to our CET1 ratio annually.
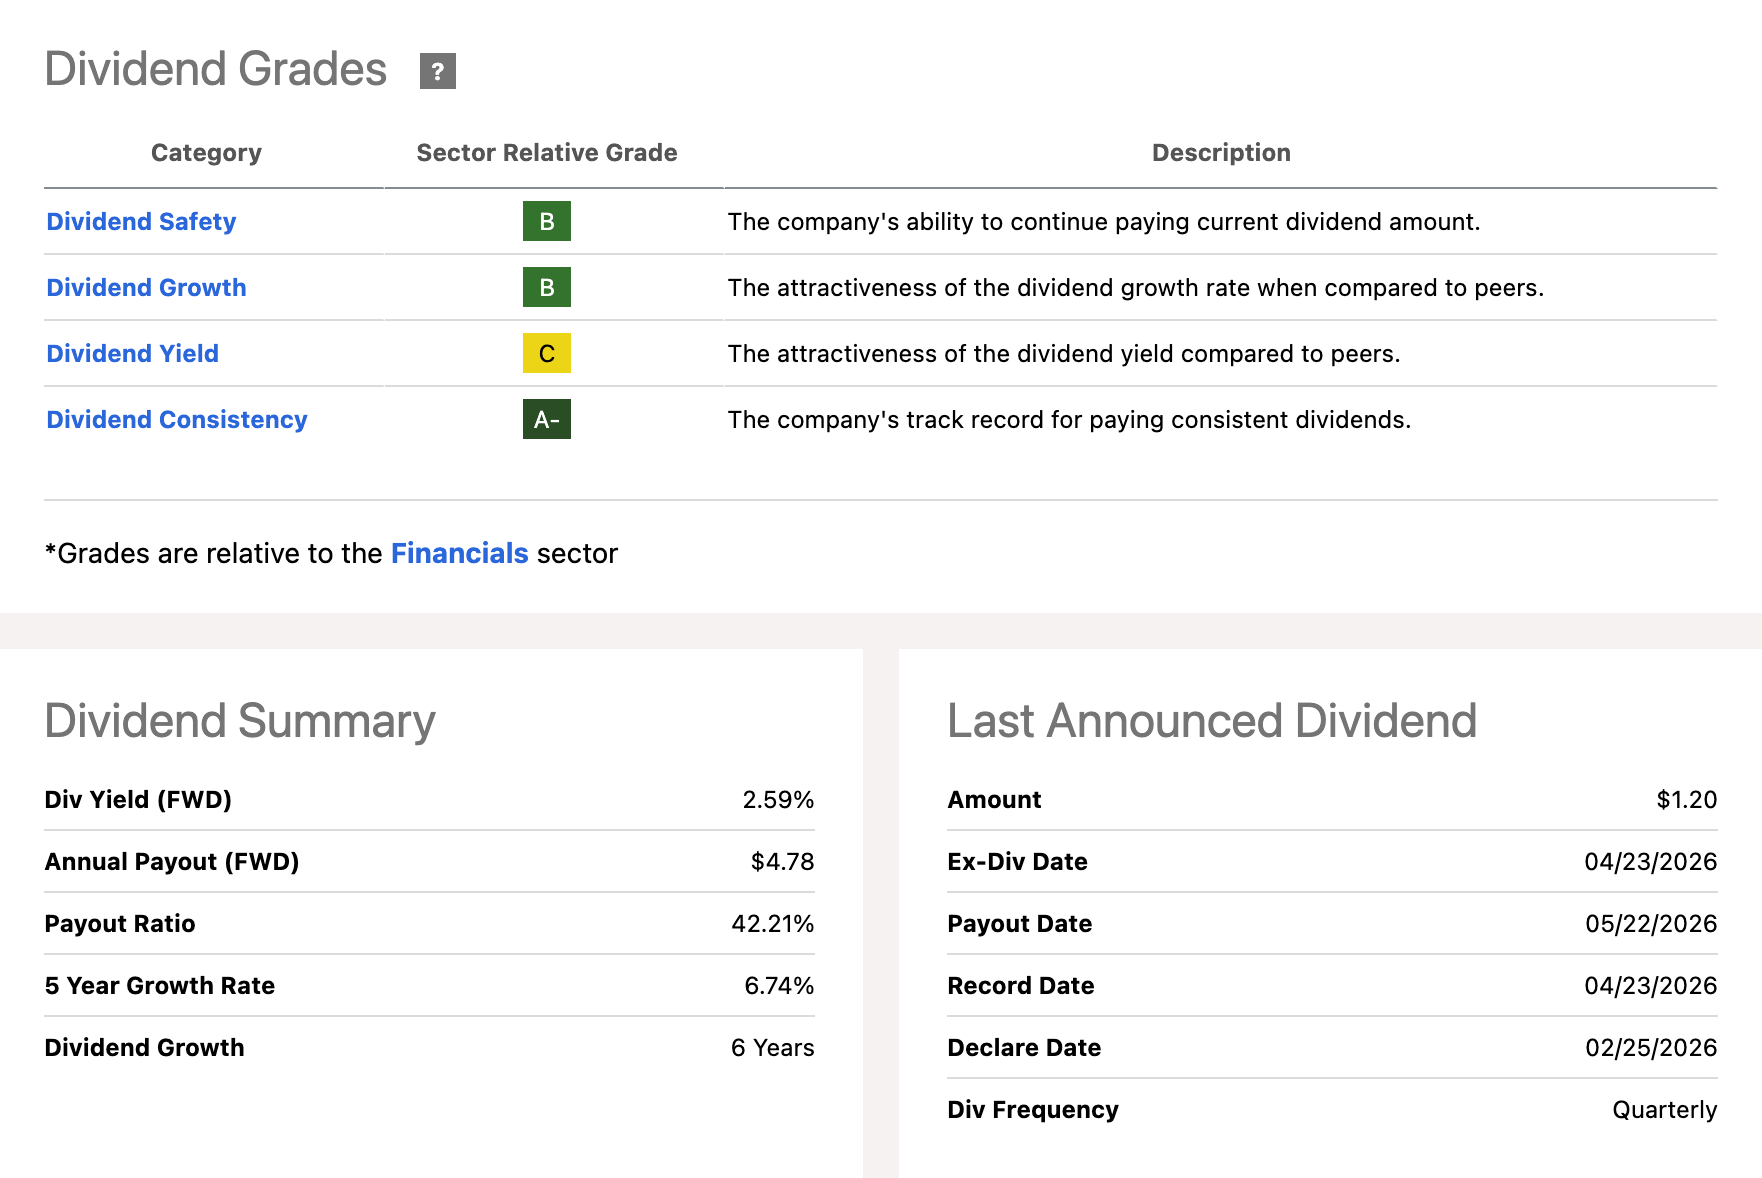
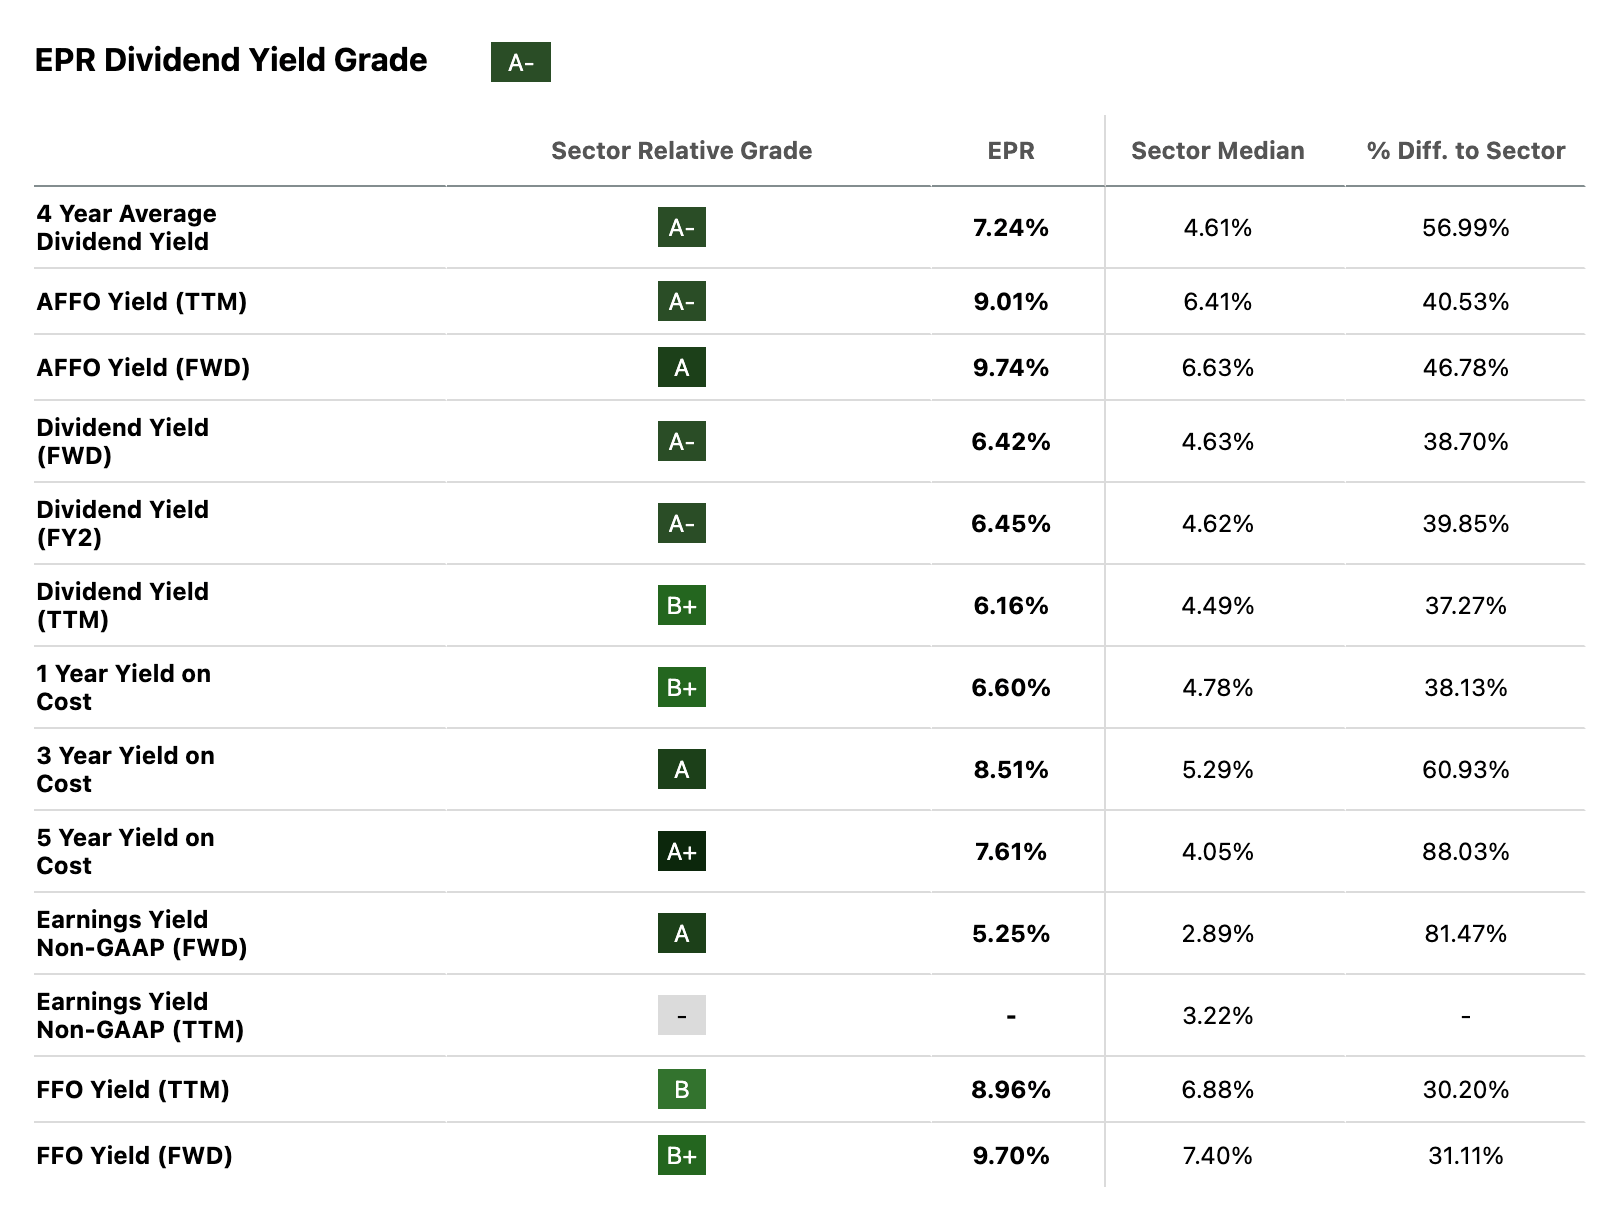
RY’s strong balance sheet is a catalyst for its ‘A+’ Profitability Grade and is fueled by its ‘A+’ Grade in Cash From Operations, and ‘A-’ Grade in Net Income Margin, which outpaces the sector median by nearly 35%.
Dividend Grade Scorecard
Seeking Alpha
In its most recent quarter, RBY reported a record net income of $5.8 billion, up 13% year-over-year [YoY]. Backed by this strong cash flow, the bank maintains a secure 42% payout ratio paired with a 6.74% five-year growth rate.
Seeking Alpha
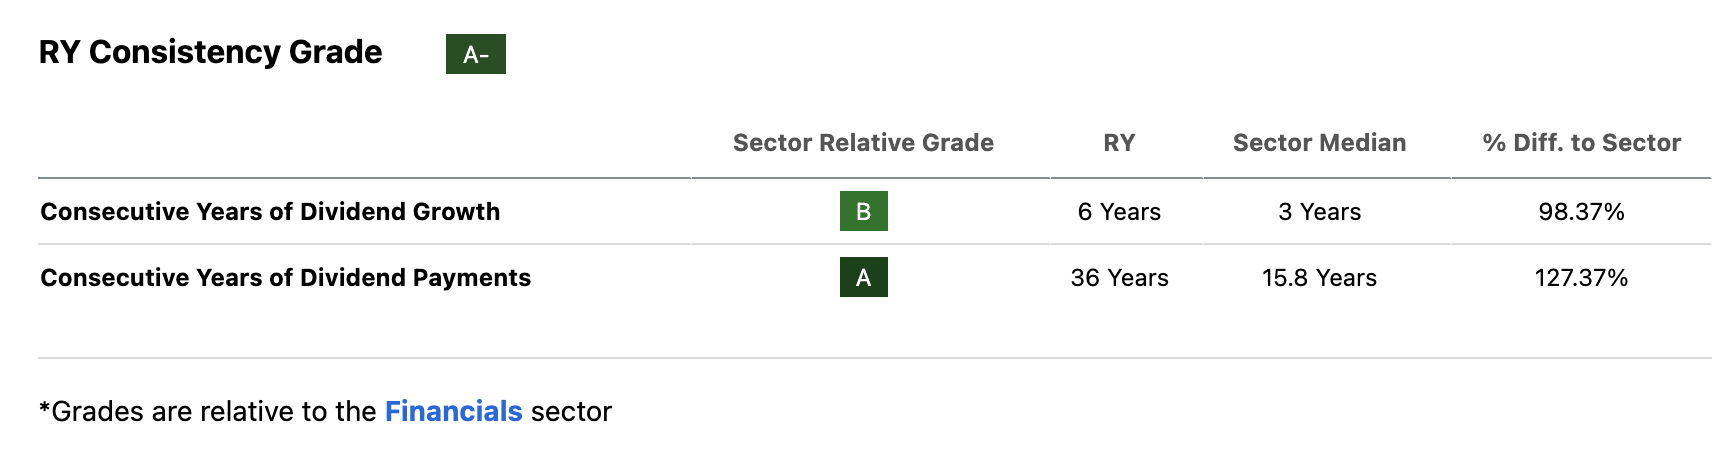
RY’s Dividend Consistency Grade of an ‘A-‘ is backed by its 36-year track record of dividend payments and six-years of dividend growth. Both doubled their respective sector medians, an indication that RY has the potential balance sheet strength to continue rewarding shareholders even in a challenging rate environment.
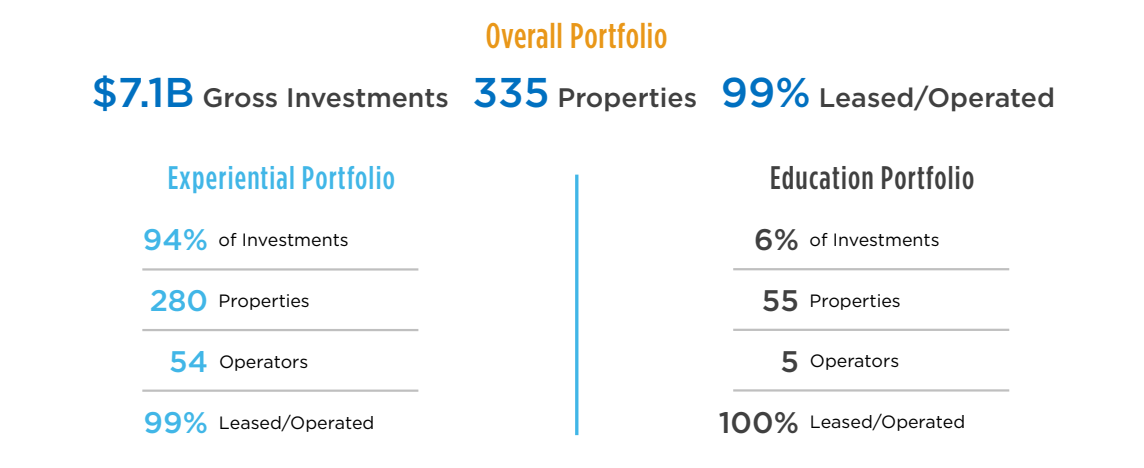
EPR Properties is a premier player in experiential real estate, out-of-home leisure, and entertainment venues. EPR’s portfolio spans across high-traffic destinations such as golf complexes, ski and winter resorts, theme parks, and theaters. This second pick is complimented by the insights shared by Powell during his last press conference heading the FOMC:
Recent indicators suggest that economic activity has been expanding at a solid pace. Consumer spending has been resilient… Inflation has moved up and is elevated, in part reflecting the recent increase in global energy prices.
What Powell signals is that, despite the escalating energy price shock and bump to headline inflation, the US consumer is portraying spending behavior that shows little fear of long-term price pressures.
The Resilient Consumer
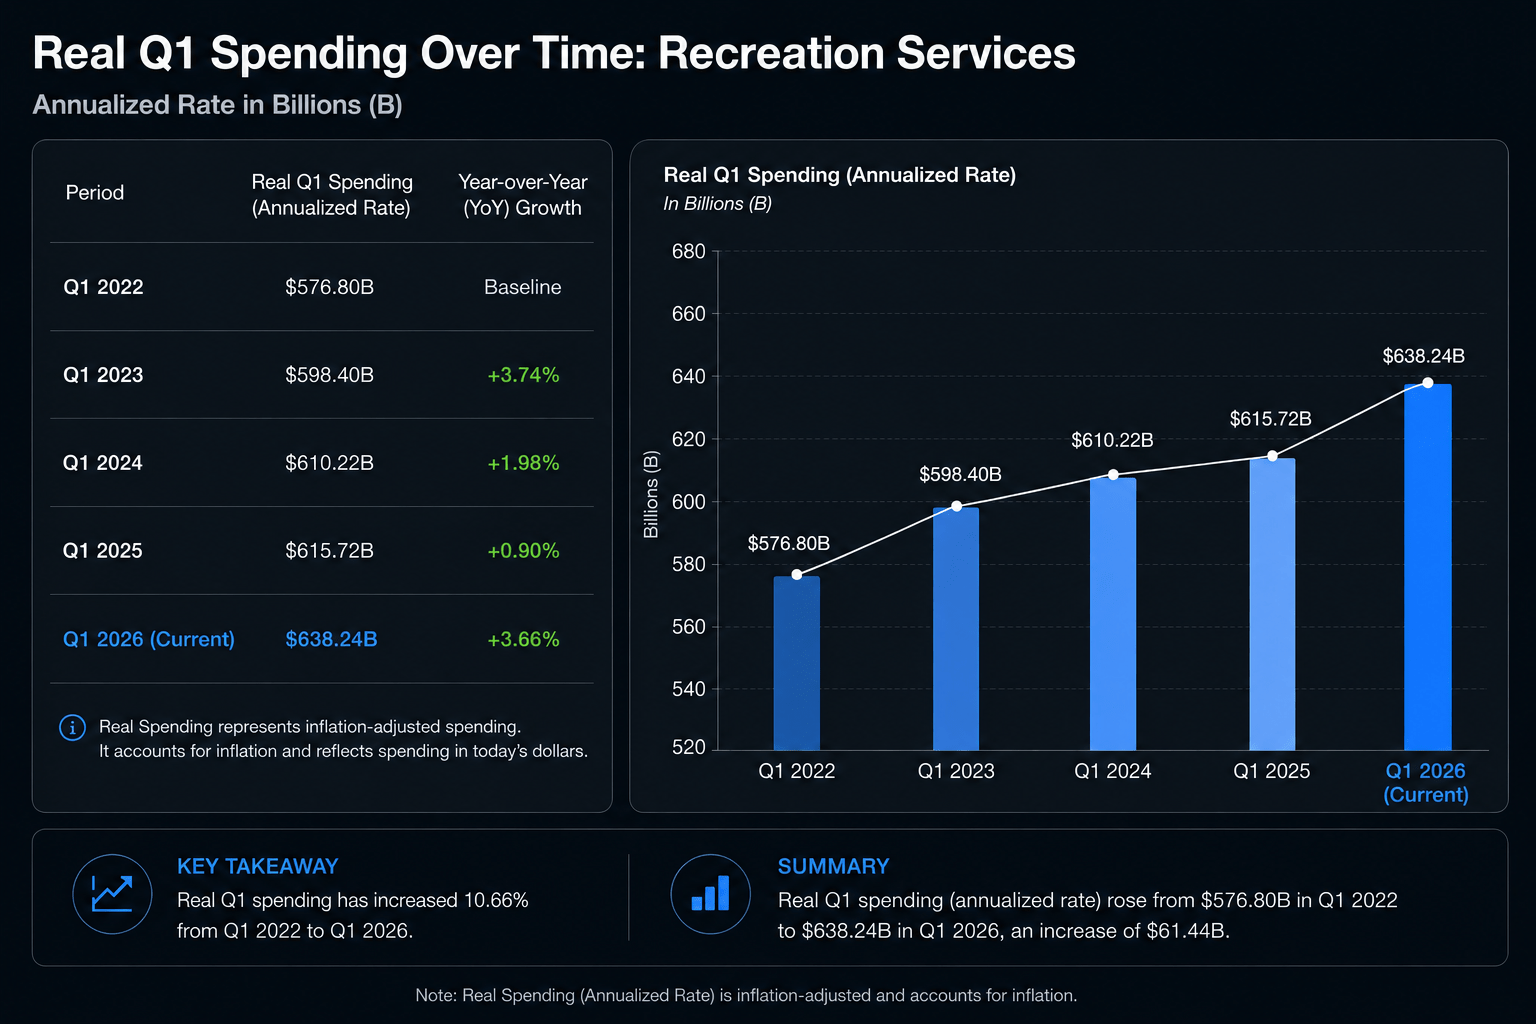
I think it’s important to note that consumers are tightening their belts in some areas, specifically related to certain finished goods expenditures such as motor vehicles, but discretionary spending on real-world experiences and events has remained strong. Today’s consumer has shown an inherent behavior to prioritize memories and experiential services over goods.
Over the past four years, the Federal Reserve instituted one of the most restrictive monetary tightening campaigns in decades. Traditional retail and commercial offices were already struggling to come out of the COVID-19 shock, and the higher cost of capital added salt to the wound.
However, recreational demand not only remained resilient but also showed growth during this period. If you take a look at the image below, you’ll see inflation-adjusted spending from consumers on recreation services over the last five first-quarters.
Seeking Alpha, FRED
This structural foundation of consumer behavior and an expanding market is what creates such a strong tailwind for EPR Properties, as 94% of its portfolio is concentrated in experiential properties.
EPR Earnings Presentation
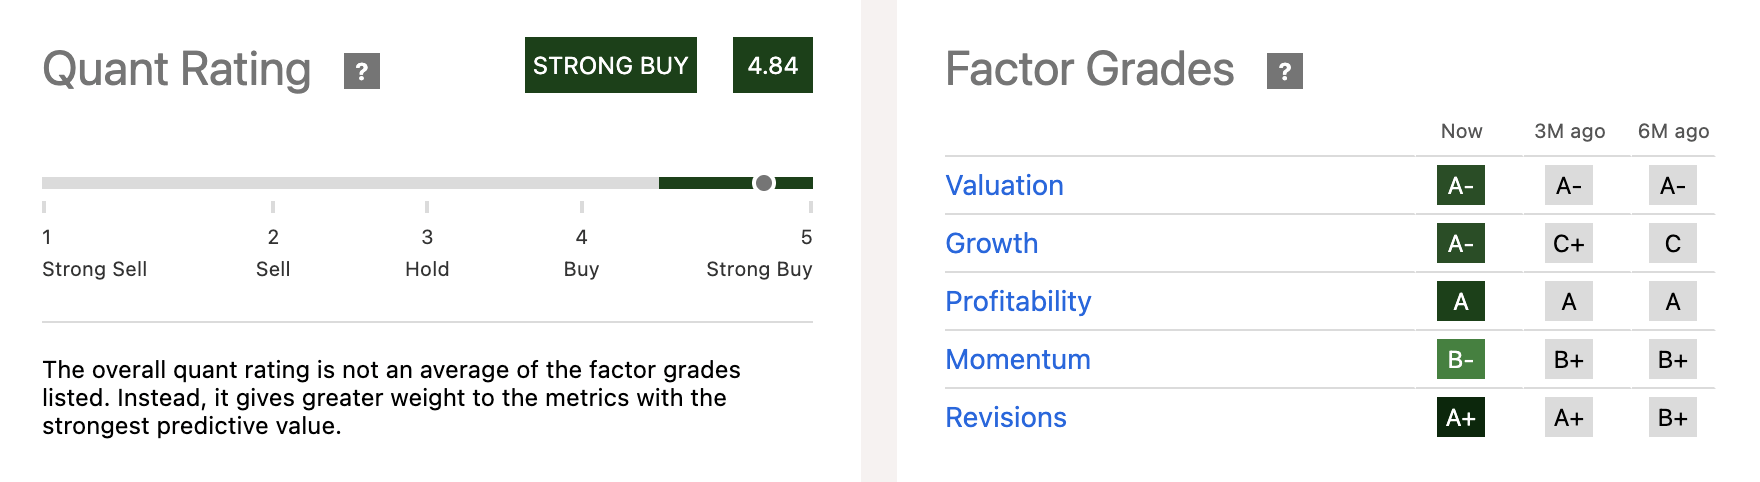
EPR is currently rated as a Strong Buy according to Seeking Alpha’s Quant System, backed by an exceptional suite of underlying Factor Grades.
Seeking Alpha
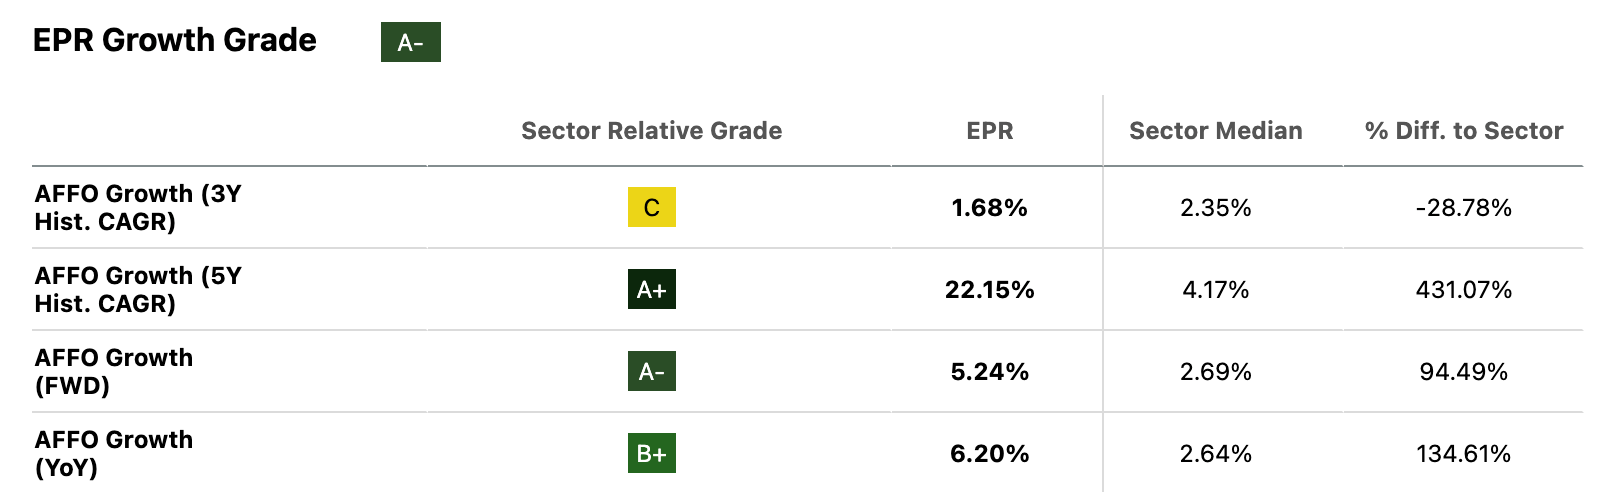
Our Quant System currently highlights EPR’s rapid Growth Grade increase–currently an ‘A-’, when only six months ago it was rated a ’C’. Investors should consider capturing this momentum heading into the summer. As shown below, EPR scores strongly on its AFFO Growth (5Y CAGR and FWD) scores, with its AFFO Growth [FWD] nearly doubling the sector median figure at 5.24%.
Seeking Alpha
In a traditional commercial real estate setup, high interest rates have the potential to derail cash flow as maintenance management costs rise. However, EPR’s triple net lease structure [NNN] protects them from rising inflationary pressures on margins.
Under long-term agreements, tenants are legally obligated to pay for 100% of the property-level costs that are subject to rising input costs. This includes taxes, insurance, and utility costs. This structure has provided an exceptionally strong buffer for AFFO growth.
Additionally, EPR includes annual rent escalators, which are usually tied to the Consumer Price Index [CPI]. This helps to insulate the company’s cash flow from internal cost pressures. And ultimately, providing the basis for a phenomenal dividend profile.
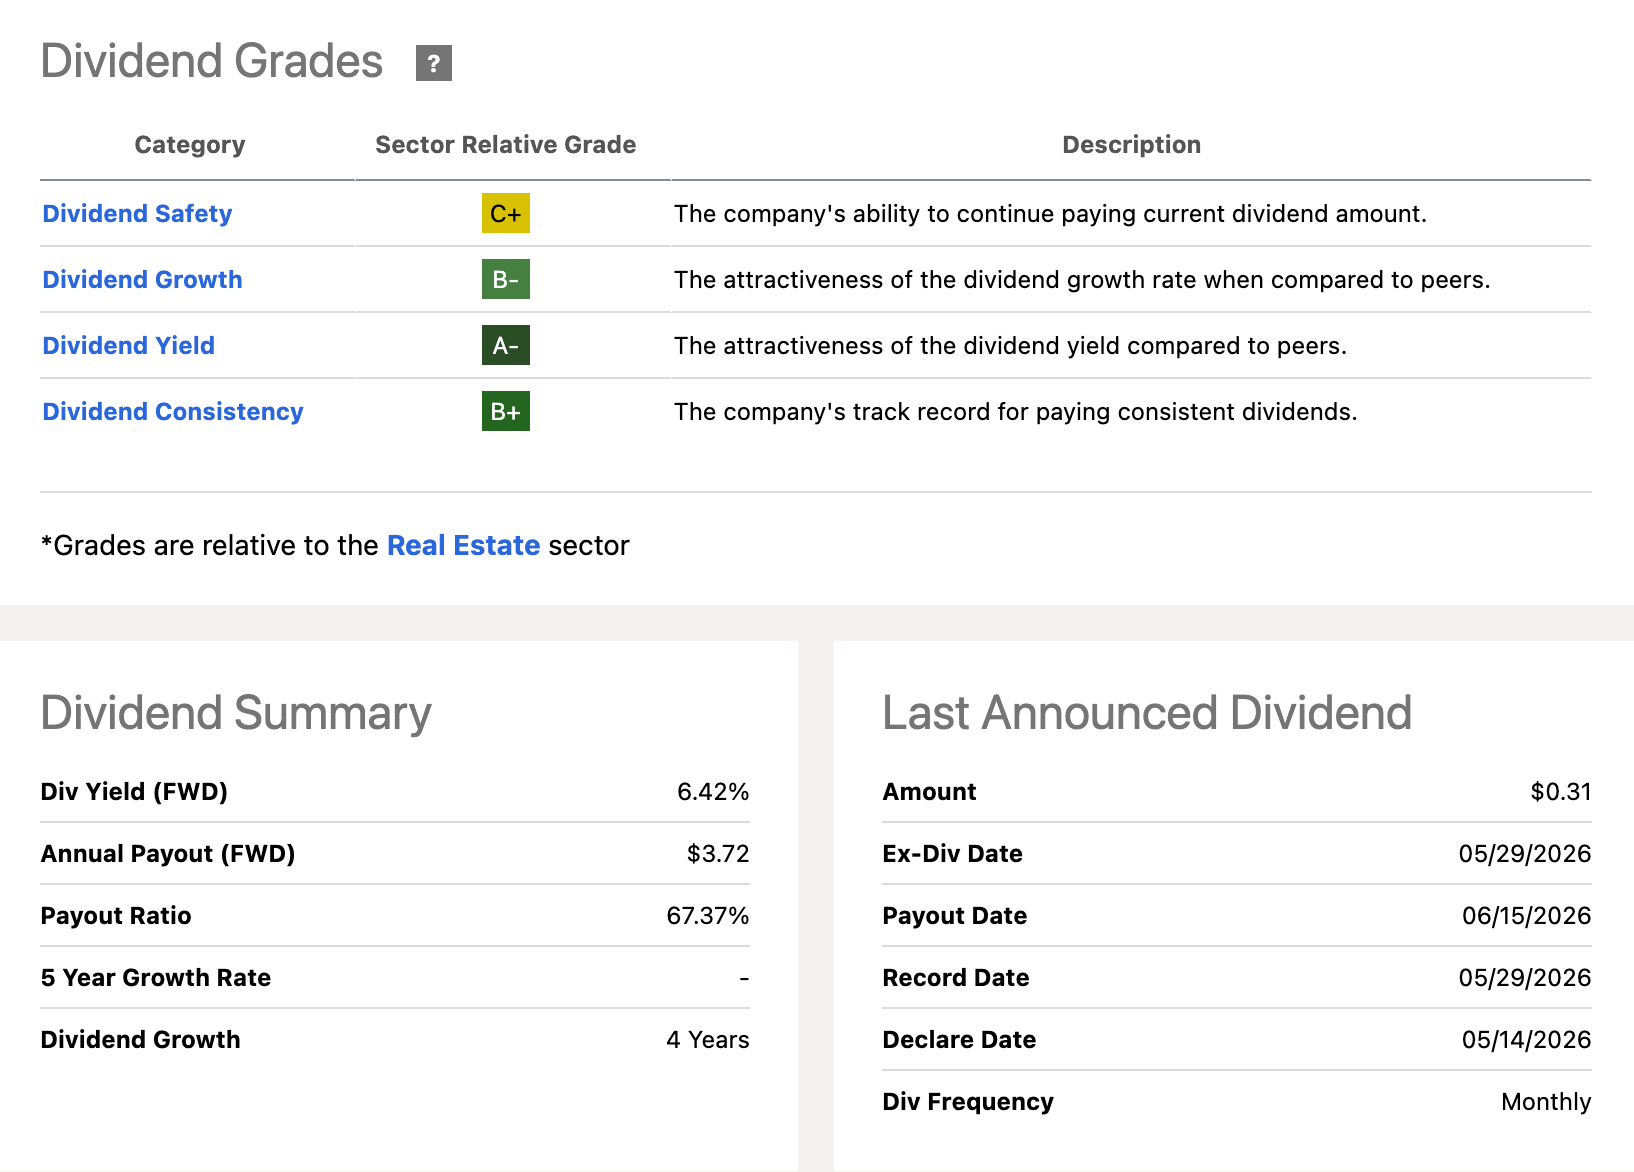
Dividend Grade Scorecard
Seeking Alpha
EPR’s balance sheet strength passes through to its incredible ‘A-’ Dividend Yield Grade. The income profile is headlined by its 6.42% Dividend Yield [FWD], outperforming the sector median by 40%. More importantly, its 9.74% AFFO Yield [FWD] is nearly 47% higher than the sector median and provides a profitable yield gap of 3.42%, anchoring the company for strong growth ahead while protecting its payout.
Seeking Alpha
Looking Ahead: Income Investing Strategies
With yields once again on the move, the passive playbook for income investors is quickly becoming obsolete. Navigating this higher-for-longer rate environment requires active management and a tactical rotation into companies that can not just survive, but thrive.
The coming months could be difficult for growth and value opportunities that lack income-generating payments. It’s probably timely for investors to build a portfolio that can withstand volatile markets amid rising inflation concerns, midterm elections, and geopolitical tensions. Ultimately, today’s picks prove that income opportunities are still very much available in today’s market environment–delivering strong, safe returns while actively shielding your capital from broader market volatility
We have some exciting news to share! The Motley Fool UK has now become The Twelfth Magpie — an independent, UK-owned company, led by our long-serving UK management team — Mark Rogers, Chris Nials and Heather Adlington. In practical terms, it’s the same team you know, now fully focused on serving our UK readers and members.
Just as importantly, our approach remains unchanged: long-term, jargon-free, and on your side. This site is our new home, and there will be extra tweaks made across the coming few days as we settle in. So if anything looks a little off, please bear with us!
How to turn a £20k Stocks and Shares ISA into a second income over time
How to turn a £20k Stocks and Shares ISA into a second income over time
Andrew Mackie looks at how time and compounding can turn a stocks and shares ISA into a meaningful second income.
You’re reading a free article with opinions that may differ from The Motley Fool’s Premium Investing Services.
A Stocks and Shares ISA is not a shortcut to instant passive income — it’s a long-term compounding vehicle.
That matters because many investors focus on what a £20,000 portfolio can generate today, when the real opportunity lies in how that figure can grow through disciplined investing over time.
Used properly, a Stocks and Shares ISA can become the foundation of a second income stream — but only if investors understand how compounding, dividends, and reinvestment work together.
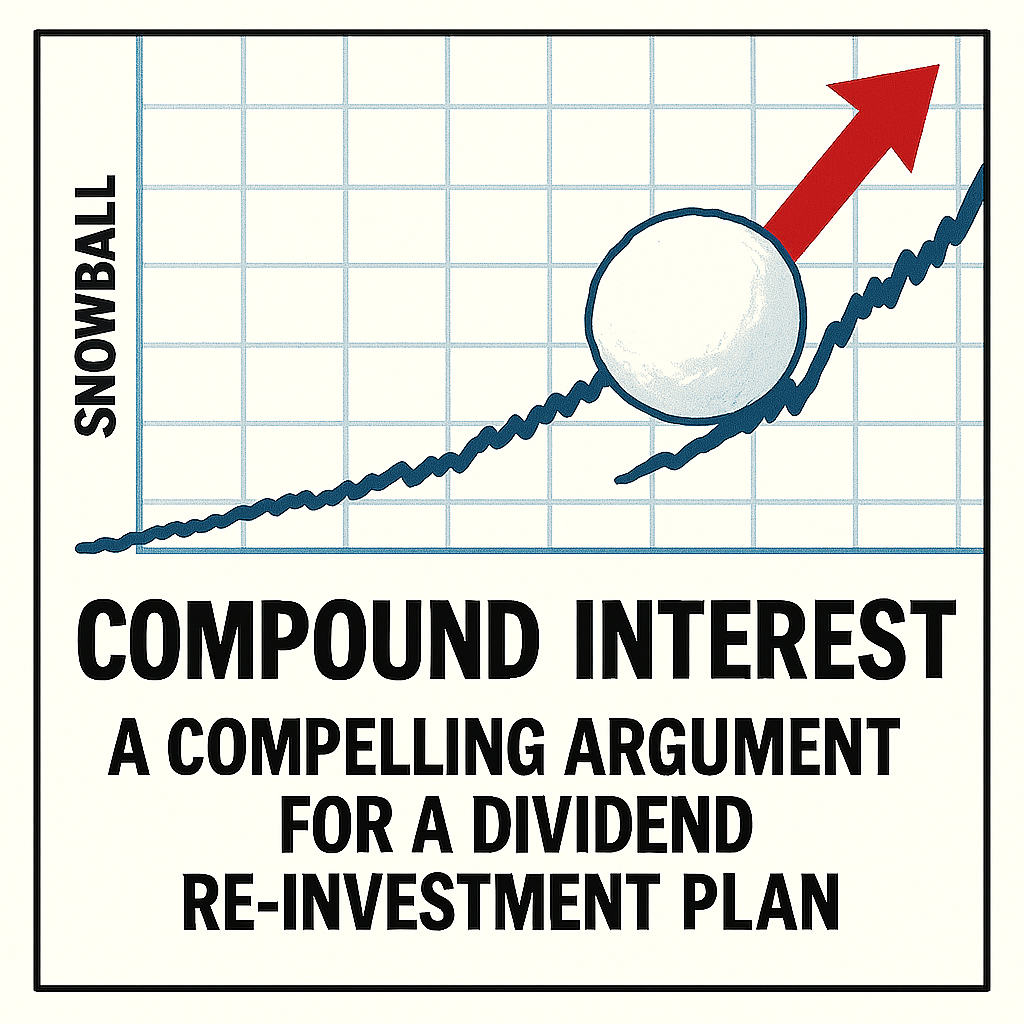
Compounding effect
When building a Stocks and Shares ISA, it’s easy to focus on how much is invested. But the chart below shows something more important than contribution levels or return assumptions.
It compares two investors using the same 8% return over 20 years. One invests a £20,000 lump sum at the start. The other invests £1,000 a year for 20 years.
The outcome is driven by one factor: time.
Money invested earlier has longer to compound. That compounding builds on itself year after year, and the gap widens simply because one portfolio starts working sooner.
This is the core point the chart is designed to show. Not the exact contribution method. Not the precise return assumption. But the effect of time.
Everything else investors tend to focus on — timing, structure, even total contributions — becomes secondary to that simple reality.
The longer money is invested, the more powerful compounding becomes. That’s what drives the difference in outcomes.
Chart created by author
Quality compounder
One business that fits this idea of long-term consistency and compounding is RELX (LSE: REL).
At first glance, recent weakness in the share price reflects concerns that AI could disrupt its legal, scientific, and risk analytics businesses. On the surface, that sounds like a credible threat — particularly in areas like legal research, where large language models are improving rapidly.
However, the business is not built around static content or easily replaceable information. Its strength lies in proprietary datasets built up over decades — particularly in legal and risk markets where precedent, accuracy, and verification matter as much as raw information.
In law especially, AI tools may improve access to information, but they don’t remove the value of structured, validated, and continuously updated legal databases. If anything, the demand for trusted data becomes more important as AI-generated outputs increase in volume.
That’s why RELX has been integrating AI into its own platforms rather than resisting it. Across its divisions, it is using machine learning tools to improve workflow efficiency for lawyers, insurers, researchers, and risk professionals — all within its existing subscription ecosystem.
This creates a different type of investment profile. Growth is not driven by cycles or one-off wins, but by steady subscription renewals and incremental expansion over time.
What could go wrong
The main risk is not sudden disruption, but slower structural growth if AI meaningfully reduces demand for human-led professional services.
Even so, the attraction for me lies in consistency. RELX has demonstrated an ability to compound earnings through multiple cycles, without relying on aggressive assumptions.
The chart earlier illustrates how powerful time can be when compounding is allowed to work uninterrupted. To me, the same principle applies to investing itself. Quality businesses such as RELX are built around long-term consistency rather than short-term excitement — and that is often where lasting wealth creation begins.
I believe investing in UK shares is a great way of aiming to build long-term wealth. Moreover, I reckon The Twelfth Magpie is a fabulous place to start for those looking for ideas which stocks to consider buying.
With this in mind, I’ve been taking a closer look at the rhyme from which the website takes its name. What does it tell us?
One for sorrow
Savvy investors know that having a diversified portfolio is a means of spreading risk. Owning just one share could be a bad decision. Putting all of your investment eggs in one basket is a bad idea.
Two for joy
It’s a great feeling when a portfolio performs well.
Three for a girl, four for a boy
As well as having a diversified portfolio spread across various companies, sectors, and countries, it’s also important to ensure it’s balanced. What does this mean? Essentially, I believe a mix of growth and income stocks is ideal.
Five for silver, six for gold
Appropriately, some of the best performing UK shares over the past 12 months have been miners. Since May 2025, Fresnillo (LSE:FRES), the Mexican gold and silver producer, has seen its share price more than triple as investors have increasingly turned to precious metals as a ‘safe haven’.
However, the stock’s at the riskier end of the scale. Although metal prices have done well, this could quickly change. As a result, it’s impossible to accurately predict the group’s earnings from one period to the next. Also, mining’s operationally challenging.
But demand for gold’s rising, with many of the world’s central banks being the biggest buyers.
Silver’s used in more industrial applications than gold but the market’s been in supply-demand deficit for some time. Solar energy and AI data centres could help push prices higher.
On balance, I think it’s a stock to consider.
We anticipate that at least one of our advanced prospects will join our development portfolio in the coming two to three years. With demand for silver and gold forecasted to exceed supply, driven by the green energy transition and the safe-haven status of gold, Fresnillo is well-positioned to capitalise on the opportunities ahead.
Alejandro Baillères, Chairman, Fresnillo
Seven for a secret never to be told
Sniffing out those hidden bargains is one way of achieving investment success.
Eight for a wish
But it’s essential not to get carried away. It’s important to invest based on a company’s fundamentals rather than sentiment or to follow the crowd.
Nine for a kiss
UK shares have a great reputation for paying generous dividends. For example, there are currently 53 on the FTSE 350 that are paying more than 6%. Of course, dividends are never guaranteed.
10 a surprise you should be careful not to miss
Every now and again, the stock market will throw up something unexpected. The key is to be ready to act quickly.
11 for health
There are plenty of UK shares with strong balance sheets. Understandably, lots of attention is paid to earnings but these are underpinned by a company’s financial health as reflected by its assets and liabilities.
12 for wealth
Ultimately, building wealth is what it’s all about. Personally, I think UK shares are a great way of achieving this.
True North Commercial REIT (TSX:TNT.UN) is one of the resilient office property owners with high portfolio occupancy rates. It’s monthly income distributions yield 8.4% annually, and they are well-covered by cash flow at just 38% of AFFO.
Units trade at a 68.6% discount to their most recent $26.10 NAV.
Canadian passive-income seekers looking to find a high-yielding dividend stock that deposits cash into their brokerage accounts every single month may wish to check out True North Commercial Real Estate Investment Trust (TSX:TNT.UN), or True North REIT.
After suspending its distributions during a turbulent 2023 for office real estate, this pure-play Canadian office REIT made a major comeback by reinstating its monthly payouts in early 2025. Today, its well-covered payout sports a juicy 8.4% annual dividend yield. But is this high-yield REIT a safe bet for your portfolio in May 2026? Let’s take a closer look.
Source: Getty Images
True North REIT: The rebirth of a high-yield passive income stream
True North Commercial REIT’s reinstated monthly distribution promises a reliable, well-covered high-yield passive income payout that could help compound investors’ wealth.
The office REIT owns a portfolio of 37 office properties spanning 4.4 million square feet of gross leasable area (GLA) located across five provinces. While it has some notable concentration of 41.6% of its GLA in the Greater Toronto Area (GTA), the trust’s properties are reasonably diversified across Canada, and it has maintained resilient occupancy levels post-pandemic.
Although overall occupancy rates experienced a dip later in the past year, falling from 92% by March 2025 down to 90% by December, the REIT’s core portfolio boasted a stellar 95% occupancy rate as of March 31, 2025, excluding properties held for sale. To optimize its portfolio, True North has disposed of three properties since the first quarter of 2025, including an Ottawa property held for sale that was vacated in the fourth quarter of 2025.
Crucially, the Canadian national office market continues to trend positively, marking two straight years of positive net absorption and ending 2025 with 2.2 million square feet of net absorption nationally. True North is capitalizing on this leasing momentum, renewing and signing leases at average rates 5% above expiring rents during the first quarter, with tenants locking in a long average lease term of 6.9 years.
An unprecedented safety net
When a dividend stock yields over 7%, the first question investors should ask is whether the high-yield passive income payout is reasonably safe. For True North, the answer lies in its jaw-dropping distribution coverage, with its diluted Adjusted Funds From Operations (AFFO) payout rate sitting at an incredibly conservative 38% for the first quarter of 2026. AFFO measures the most recurring distributable cash flow for REITs, after considering property maintenance and leasing costs.
During the first quarter of 2026, the REIT paid out $2.5 million in distributions while generating $7.3 million in adjusted cash flow from operating activities. It had the capacity to pay more than double its current distribution, proving that the payout is exceptionally well covered by rental cash flows. Furthermore, the REIT’s underlying cash flow is backed by institutional-grade tenants: about 74% are either government tenants (36%) or credit-rated corporate tenants (38%), presenting an exceptionally low default risk.
A deeply undervalued real estate investment trading at 32 cents on the dollar
Perhaps the most compelling reason to consider True North REIT is its wildly high discount to net asset value (NAV). As of March 31, 2026, True North units had an NAV of $26.10, yet the same units exchanged hands at around $8.19 in the public stock market at writing.
Deeply undervalued TNT.UN units trade at a staggering 68.6% discount to their fair value, allowing new investors to buy quality real estate at 32 cents to the dollar. Management has also renewed a unit repurchase authorization that allows it to buy back up to 10% of its outstanding equity units at these heavily discounted prices to create long-term value.
Investor takeaway
True North REIT’s 8.4% high yield monthly payout is a compelling offering for passive income purposes. However, the deep discount on units implies above-average risks. The market is skeptical of the office market since the pandemic, and a recovery is not yet convincing as the Canadian economy shrugs off recessionary pressures.
That said, because regulation requires REITs to distribute most of their earnings to unit holders so they can remain income tax-exempt, the high yield distribution remains a core focus. With an 8.4% yield, an ultra-safe payout ratio, and a massive valuation discount, this monthly cash-payer is well worth a look for passive income seekers today.
A list of high-yielding dividend stocks to consider buying now.
By Matthew DiLallo – Updated May 3, 2026 at 1:48 PM EST | Fact-checked by Frank Bass
Key Points
High-yield dividend stocks typically offer a yield that’s at least double the S&P 500’s level.
Investors should focus on dividend sustainability and company quality over yield alone.
Key stocks like AbbVie and Duke Energy offer stable dividends due to strong financial health.
There’s no official definition of a high-yield dividend stock. However, most investors would classify it as a stock with a dividend yield above a common benchmark, such as the S&P 500 index or a 10-year U.S. Treasury note.
In early May 2026, the dividend yield on the S&P 500 averaged around 1.1%, approaching its record low. Meanwhile, the yield on the 10-year note was around 4.4%, down from its recent peak above 4.8% in early 2025 after the Federal Reserve started lowering interest rates.
Many investors would consider a stock to have a high dividend yield if it were twice the S&P 500 yield; others would require a payout at or above the 10-year Treasury yield. Those baseline measurements aside, investors shouldn’t buy a stock solely because of its dividend yield.
They need to make sure the dividend payments are sustainable. The company should be high-quality, with durable cash flow, a strong balance sheet, and visible growth potential. With all that in mind, here are 20 of the best high-yield dividend stocks to consider buying for dividend income.
Drugmaker AbbVie (ABBV+0.69%) has had an excellent dividend track record. From its inception in 2013 through early 2026, AbbVie has increased its payout by a whopping 330%, including a 5.5% increase in October.
AbbVie has invested heavily in developing new therapies and made several blockbuster acquisitions, including closing its $2.1 billion deal for Capstan Therapeutics in mid-2025. It’s also investing $1.4 billion to build a new manufacturing campus to support the production of immunology, neuroscience, and oncology medicines. These investments put AbbVie in an excellent position to keep dividend income flowing and growing.
As one of the largest apartment owners in the country, Mid-America Apartment Communities (MAA+0.87%) benefits from collecting steady rental income to support its high-yielding payout. The real estate investment trust (REIT) also boasts a top-tier financial profile, which allows it to expand its apartment portfolio by developing and acquiring new communities.
Since its 1994 initial public offering (IPO), Mid-America has never suspended or reduced its dividend. As of early 2026, it had raised its payment for 16 consecutive years, growing it at an 8.3% compound annual rate over the last five years. With demand for apartments continuing to grow, the REIT should be able to keep increasing its dividend in the coming years. The landlord had over $600 million of apartment communities under construction to support its continued growth.
Brookfield Infrastructure (BIP-0.28%) operates a diversified portfolio of infrastructure businesses focused on utilities, transportation, energy (midstream), and data. The businesses generate relatively stable cash flow to support Brookfield’s growing dividend. The infrastructure stock delivered its 17th consecutive annual payout increase in 2026, up 6% from the prior level.
Brookfield envisions increasing its dividend at an annual rate of 5% to 9% over the long term. The company’s growth drivers of inflation-linked rate increases, volume growth as the global economy expands, expansion projects, and acquisitions should grow its funds from operations (FFO) per share by more than 10% annually over the next few years.
Brookfield Renewable (BEP+0.48%) is a sibling company of Brookfield Infrastructure. Brookfield Corporation (BN-0.15%) controls both companies.
This Brookfield entity focuses on renewable energy, including hydroelectric, wind, solar, and energy storage facilities. The assets generate steady cash flow backed by long-term power purchase agreements with utilities and other users, supporting Brookfield’s high-yield dividend.
Brookfield Renewable delivered its 15th straight year of raising its payment by at least 5% in 2026. The company expects to increase its payout at an annual pace of 5% to 9% over the long term. Like its sibling, Brookfield Renewable expects a combination of organic growth drivers and acquisitions to power more than 10% annual FFO per share growth through at least 2031.
Duke Energy (DUK+0.81%) is a leading utility. The company’s electric utilities serve 8.7 million customers across six states, while its natural gas utilities serve 1.6 million customers across five states. Its businesses generate very stable cash flows backed by government-regulated rate structures, enabling Duke to pay dividends since 1926.
Duke has a large-scale investment program underway ($103 billion of capital spending from 2026 through 2030) to expand its transmission and distribution network. These investments should grow its earnings per share by 5% to 7% annually through 2030. Earnings growth should enable the utility to continue increasing its dividends, which it has done each year since 2007.
Main Street Capital (MAIN-2.72%) is a business development company (BDC) focused on providing capital solutions (private debt and private equity) to lower middle market companies (those with annual revenues between $10 million and $150 million). It also provides debt capital to middle-market companies ($150 million+ in annual revenue).
The company’s debt investments generate interest income, while most of its equity investments provide it with dividend income. As a BDC, Main Street Capital must pay out 90% of its taxable net income to shareholders. It does so through a sustainable, steadily rising monthly dividend (136% growth since its 2007 IPO). Main Street Capital also periodically pays a supplemental quarterly dividend (18 consecutive quarters). The company has increased its base monthly dividend payment by 4% over the past year and 11 times since the end of 2021.
The big oil giant’s top financial priority is to sustain and grow its dividend. In 2026, the company delivered its 39th consecutive annual dividend increase, one of the longest streaks among oil stocks. Chevron (CVX+0.26%) has delivered peer-leading dividend growth over the past decade.
Its integrated operations, low-cost oil business, and lower-carbon energy investments position Chevron to sustain and grow its dividend. Chevron expects to grow its free cash flow at a more than 10% compound annual rate through 2030 at $70 oil. As a result, Chevron should have plenty of fuel to continue increasing its high-yielding dividend.
Canadian pipeline and utility giant Enbridge (ENB+0.43%) has been an outstanding dividend stock over the years. It has paid dividends for over 70 years and has increased its payout (in Canadian dollars) in each of the past 31 years.
While the world is transitioning its fuel supply from oil to cleaner alternatives, Enbridge is adapting by investing in infrastructure to support natural gas and renewable energy. The investments have the company on track to increase its cash flow per share by a 3% to 5% annual rate for the next several years, which should support continued dividend growth. Enbridge raised its dividend payment by 3% in December 2025.
Enterprise Products Partners (EPD+0.41%) ranks as one of the top players in the midstream oil and gas market. The master limited partnership (MLP) has increased its payout at least once annually for 27 consecutive years. Its latest raise in January 2026 was 2.8% above the level it paid in early 2025.
The company continues to invest heavily to expand its midstream operations. It had $5.3 billion of major capital projects under construction that it should complete by 2027. The MLP also has a history of making accretive acquisitions. These and future investments should give Enterprise the fuel to continue increasing its dividend.
Procter & Gamble (PG+0.72%) is a leading consumer products company. Procter & Gamble owns top brands that include Bounty, Charmin, and Gillette. Demand for these essential household consumer products is very resilient and steadily rising.
The company has paid dividends for 136 straight years and delivered its 70th consecutive annual dividend increase in April 2026. Procter & Gamble’s strong portfolio of brands positions it to continue growing its high-yielding dividend in the coming years.
Leading healthcare REITHealthpeak Properties (DOC+0.46%) owns a diversified portfolio of healthcare real estate, including medical office buildings, lab space, and retirement communities. These properties generate healthy rental income, giving the REIT great income now and more later.
Healthpeak Properties switched to paying monthly dividends in 2025. It also resumed dividend growth. Healthpeak is upgrading its portfolio by selling some of its outpatient medical properties to fund development projects and lab acquisitions. It created a new REIT (Janus Living) to unlock the value of its senior housing properties. These enhancements should enable the REIT to continue growing its high-yielding dividend.
Regions Financial (RF+0.43%) is one of the country’s largest banks, focusing on the South and Midwest. It has a long history of paying dividends. While the company reset its payment level during the 2008-09 financial crisis, it has increased the dividend 20-fold since that time.
It gave investors another raise in 2025 (a relatively minor one at 6%). With its banking and financial services businesses growing, Regions should be able to continue increasing its high-yielding payout in the future.
Extra Space Storage (EXR-0.42%) is a REIT focused on owning, operating, and managing self-storage facilities. Over the past decade, it has been one of the best-performing self-storage REITs.
A big driver is its rapidly rising dividend. Extra Space Storage has increased its payout by a peer-leading 10.3% annualized over the last 20 years, and more growth seems likely. The self-storage REIT has a strong balance sheet, giving it ample flexibility to continue making new investments as opportunities arise.
Will AI create the world’s first trillionaire?
One little-known company, called an “Indispensable Monopoly” owns the technology Nvidia, AMD, and Intel cannot function without. And it is still just a fraction of Nvidia’s size.
We just released a brand-new report with the full story and the company’s name. Continue ›
NNN REIT (NNN+0.04%) is a REIT focused on single-tenant retail properties secured by triple-net (NNN) leases. That lease structure provides it with very stable rental income, supporting its high-yielding dividend.
The company has one of the best dividend track records in the REIT sector. It extended its annual dividend growth streak to 36 straight years in 2025, the third-longest streak in the industry. Its strong financial profile should enable NNN REIT to continue expanding its portfolio and dividend payments.
Pfizer (PFE-0.12%) has paid dividends for 350 consecutive quarters, increasing them for 16 consecutive years. The pharmaceutical giant’s investments in research and development (R&D) are paying off. The company developed one of the first COVID-19 vaccines and followed up with a successful oral treatment.
The commercial successes have enabled Pfizer to continue making research and development investments and strategic acquisitions (it bought Metsera for up to $10 billion in cash in late 2025). These investments should boost Pfizer’s cash flow, enabling it to continue increasing its dividend payments.
VICI Properties (VICI+0.00%) is a REIT focused on owning experiential real estate, such as casinos and bowling entertainment centers. The company leases those properties back to operating companies under long-term NNN leases. The agreements supply it with steadily rising rental income from annual rate increases.
The company also steadily invests in new gaming and nongaming real estate. VICI Properties’ growing income has enabled it to increase its dividend in each of the eight years since its formation. It has grown its dividend at a peer-leading 6.6% compound annual rate since 2018, well ahead of the sector’s 2.3% average.
Realty Income (O-0.34%) lives up to its name. The REIT, which pays a monthly dividend, has made 670 consecutive payments. Even better, it has increased its payout more than 134 times since its IPO in 1994, expanding it at a 4.2% compound annual rate. That adds up to 31 consecutive years of steady dividend growth.
A steady diet of acquisitions has driven its growth. Realty Income purchases properties in sale-leaseback transactions, acquires larger property portfolios, and merges with other REITs to grow its portfolio, rental income, and dividend. It plans to invest $8 billion in new properties in 2026, which should increase cash flow per share and drive continued dividend growth.
Telecommunications giant Verizon (VZ+0.17%) has been a great income stock over the years. In late 2025, the company delivered its 19th consecutive annual dividend increase, the longest current streak in the U.S. telecom sector.
Verizon should be able to continue increasing its dividend as it invests to transition its mobile network to 5G, bringing faster data speeds to its customers. The company closed its $20 billion acquisition of Frontier Communications in early 2026, a deal that will increase the scale of its fiber operations and its earnings.
Mutual fund manager T. Rowe Price (TROW+1.41%) has a long history of paying dividends.
The company raised its payment by 2.4% in early 2026, marking its 40th straight year of dividend growth. That steady dividend growth should continue as the company grows its assets under management (AUM) and its clients entrust it with more of their money.
PepsiCo (PEP+1.16%) has an illustrious record of paying dividends. The global snacking and beverage giant extended its dividend growth streak to 54 in a row in 2026. That put it in the elite group of Dividend Kings, a company with 50 or more years of annual dividend increases.
The iconic company invests heavily in new product innovation, productivity enhancements, and other drivers to grow its revenue and profit margins. It also routinely acquires snack and drink brands that consumers love (it paid almost $1.7 billion for Poppi in 2025). PepsiCo’s continued investments should enable it to maintain its exceptional track record of dividend growth.
What to consider before investing in high-yield dividend stocks
Whether the company has the financial strength to sustain its high-yielding dividend if market conditions deteriorate.
If investing in a company with a lower yield but higher growth and total return potential may be better for your financial situation.
Signs that the stock might be a dividend yield trap.
If the company can increase its dividend in the future.
Pros and cons of investing in high-yield dividend stocks
Investing in high-yield dividend stocks has its share of benefits and drawbacks. Some of the pros include:
More income: Investing in high-yield dividend stocks enables you to generate more dividend income from every dollar you invest compared to lower-yielding stocks or those that don’t pay a dividend.
Lower volatility: High-yielding dividend stocks tend to be slower-growing companies and are often less volatile.
Higher long-term total return potential: Higher-yielding dividend stocks can often deliver higher total returns over the very long term as dividend income accumulates.
On the other hand, here are some cons of investing in higher-yielding dividend stocks:
Potentially higher risk profile: Some higher-yielding dividend stocks are at greater risk of dividend reductions due to high payout ratios or weaker financial profiles.
Slower growth: Most higher-yielding dividend stocks are slower-growing companies.
How to invest in high-yield dividend stocks
Here’s a step-by-step guide on how to invest in high-yield dividend stocks:
Open your brokerage app: Log in to your brokerage account where you handle your investments.
Search for the stock: Enter the ticker or company name into the search bar to bring up the stock’s trading page.
How to Build a High-Yield Dividend Portfolio
Buy at least 10 stocks
Diversify across several sectors
Invest in a mix of higher-yielding, slower growth stocks as well as those offering a lower yield but more dividend growth potential
Focus on dividend sustainability and growth over a stock’s current yield.
The bottom line
All 20 of these dividend stocks offer above-average yields, making them stand out in a time when many companies don’t pay high dividends. Even better, each one has a solid track record of steadily increasing its dividend and showing no signs of stopping. That makes them great income stocks to buy and hold for the long haul.