How London’s investment companies fared in Q1 2024
With Q1 coming to a close we take a look at which Investment Trusts, stocks and sectors have caught the eye.
ByFrank Buhagiar•17 Apr, 2024
Phew, that was quick – anyone else think Q1 2024 flew by in the blink of an eye? With the first quarter of the year done and dusted, that can mean only one thing – it’s time for our Q1 round-up of the movers and shakers in London’s investment trust space. Which funds had a good quarter? And which trusts had one to forget?
Q1 – An Overview
JPMorgan provides an overview for the year thus far: “2Q24 was generally a good one for stock markets, with the US a key driver, with the S&P500 up 11.8% (all figures in £), also driving the MSCI World Index, which was up 10.2%. Growth outperformed value, with the MSCI World Growth up 11.5% and MSCI Value up 8.7%. Japan was also a notably strong performer, with TOPIX up 11.1%, and Europe outperformed EM and Asia ex Japan with a 6.8% return from the FTSE Europe ex UK. The UK, as measured by the FTSE All Share, was up 3.6%, with large caps outperforming mid and small (FTSE 100 +4.0% vs FTSE 250 +1.6% and Numis SC ex ICs +0.2%).”
A positive quarter for markets then, but was it a positive quarter for investment companies?
Back to JPMorgan: “The overall sector, as measured by the FTSE Closed End Investments sector (which does not include 3i), was up 2.3% over the quarter.” So, positive performance for the sector, although not enough to match the All Share, let alone the double-digit returns seen in the US or the MSCI World Index.
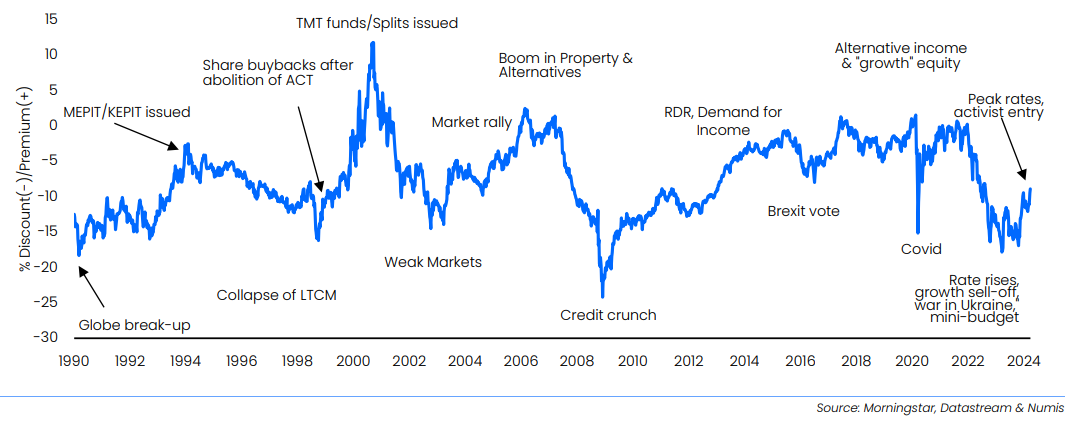
As for the discounts at which share prices traded at compared to underlying net assets, Numis reports a marginal widening of discounts during Q1: “Our figures, show that the average discount of the universe, excluding 3i Group, widened slightly in Q1 from 13.9% at December to 16.0% at 31 March. This included discounts on Equity ICs widening marginally from 10.1% at December 2023 to 11.5% at 31 March, whilst Alternative Asset ICs, excluding 3i, widened from 19.6% to 23.1%.”
Where does an average discount of 16% fit historically? Numis provides the graphic below:
Investment Companies Universe – Long-term discount history
A 16% discount, nothing like the depths seen during the Credit Crunch, but equally some way off the premia that prevailed in the early 2000s.
Winners and losers at the sector level
The 2.3% generated by the closed-end index over the quarter is just a headline, one that masks a wide dispersion of returns at the sub-sector level – as Numis writes, “we caution that the universe is so diverse that aggregated figures are of limited use.” To see what the broker means, look no further than the winners and losers at the sector level.
Winners first, funds with tech exposure stand out – no surprise given the continued strong showing by the US tech mega caps. Numis notes: “Technology ICs continued to lead the pack, with the technology exposure also benefiting North American ICs and Global ICs in absolute terms, albeit most ICs lagged benchmarks, which remain concentrated on a few mega-cap stocks.”
At the other end of the scale, Numis writes: “The expectation of higher for longer rates impacted sentiment towards Infrastructure ICs, including Renewable Energy ICs, where investors were also wary of lower power prices. Battery Storage funds were notable laggards as the challenging revenue environment led to dividend suspensions.”
The graphic below from JPMorgan adds some colour in the form of the relevant numbers for all subsectors:
AIC Sector price TR (%) 1Q24Renewable Energy Infrastructure off 12.8% during the quarter, Technology & Media up 17.3% – the two bookends. In between, a wide range of returns.
Winners and losers at the stock level
The same is true at the stock level. The worst performing fund in Q1 declined -62.4%, the best performer rose 43%. Among Q1’s worst performers, unsurprisingly, renewables, specifically battery storage investment companies, feature heavily in the below list from JPMorgan:
Q1 24 Worst performance (% price TR)
Similarly, tech-focused names such as Manchester & London, Polar Cap Technology and Allianz Technology feature in JPMorgan’s below graphic for Q1’s top-performing trusts:
Q1 24 Best performance (% price TR)
Interestingly, last year’s top-performer 3i Group (III) follows up this year with a 16% Q1 gain, enough to place the private equity giant in joint ninth.
Eagle-eyed readers will have no doubt noticed the clumsy crossing out of the name of Q1’s top-performing investment company. No accidental spilling of ink here. Instead, a clumsy attempt to build up a little suspense. The big reveal though cannot be put off any longer. The top-performing investment company in Q1 2024 is none other than space investor, Seraphim Space (SSIT) courtesy of an eye-catching 43% gain.
Question is, after such a stellar opening three months of the year, can SSIT kick on
from here and consolidate top spot? It’s a question that’s been on broker Winterflood’s mind too if the title of their recent note is anything to go by.
Seraphim Space (SSIT): Stick or Twist?
Firstly, hats off to Winterflood for including SSIT in its 2024 Recommendations List. SSIT’s inclusion was “based on the structural tailwinds benefiting the SpaceTech sector, tangible progress at the portfolio company level and a share price which roughly implied that all but the fund’s top two holdings were worthless.” Following the strong share price performance, Winterflood used the release of SSIT’s interim results in March to ask, “is it time to take profit, or does substantial runway remain (either from a ratings or underlying performance perspective)?”
In terms of numbers, SSIT reported a 1.8% increase in NAV per share. In terms of words, Chair Will Whitehorn sounded cautiously optimistic in his statement, “Indications of inflation being tamed and interest rates having peaked has resulted in some evidence of improved sentiment in both the private and public markets. We continue to believe that SSIT’s current cash reserves are sufficient to meet the near-term capital needs of the portfolio”.
Winterflood found the results encouraging: “There are certainly encouraging signs in these results, with portfolio company fundraising clearly illustrating investor demand. Sector tailwinds remain intact, with satellite imagery in high demand across applications such as national defence and sanctions compliance. This is reflected in the market, with VC investment in SpaceTech flat YoY in 2023 vs -35% for VC investment overall. In particular, the guidance on c.40% of the portfolio (by value) showing positive EBITDA by year-end is constructive, and with 60% of the portfolio funded to profitability, concerns around cash constraints should be eased.”
So, even though Winterflood “can see how locking in profits on SSIT may be tempting at this stage, particularly if the position was initiated recently”, the brokers “point out that the SSIT discount remains relatively wide at 36%”. What’s more, “we see room for further tightening as the year progresses, alongside the potential for valuation uplifts as portfolio companies raise funds and execute on their targets and partnerships. We therefore reiterate the fund’s inclusion in our 2024 Recommendations.”
All to play for
Winterflood thinks SSIT can kick on from here then. But will it be enough to hold onto top spot? Or will III manage to chip away at the lead? Perhaps another fund will come from nowhere to finish top of the tree? After all, the race to be the year’s best is only just beginning.
The Results Round-Up – the week’s Investment Trust results
By Frank Buhagiar
Schroder Japan Trust (SJG) partying like its 1989 SJG posted a +10.3% NAV total return for the six months to 31 January 2024. That’s comfortably above the benchmark’s +9.1% increase. Share price couldn’t quite match that though, returning +5.8% over the period. In his statement, Chairman Philip Kay puts the outperformance down to “strong stock selection across machinery, glass and ceramics, and information and communication. From a style perspective, holdings of value stocks outperformed the growth portion of the portfolio. The use of financial leverage was also helpful to performance over the period.”
Looking ahead, Kay notes: “The Japanese equity market has enjoyed a strong start to 2024 and, symbolically, the Nikkei 225 Index has recently exceeded its previous high achieved in 1989. The Board remains very positive on the long-term equity market outlook because corporate Japan is in the middle of a major transformation which is already resulting in improved shareholder returns.” Now it’s true “there have been many false dawns when the performance of the Japanese equity market has failed to live up to investor expectations. But your Board believes that, this time, there are real positive structural shifts in motion.” Because of these, “we remain very positive on the long-term outlook for the Japanese market and are firmly of the view that the Company is the best vehicle through which to capitalise on the opportunities presented by corporate change and an improving fundamental backdrop.”
Winterflood: “Board will propose 25% tender offer at prevailing NAV less costs if SJG’s NAV TR fails to exceed benchmark by 2% p.a. over 4 years to 31 July 2024. From 1 August 2020 to 31 January 2024, SJG has returned +4.4% above the benchmark on an annualised basis.” A handy buffer then with three or so months to go.
HydrogenOne Capital Growth (HGEN) focusing on what it can control HGEN’s NAV and share price had very different years. According to the hydrogen investor’s Annual Report, NAV “increased by 5.8% from £125.4 million at 31 December 2022 to £132.7 million at 31 December 2023 due to valuation uplifts in multiple portfolio companies. NAV per share increased to 102.99p at 31 December 2023”. By contrast, “the share price fell from 79.30p to 49.65p and the discount to NAV increased from 18% to 52% as rising interest rates put pressure on investment trust discounts”. Chairman Simon Hogan “had hoped to report an improved share price this year. However, the share price remains at a steep discount, despite an increase in NAV in 2023, as is the case for many listed funds presently.”
Hogan however remains upbeat: “The outlook for the clean hydrogen sector remains positive and we believe that the portfolio can generate attractive returns over time. We fully support the Investment Advisor’s strategy of investing in a diversified portfolio of hydrogen assets, across the value chain.” In the meantime, the focus is on what can be controlled “Whilst macro-economic factors are outside of our control, we believe that selective investment, stewardship of the portfolio, and divestments can positively impact our NAV, and improve the share price over time.”
Winterflood: “NAV per share +5.8% to 102.99p driven primarily by valuation uplifts to private assets as a result of roll-forward of DCF valuations and improving financial performance. Seven of the portfolio’s ten private companies are revenue generating. HGEN had cash of £4.7m and £2.3m invested in listed hydrogen companies at the period-end.”
Fair Oaks Income 2021 (FAIR) looks set fair FAIR reported a +12.98% NAV Total Return for the year ended 31 December 2023. The share price FAIRed even better, generating a total return (with dividends reinvested) of +30.94%. For comparison, the total return for the JP Morgan US leveraged loan index in 2023 was +13.17%, the JP Morgan US high yield returned +13.77% and the JP Morgan US CLO B rated index +26.77%. The Investment Adviser believes, “the focus on originating and controlling CLO (Collatorised Loan Obligations) subordinated note investments has resulted in superior fundamental performance.” Lower fees have also helped: “Lower fees in primary investments also allowed the construction of more conservative portfolios with no need to ‘stretch for yield’. As a result, the Master Funds have benefited from below-average exposure to sectors such as retail or energy.”
And the Investment Adviser thinks FAIR is “well positioned to generate attractive risk-adjusted returns in 2024” Reasons cited include: “Interest rate expectations: Fed and ECB rate cuts may support investor demand for risk assets, potentially supporting CLO liabilities. The potential for lower CLO financing rates will support new CLO equity investments and the optimisation of the capital structure of existing CLO equity investments”. And the “Existing, high-quality portfolio: all CLO equity and debt investments made their scheduled distributions in 2023.” Because of the above, the Adviser continues to “believe that the high-quality portfolio of primarily first-lien, senior secured loans with attractive term, non-mark-to market financing represents one of the most attractive risk-adjusted opportunities available to investors in the current market environment.”
Liberum: “The shares trade close to par now and we believe the return outlook remains attractive. The underlying loans that fund the CLO equity and CLO liabilities are senior secured bank loans that sit above high yield debt and preferred stock. We are BUYers with a target price of $0.66.”
Numis: “Fair Oaks Income is an attractive investment for investors that are seeking to generate a high yield and have a relatively high-risk tolerance. We believe that the future looks positive for Fair Oaks Income, owing to its conservative, high quality portfolio with strong fundamentals, which results in a lower default rate relative to the market.”
Middlefield Canadian Income’s (MCT) doubling discount MCT’s NAV Total Return for the year ended 31 December 2023 came in at -1.4%, a little way off the benchmark’s +3.9%. The North American equity income investor’s share price fared worse – total return of -10.7% as the discount more than doubled to 16.8% from 7.5%. Better news on the dividend front – the full-year payout came in at 5.2p, a 0.1p increase on 2022’s 5.1p. Okay, the smallest of rises but a rise is a rise. And MCT plans another for 2024, dividend per share for the year is expected to be 5.3p.
Winterflood: “Stock selection within Energy sector was biggest detractor. Utilities also detracted. Positive contribution from underweight exposure to Communications Services and stock selection in Real Estate”.
This week’s Discount Watch sees another big drop in the number of investment companies trading at 52-week high discounts – down nine to 18 from 27.
ByFrank Buhagiar•15 Apr, 2024
We estimate there to be 18 investment companies whose discounts hit 12-month highs over the course of the week ended Friday 12 April 2024 – nine less than the previous week’s 27.
True, big drop at the headline level from 27 to 18, but no change in terms of which sector accounts for the lion’s share of funds trading at year-high discounts – renewable energy infrastructure. Once again, seven renewables-focused Trusts make it onto the list. On the positive front, UK Equity Income funds appear to be over their bad case of discountitis. It was only Week 12 when the sector contributed seven names to the list. Week 15 and the tally is down to just one fund.
This 1 simple investing move accelerated Warren Buffett’s wealth creation Story by Christopher Ruane The Motley Fool
There are a few reasons Warren Buffett has been such a phenomenally successful stock market investor.
One is his long-term approach to investing. Another is his focus on trying to buy quality companies with attractive valuations instead of dredging the market for shares with low prices regardless of business quality.
But I think one simple investing move more than any other helps explain the huge scale of Warren Buffett’s wealth-creation. His company, Berkshire Hathaway (NYSE: BRK.A)(NYSE: BRK.B), has a market capitalisation of $825bn.
Best of all, I could use exactly the same investing technique as a private investor even if I just had a few hundred pounds to invest, rather than Buffett’s billions. A snowball made of cash There is a clue to what that technique is in the fact that Berkshire earns billions of dollars annually yet does not pay a dividend.
What does it do with all that money?
The company reinvests it, both in growing its existing businesses and buying new ones.
This technique is known as compounding. Compounding, according to Warren Buffett, is like pushing a snowball down a hill. The further it goes, the more snow it picks up and in turn that snow gets even more snow.
So, if I had £1,000 and it compounded at 8% annually, after a decade it would have turned into £2,159. But after twice as long it would have turned into more than twice that much: £4,600, in fact.
Building the snowball So how has Warren Buffett managed to use compounding to such incredibly lucrative effect?
First, Berkshire has strong sources of cash thanks to investing in highly cash generative businesses. For example, it owns utility and railway businesses that have little competition and resilient customer demand.
On the other side of the equation, rather than paying that cash out to Berkshire shareholders, the company reinvests them in buying new businesses or shares. Sometimes, if Warren Buffett cannot find businesses in which he wants to invest at their current share price, he saves the cash up for possible future acquisitions.
Applying the Buffett approach Berkshire owns stakes in companies such as Apple and Coca-Cola. In fact, investing in shares I could buy myself as a private investor has been a large part of Berkshire’s wealth creation machine.
But what is right for the company is not necessarily right for me. Apple shares are now considerably more expensive than when Warren Buffett bought them. I see a risk that they could lose some of their value as competitors ratchet up the pressure on the tech giant, hurting the valuation of Berkshire’s stake.
However, the investing principle of compounding absolutely does make sense for me, I feel.
It is a simple, proven, and surprisingly effective way to grow the value of a portfolio, for example, by using any dividends earned to buy new shares.
It has worked brilliantly for Warren Buffett – and I think it could help me build wealth too.
3 shares I’d buy for passive income if I was retiring early
Story by Roland Head
Provided by The Motley Fool
I’m hoping to retire early. To maximise my chances of success, I’m investing now to build a reliable passive income portfolio. My plan is to use this to replace some of my earnings when I start moving towards retirement.
In this piece, I’d like to discuss three FTSE 350 stocks that tick the boxes for me and might find a place in my portfolio, if I had cash to invest today.
A rising 8.8% yield
My first choice is already one of the larger positions in my personal portfolio. FTSE 100 financial services giant Legal & General Group (LSE: LGEN) provides retirement and life insurance services and has more than £1trn of assets under management.
Legal & General has been in business since 1836 and has a strong record of cash generation and dividend growth. The current shareholder payout of 20.3p per share has grown from 1.9p in 1994.
Dividends have only been cut once in the last 30 years, during the 2008/9 financial crisis.
Much-loved brands
FTSE 250 soft drinks group Britvic (LSE: BVIC) is best known for brands such as Robinsons, Tango and Rockstar. What investors may not realise is that Britvic’s also the exclusive bottler and distributor for PepsiCo brands in the UK.
In addition to this, the company also has a faster-growing international business in Brazil, which is potentially a larger market than the UK.
One concern for me is that Britvic has slightly more debt than I’d really like to see. But the company’s defensive products are affordable treats that tend to generate very stable sales. So I don’t think debt’s a big risk here.
Shareholders have been rewarded by steady dividend growth since Britvic’s flotation in 2005. The stock’s current 3.9% yield looks fairly safe to me. I expect the dividend to continue rising over the coming years.
Powering the future
UK utility group National Grid (LSE: NG) is investing heavily to build out its electricity infrastructure to meet growing demand. Electric vehicles and the expansion of renewables are among the trends placing new pressures on the grid
Much of National Grid’s income is governed by the national regulator, so its returns should be fairly predictable. Of course, there will always be some uncertainty and risk, especially as UK utilities rely heavily on debt funding.
Even so, I expect National Grid’s 27-year record of dividend payments to remain safe for the foreseeable future.
Broker forecasts suggest a yield of 5.7% for the year ended 31 March.
The post 3 shares I’d buy for passive income if I was retiring early appeared first on The Motley Fool UK.
It can be exciting thinking about the possible returns of investing in the stock market. That helps explain why some people rush into it and start investing before they really understand what they are doing.
If I was going to begin investing for the first time, here are five things I would like to know.
Costs matter Some investment trusts charge an annual management fee, often a low-single-digit percentage number. Buying or selling any shares usually also attracts fees. They can also sound low on paper, again in the single-digit percentage range.
But a few percentage points here and a couple of percentage points there can soon add up. The more one trades, the sooner such costs are likely to add up.
I would begin by comparing different share-dealing accounts and Stocks and Shares ISAa to see which one looked most appropriate for my needs.
The future is not the past Past performance can be very helpful when investing. For example, knowing how a business did in the past can help me decide whether its business model looks proven and what sort of seasonality it has.
But past performance is not necessarily a guide to what comes next, even for a proven business with a long history. Fortunes have been lost by investors sinking money into fallen giants, only to see them keep on falling.
Chasing yield is a fool’s errand The dividend yield is the amount one receives each year as dividends as a percentage of the cost of the shares.
For example, Diversified Energy currently has a yield of 16%. If that is sustained, spending £100 on Diversified shares today ought to earn me £16 in dividends annually. Even at a time of high interest rates, that sort of yield grabs my attention.
But dividends are never guaranteed. A common mistake when people start investing is simply to look at yields, without understanding the business concerned. A high yield alone tells me nothing. Instead, I need to understand the business concerned and judge how able I think it will likely be to maintain its shareholder payout.
Diversification is simple but important Many people have their eye on what they think is an amazing share when they start investing. Anyone who has ever heard someone in a pub drone on about how they almost bought Amazon or Tesla shares before the companies grew huge, will have experienced this first-hand.
While some companies do well, others perform terribly. There are lots of ways to form an opinion on what is likely to happen – but there is no way to know for sure ahead of time.
By spreading my eggs over multiple baskets, I can reduce the risk to my portfolio if one share I choose later performs badly.
Stay calm Investing involves risking one’s money. The twists and turns of the stock market can seem exciting – or nerve-racking.
Investing is ultimately about making money. I think a valuable lesson when one starts investing is always to stay calm and try to avoid emotionally driven decision-making.
As legendary investor Warren Buffett says: “When forced to choose, I will not trade even a night’s sleep for the chance of extra profits.”
The post 5 things to understand before you start investing appeared first on The Motley Fool UK.
Passive income stocks: our picks Do you like the idea of dividend income?
The prospect of investing in a company just once, then sitting back and watching as it potentially pays a dividend out over and over?
If you’re excited by the thought of regular passive income payments, as well as the potential for significant growth on your initial investment… Then we think you’ll want to see this report inside Motley Fool Share Advisor — ‘5 Essential Stocks For Passive Income Seekers’.
Not entirely coincidentally, this year has seen something of a focus on fitness.
Central to all these activities — well, apart from doing them in the first place — has been a process of data collection and analytics.
Fitbit makes it easy: you can download your personal statistics in spreadsheet format, which makes charting your progress very straightforward. My regular walks have become faster, and easier. They may yet turn into runs. And looking at the 5K data, progress is discernible.
It’s what I do. It’s how I think. And it’s how I approach targeted improvements in other areas — such as our household’s electricity consumption, for instance.
Data driven
You won’t be surprised to learn that I take the same data-driven approach to investing. Indeed, readers with long memories will perhaps remember me mentioning spreadsheets and charts in previous columns.
And it’s an approach I’ve seen taken by other investors, too — some with multi-decade investing experience behind them.
What do they track? What do I track? Whatever we want, in short. Whatever suits our own investment circumstances and strategies, in other words. That’s the beauty of a spreadsheet-driven approach, as opposed to a tool such as Microsoft Money, or one of the proprietary portfolio-tracking tools that are out there.
Nor is the use of the word ‘strategies’ in the paragraph above without significance. I firmly believe that investing should be strategy-directed, and have some of goal in mind. In which case, it is only rational to measure progress towards achieving that goal.
Data that I capture
It’s no secret that these days I’m an income investor. And so, since 2005, my primary spreadsheet has been income-focused, measuring my progress in building up an investment income from a portfolio of individual shares.
The first ‘tab’ in the spreadsheet records progress within a given year: total new cash added, total dividends received, net share purchases, cash at year-end, and some columns of totals designed to inform a number of yield calculations: equity valuation, total new cash, and total bought cost.
Fairly obviously, then, I’m capturing yield as a percentage of equity valuation, yield as a percentage of new cash invested, and yield as a percentage of bought cost. Another column — and probably the least important one — captures profit against the year-end valuation. Finally, a column captures noteworthy comments of the year in question, and I also capture total annual dividend payments by company.
And, as I say, I have all that data and analysis going back to 2005.
Steady as you go
So how am I doing, in terms of investment performance?
Thanks to the spreadsheet, I know. Objectively, not subjectively. Factually, and with real clarity.
Dividend income has increased, year on year. Yield on bought cost is satisfactory. Yield as a percentage of equity valuation fluctuates as capital values fluctuate, but is also satisfactory. And capital values have fluctuated — but then, global financial crises, pandemics, and unexpected national referendum outcomes tend to have that effect.
In other words, steady as you go. I have an investment strategy, and my spreadsheet tells me that it’s working reasonably well.
Other spreadsheets track other aspects of my retirement income planning. Overall, I’m holding the planned course.
Equities still win out
But should you even bother? Granted, retail investors are waking up to these opportunities. But from what I’ve read, it’s wealthier, more sophisticated investors, often with prior bond market experience.
Better by far, I think, is to stick with equities. Plenty of UK blue-chips yield more than bonds and gilts, and also offer capital upside.
Last time I looked, the FTSE 100 was trading on a price-to-earnings (P/E) ratio of 13, and the FTSE All-Share a P/E of 14. America’s S&P 500 20. The broader Russell 2000? 25.
I know where I see the greater prospect of an upwards re-rating.
Why not?
Perhaps you already have such a spreadsheet, designed to suit your own particular needs. I know lots of investors do.
But perhaps you don’t already have a such a spreadsheet — and I know lots of investors don’t.
“It’s too late,” I hear you say. “I started investing several years ago. I’m not sure that I’ve kept all the paperwork.”
No matter: every investing platform that I know of keeps records of investors’ trades — even if they’ve since moved their investments elsewhere. The information is out there, and you can access it, and build your spreadsheet, just as if you’d maintained it right from the start of your investing journey.
Don’t have Microsoft Office? There are alternatives, such as Libre Office. And even a free, online version of Microsoft Excel, maintained by Microsoft.
If the will is there, the means are there. What have you got to lose?
The post Data-driven investing appeared first on The Motley Fool UK.

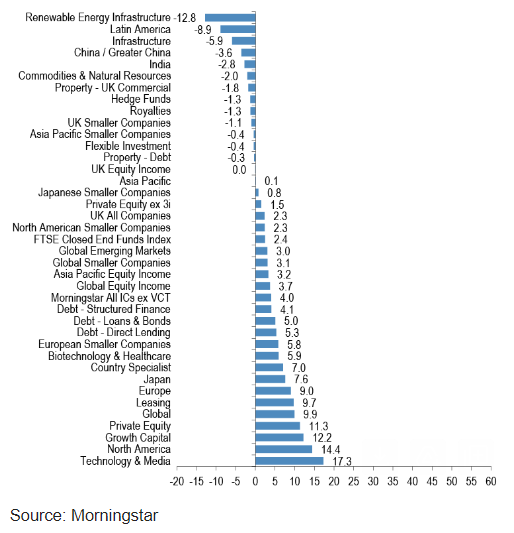 Renewable Energy Infrastructure off 12.8% during the quarter, Technology & Media up 17.3% – the two bookends. In between, a wide range of returns.
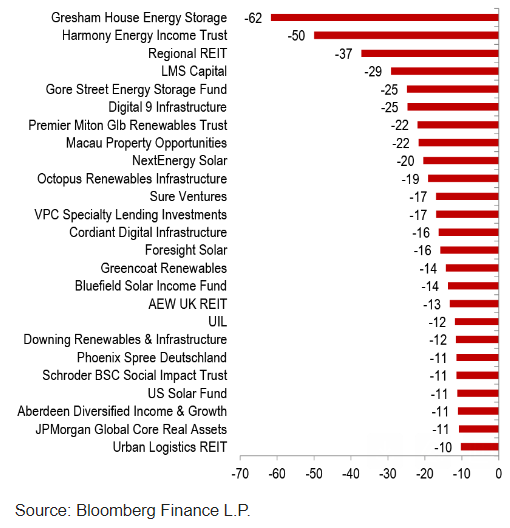
 Interestingly, last year’s top-performer 3i Group (III) follows up this year with a 16% Q1 gain, enough to place the private equity giant in joint ninth.