How London’s investment companies fared in Q1 2024
With Q1 coming to a close we take a look at which Investment Trusts, stocks and sectors have caught the eye.
ByFrank Buhagiar•17 Apr, 2024

Phew, that was quick – anyone else think Q1 2024 flew by in the blink of an eye? With the first quarter of the year done and dusted, that can mean only one thing – it’s time for our Q1 round-up of the movers and shakers in London’s investment trust space. Which funds had a good quarter? And which trusts had one to forget?
Q1 – An Overview
JPMorgan provides an overview for the year thus far: “2Q24 was generally a good one for stock markets, with the US a key driver, with the S&P500 up 11.8% (all figures in £), also driving the MSCI World Index, which was up 10.2%. Growth outperformed value, with the MSCI World Growth up 11.5% and MSCI Value up 8.7%. Japan was also a notably strong performer, with TOPIX up 11.1%, and Europe outperformed EM and Asia ex Japan with a 6.8% return from the FTSE Europe ex UK. The UK, as measured by the FTSE All Share, was up 3.6%, with large caps outperforming mid and small (FTSE 100 +4.0% vs FTSE 250 +1.6% and Numis SC ex ICs +0.2%).”
A positive quarter for markets then, but was it a positive quarter for investment companies?
Back to JPMorgan: “The overall sector, as measured by the FTSE Closed End Investments sector (which does not include 3i), was up 2.3% over the quarter.” So, positive performance for the sector, although not enough to match the All Share, let alone the double-digit returns seen in the US or the MSCI World Index.
As for the discounts at which share prices traded at compared to underlying net assets, Numis reports a marginal widening of discounts during Q1: “Our figures, show that the average discount of the universe, excluding 3i Group, widened slightly in Q1 from 13.9% at December to 16.0% at 31 March. This included discounts on Equity ICs widening marginally from 10.1% at December 2023 to 11.5% at 31 March, whilst Alternative Asset ICs, excluding 3i, widened from 19.6% to 23.1%.”
Where does an average discount of 16% fit historically? Numis provides the graphic below:
Investment Companies Universe – Long-term discount history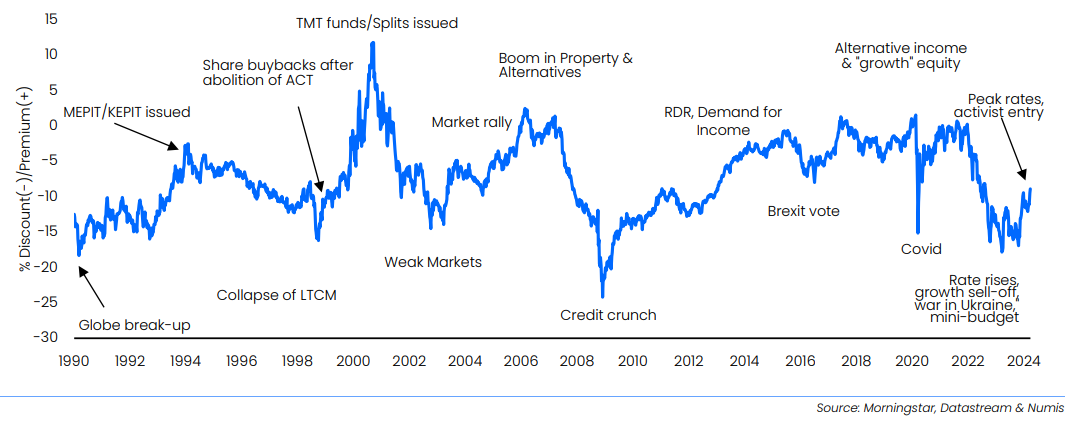
A 16% discount, nothing like the depths seen during the Credit Crunch, but equally some way off the premia that prevailed in the early 2000s.
Winners and losers at the sector level
The 2.3% generated by the closed-end index over the quarter is just a headline, one that masks a wide dispersion of returns at the sub-sector level – as Numis writes, “we caution that the universe is so diverse that aggregated figures are of limited use.” To see what the broker means, look no further than the winners and losers at the sector level.
Winners first, funds with tech exposure stand out – no surprise given the continued strong showing by the US tech mega caps. Numis notes: “Technology ICs continued to lead the pack, with the technology exposure also benefiting North American ICs and Global ICs in absolute terms, albeit most ICs lagged benchmarks, which remain concentrated on a few mega-cap stocks.”
At the other end of the scale, Numis writes: “The expectation of higher for longer rates impacted sentiment towards Infrastructure ICs, including Renewable Energy ICs, where investors were also wary of lower power prices. Battery Storage funds were notable laggards as the challenging revenue environment led to dividend suspensions.”
The graphic below from JPMorgan adds some colour in the form of the relevant numbers for all subsectors:
AIC Sector price TR (%) 1Q24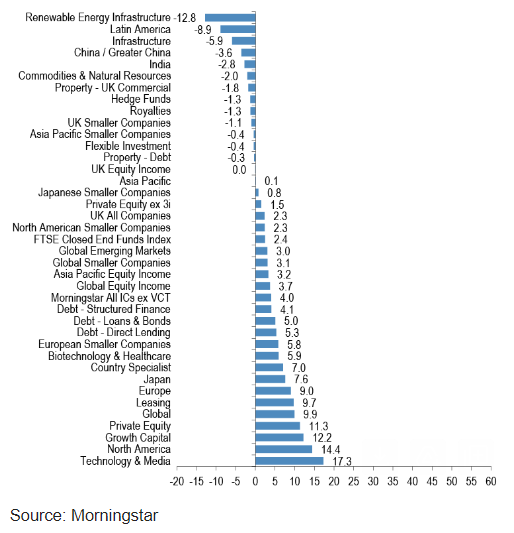 Renewable Energy Infrastructure off 12.8% during the quarter, Technology & Media up 17.3% – the two bookends. In between, a wide range of returns.
Winners and losers at the stock level
The same is true at the stock level. The worst performing fund in Q1 declined -62.4%, the best performer rose 43%. Among Q1’s worst performers, unsurprisingly, renewables, specifically battery storage investment companies, feature heavily in the below list from JPMorgan:
Q1 24 Worst performance (% price TR)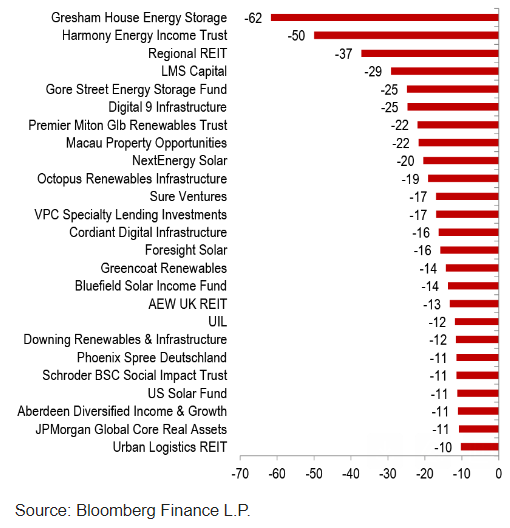
Similarly, tech-focused names such as Manchester & London, Polar Cap Technology and Allianz Technology feature in JPMorgan’s below graphic for Q1’s top-performing trusts:
Q1 24 Best performance (% price TR)
 Interestingly, last year’s top-performer 3i Group (III) follows up this year with a 16% Q1 gain, enough to place the private equity giant in joint ninth.
Eagle-eyed readers will have no doubt noticed the clumsy crossing out of the name of Q1’s top-performing investment company. No accidental spilling of ink here. Instead, a clumsy attempt to build up a little suspense. The big reveal though cannot be put off any longer. The top-performing investment company in Q1 2024 is none other than space investor, Seraphim Space (SSIT) courtesy of an eye-catching 43% gain.
Question is, after such a stellar opening three months of the year, can SSIT kick on
from here and consolidate top spot? It’s a question that’s been on broker Winterflood’s mind too if the title of their recent note is anything to go by.
Seraphim Space (SSIT): Stick or Twist?
Firstly, hats off to Winterflood for including SSIT in its 2024 Recommendations List. SSIT’s inclusion was “based on the structural tailwinds benefiting the SpaceTech sector, tangible progress at the portfolio company level and a share price which roughly implied that all but the fund’s top two holdings were worthless.” Following the strong share price performance, Winterflood used the release of SSIT’s interim results in March to ask, “is it time to take profit, or does substantial runway remain (either from a ratings or underlying performance perspective)?”
In terms of numbers, SSIT reported a 1.8% increase in NAV per share. In terms of words, Chair Will Whitehorn sounded cautiously optimistic in his statement, “Indications of inflation being tamed and interest rates having peaked has resulted in some evidence of improved sentiment in both the private and public markets. We continue to believe that SSIT’s current cash reserves are sufficient to meet the near-term capital needs of the portfolio”.
Winterflood found the results encouraging: “There are certainly encouraging signs in these results, with portfolio company fundraising clearly illustrating investor demand. Sector tailwinds remain intact, with satellite imagery in high demand across applications such as national defence and sanctions compliance. This is reflected in the market, with VC investment in SpaceTech flat YoY in 2023 vs -35% for VC investment overall. In particular, the guidance on c.40% of the portfolio (by value) showing positive EBITDA by year-end is constructive, and with 60% of the portfolio funded to profitability, concerns around cash constraints should be eased.”
So, even though Winterflood “can see how locking in profits on SSIT may be tempting at this stage, particularly if the position was initiated recently”, the brokers “point out that the SSIT discount remains relatively wide at 36%”. What’s more, “we see room for further tightening as the year progresses, alongside the potential for valuation uplifts as portfolio companies raise funds and execute on their targets and partnerships. We therefore reiterate the fund’s inclusion in our 2024 Recommendations.”
All to play for
Winterflood thinks SSIT can kick on from here then. But will it be enough to hold onto top spot? Or will III manage to chip away at the lead? Perhaps another fund will come from nowhere to finish top of the tree? After all, the race to be the year’s best is only just beginning.
Hey there! Would you mind if I share your blog with my
twitter group? There’s a lot of folks that I think would
really enjoy your content. Please let me know. Many thanks
Your article helped me a lot, is there any more related content? Thanks!