Considering FGEN’s FY25 results

Dear reader,
I looked at FGEN last November and a few readers asked me to look again given its annual results release for the year to 31/3/25.
FGEN’s portfolio now comprises 40 assets across the UK and Europe, diversified across renewable energy generation (73% by value), sustainable resource management (17%), and other energy infrastructure (10%). Key holdings include the Cramlington biomass plant, the Rjukan aquaculture facility in Norway, and wind, solar, and anaerobic digestion projects in the UK.
FGEN’s net asset value (NAV) per share declined by 6.3% over the reporting period, from 113.6p to 106.5p. This was partly the write off off its investment in hydrogen platform HH2E – and otherwise good old discount rates.
I wrote yesterday about how fellow IT SEIT is at a 9.6% discount rate. FGEN is at a slightly higher 9.7% rate. The rate appears very high even for comparable assets (e.g. Gore Street BESS are 7%-9% vs 10.3% here.
The discount rate is made up of the following rates:
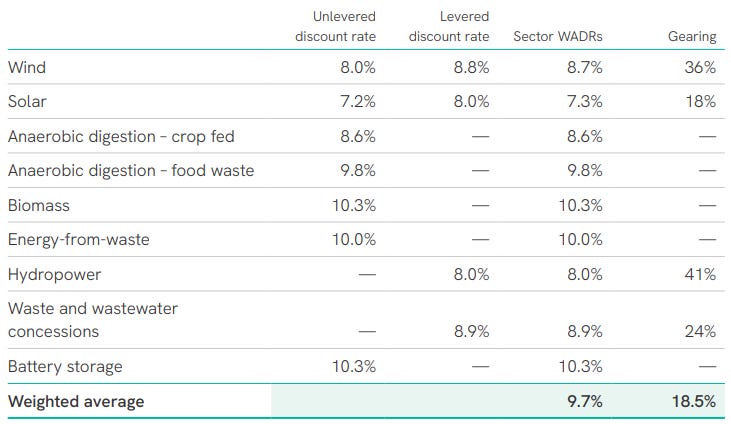
An increase in the discount rate of 0.5% would result in a downward movement in the portfolio valuation of £17.2 million (2.7 pence per share) compared to an uplift in value of £18.0 million (2.8 pence per share) if discount rates were reduced by the same amount.
So compared to NESF’s 8% rate FGEN would gain £61.2m to be at 8% too.
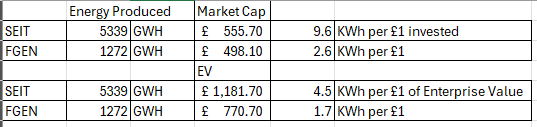
Energy Generated:
1.27 TWh is 50% more than NESF but still sits below SEIT.
Power curves once again are, based on the forecasts of 3 experts due to be dropping away in the years ahead even though the 2024 power curve forecast for 2025 was well below the current 2025 rate (incorrect by about £15/MWh). If these experts can’t even forecast 1 year ahead accurately how much credence should you give to 5 years or 10 years?
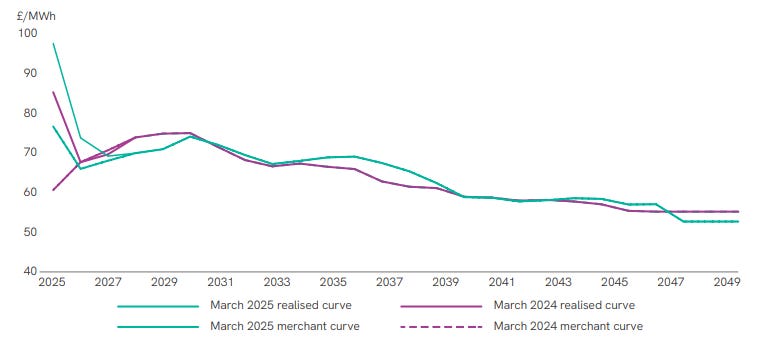
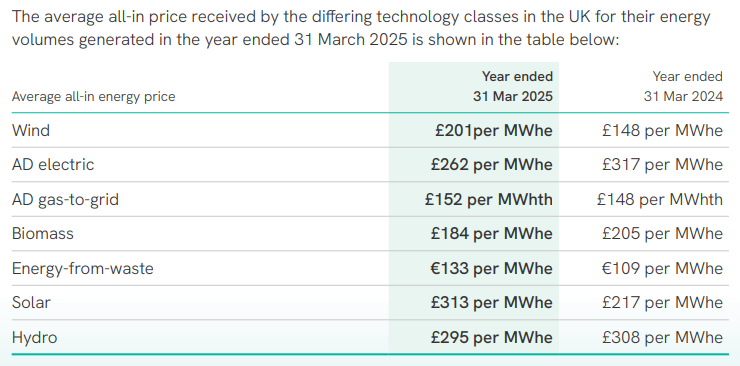
Of course the power curve also bears little resemblance to the energy prices FGEN quote in their investment manager’s report:
EBITDA of £131.6m?
Now this is interesting since an FY25 EBITDA of £131.6m for FGEN compares very favourably to a SEIT’s EBITDA of just £86m. Favourably to the £678.7m NAV closing value.
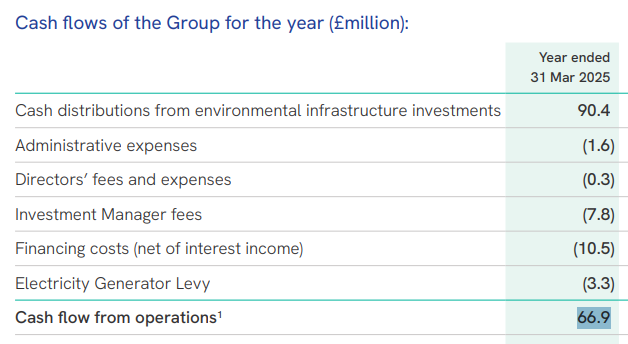
So how are cash distributions so different to EBITDA? £90.4m of what might be approximated to be free cash flow (and is much lower than SEIT’s) nets to £66.9m as what appears to be a better proxy to the “real” returns for FGEN.
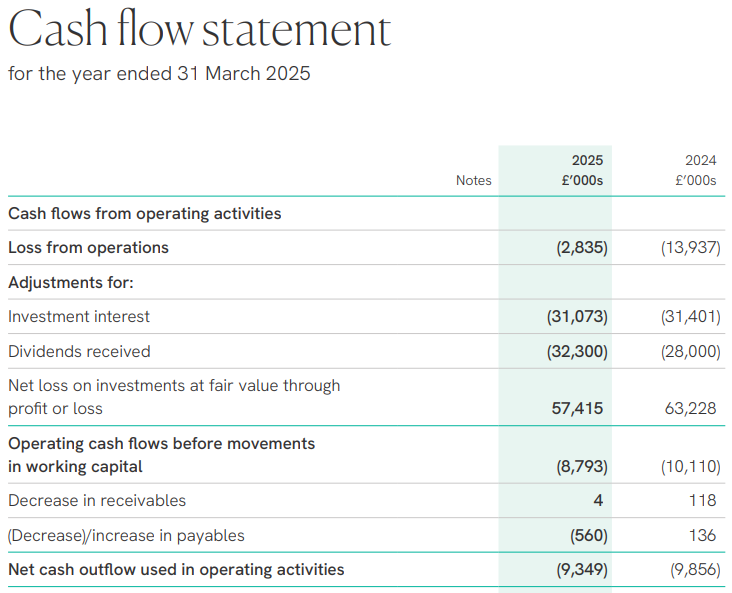
It mirrors the £63.4m of interest and dividends that FGEN earned as below.
I suspect the answer to this riddle is the EBITDA was £131.6m and FGEN own half those portfolio companies. It’s pretty frustrating to not just be given facts in a consistent manner.

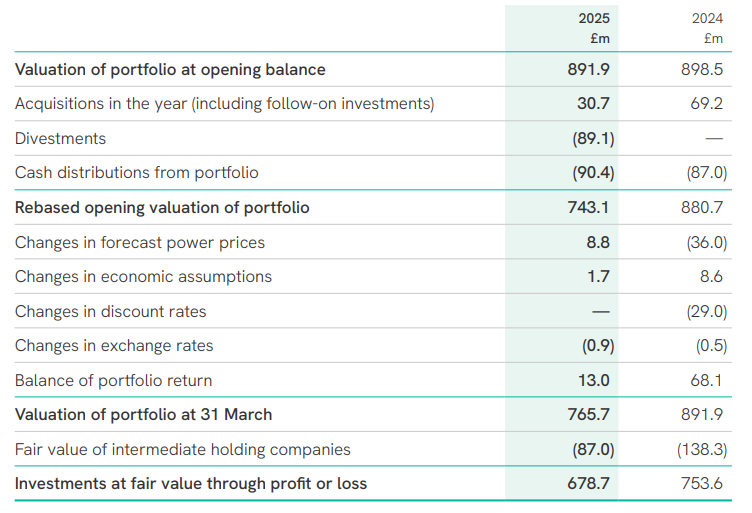
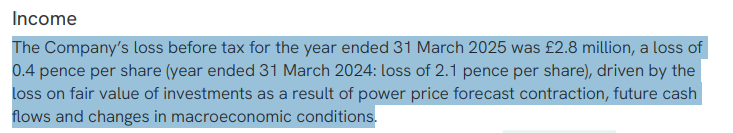
Of course the statutory result was a loss due to a £57.4m fair value loss. We are told this is due to a power price forecast contraction and future cash flows. Well you know what I think of that.
Judging by the 92% operational and 8% in construction there isn’t much still to complete, but a review of the actual assets under construction reveals a vast array of big ticket items (e.g. a 0.75GW interconnector). Again a riddle, but the answer must be FGEN is taking a minority ownership. Perhaps even just 2%-5%.
Dividends and Capital
Of course a 2.1% dividend increase for FY26 to 7.96p per share and covered 1.32x by operating cashflow. FGEN has delivered consistent annual dividend growth over numerous years.
On top of dividends there were also NAV-accretive share buybacks and a £1.3m gain from asset disposals. The NAV total return was +0.6%. During the year, the company completed £88.6m of asset disposals (equivalent to approximately 10% of its portfolio), all at or above carrying value. The proceeds were used to repay floating rate debt and fund a £30m share buyback programme, of which £24.3m had been deployed by the end of March. Gearing was reduced to 28.7% from 31.2%, maintaining FGEN’s position among the least leveraged funds in the sector.
The Future
FGEN’s strategic review concluded a refocused strategy centred on proactive asset management and disciplined capital allocation would best serve shareholders. Quelle surprise.
FGEN say they will prioritise new investments in core environmental infrastructure sectors – including renewables, energy storage, and sustainable resource management – that offer long-term, stable, inflation-linked revenues. Investments in higher-risk growth assets will be limited. It intends to monetise existing positions in platforms such as the Glasshouse, Rjukan, and CNG Fuels when they reach maturity and can command premium valuations. The portfolio will instead focus on income-generative assets and value enhancement at operational sites.
Investment manager’s fees change from 1 October 2025, where the base management fee will be calculated on a blended metric of 50% NAV and 50% market capitalisation (capped at NAV), replacing the previous NAV-only basis.
Conclusion
I am trying not to say meh. Oops just said it.
FGEN has a 10% yield, and the share price is up from a 66p low to 80p a share but there’s still a 31% discount to NAV. The discount rate and the power price assumptions make that 106.5p very likely to be understated. There are various assets coming on line in FY26 too. FGEN have said they are going to stick to their knitting with inflation-linked returns.
I’m just not convinced that there’s any great upside here. The investment manager manages to say a lot and presents well but leaves me not feeling excited. I previously said that FGEN is “a decent way to earn solid dividends and where the margin of safety appears higher than the market perceives.” I still believe that that’s true. Even more so today.
So FGEN appears a trusty plodder but not an Arabian thoroughbred. What horse do you want in your portfolio?
Regards
The Oak Bloke
Disclaimers:
This is not advice – make your own investment decisions.
Micro cap and Nano cap holdings, even FTSE250 companies like SEIT, might have a higher risk and higher volatility than companies that are traditionally defined as “blue chip”
What horse do you want in your portfolio?
Both would be nice.
A 9% dividend is round about the long term gains in the FTSE all share index.
With the dividend increases this could be better than an all share ETF.