Results analysis: Octopus Renewables Infrastructure (ORIT)

ORIT continues to execute on its 2030 strategy.
Alan Ray Updated 31 Mar 2026
Disclaimer
This is not substantive investment research or a research recommendation, as it does not constitute substantive research or analysis. This material should be considered as general market commentary.
- Octopus Renewables Infrastructure’s (ORIT) annual results to 31/12/2025 show a NAV total return of -2.8% (2024: +2.5%). At an operational level, ORIT’s power generation and revenues grew by 5% (2024: 7% and 12%), and EBITDA by 3% (2024: 16%). Total shareholder return was -1.5%.
- ORIT met its dividend target of 6.17p, 1.14x covered by operating portfolio cash flows (2024: 6.02p, 1.24x). The dividend was an increase of 2.5% over 2024, in line with UK CPI for a fourth consecutive year. The target dividend for the year ending 31/12/2026 is an increase of 1% to 6.23p and is expected to be fully covered. At the current share price (as at 30/03/2026) the yield is c. 10.9%.
- The NAV per share was 93.8p (2024: 102.6p), a c. 9% decline. The main components of the fall were adjustments for power prices and green certificates (-4.2p), RoC indexation adjustments (-0.9p), adjustments to developer valuations (-1.4p) and changes in discount rates (-0.7p).
- ORIT’s weighted average discount rate, in local currency terms, increased to 7.8% (2024: 7.4%). ORIT’s discount rate is calculated on operational assets, and factoring in the developer company assets as well as impacts of FX and the RCF, the expected portfolio return is 8.2%.
- Fixed revenues rose from 84% to 88% (forward fixed for two years), reducing ORIT’s exposure to short-term power price fluctuations. In addition, about half of revenues are inflation-linked over ten years.
- ORIT was geared 45% LTV or 82% as a percentage of NAV (2024: 45%), although the level of debt was reduced in absolute terms, with c. £56m paid down over the year. 75% of debt is fixed rate with an average cost of 3.3% and an average remaining term of ten years. The medium-term goal is to reduce gearing to 40% although the managers note this level could fluctuate on a short-term basis.
- ORIT defines itself as an impact fund with a core impact objective of accelerating the transition to net zero through its investments and is classified under Article 9 of SFDR. The impact highlight from the financial year is 1,304 GWh of renewable energy generated (2024: 1,240 GWh), with the portfolio having the potential to avoid 344k tCO2. A detailed breakdown including the cumulative impact over five years is in the annual report.
- Capital allocation policy update:
- Disposals totaling £74.3m brought the total under the policy implemented in 2023 to £235m, achieved at a weighted average uplift of 9%.
- £26m of the £30m share buyback now executed.
- ORIT 2030. In September 2025, the board announced its ‘ORIT 2030’ strategy, which sets out its four priorities for the next five years.
- Grow: Invest for NAV growth, deploying capital into higher growth investments, including an increased 20% target allocation to construction assets, maintaining the current 5% allocation to developers. There will also be a greater focus on asset improvement and disciplined capital recycling.
- Scale: Target £1 billion net asset value by 2030, to create a more liquid and investable company. Alongside investment growth, this could include corporate M&A.
- Return: Target medium-to-long-term total returns of 9-11% through a combination of capital growth and income, maintaining the progressive dividend policy, while preserving full cover and targeting medium-term gearing below 40%, although this level may fluctuate in short-term periods as mentioned above. Retain diversification across core technologies and geographies.
- Impact: Aim to build approximately 100 MW of new renewable capacity per annum (on average over the five-year plan).
As part of the ORIT 2030 strategy, the board is also recommending that the continuation vote moves to a cycle of every three years, from the current five. The change will be put to a vote at the 2026 AGM, with the next continuation vote then held at the 2028 AGM.
Chair Phil Austin said: “The ORIT 2030 strategic framework provides a clear structure for capital allocation and portfolio development over the medium term. The actions taken during FY 2025, particularly in relation to capital recycling, operational optimisation and capital structure discipline, are consistent with the early execution of this strategy.”
Kepler view
Once again, at an operational level, ORIT delivered good performance, with an increase in power generation and revenues. The ORIT management team also note that at a technical level, the portfolio performed well, with less downtime than expected. And diversification played an important role, with lower wind speeds offset by strong performance from solar assets, particularly in the UK.
Further, ORIT completed its fourth consecutive year of dividend growth, essentially increasing its dividend in every full operational year since its IPO. The target for the FYE 31/12/2026 is a further increase, albeit at a lower rate of 1%. Whereas the dividend policy has never explicitly targeted matching inflation, in the past ORIT’s dividend increases have been in line with UK CPI inflation. As ORIT shifts to its ORIT 2030 strategy, which targets higher returns through more investment in construction assets, and strategic recycling of operational assets, the goal remains to target a progressive dividend, but as the strategy evolves clearly a greater exposure to non-yielding construction assets will make it harder to increase dividends in line with inflation. Overall, though, the anticipated result of this shift is an increase in annual returns of 9-11%, up from the 7-8% envisaged at IPO.
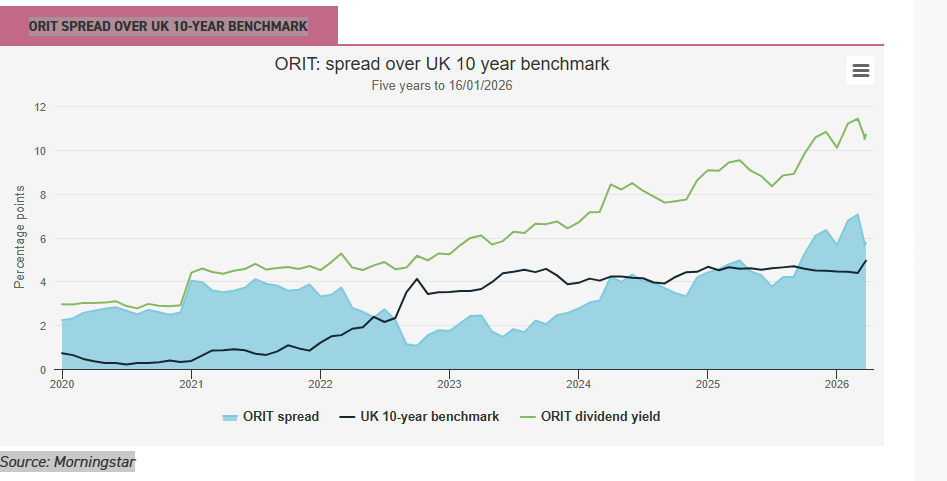
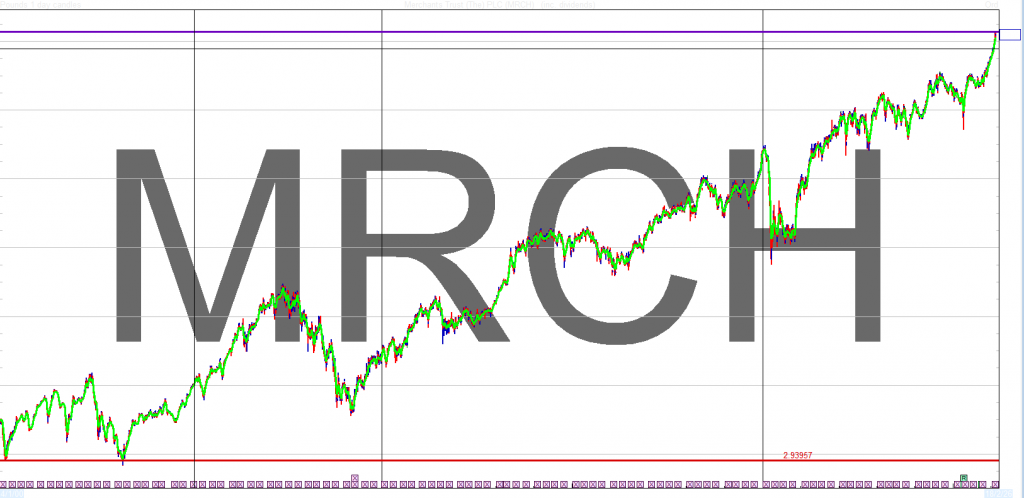
Clearly though, the macro backdrop remains challenging, with ORIT’s peer group of renewable energy infrastructure trusts all trading at wide discounts and, in many cases at dividend yields of 10% or more. This is an interest-rate sensitive asset class, and current events in the Persian Gulf are taking their toll on government bond yields, with the UK 10-year benchmark bond yield briefly touching 5% in recent days. ORIT’s near-term power prices are 88% fixed (for two years) so a short-term spike in energy prices will have little impact, although if longer-term futures rise, there may be opportunities to fix at higher rates further out. Rising interest rates will have an impact, but given these are likely to be a response to higher inflation, and half of ORIT’s portfolio is inflation-linked, revenues would rise, providing partial protection. So, there are push and pull factors that investors need to consider. But in considering the chart below, which shows ORIT’s dividend yield as a spread over the above mentioned 10-year benchmark, it’s worth reflecting that this lifetime-high gap comes at a time when, once again, the UK and other European countries are under pressure to evolve their energy security policy. Notwithstanding the uncertainty around bond yields and inflation, the valuation of assets that generate power without any reliance on global hydrocarbon supply chains seems like an anomaly investors should be paying more attention to.
Orit spread over uk 10-year benchmark